Keywords
diagnostics, forecasting, archetypes, costs, probability of success, portfolio, P2I
This article is included in the TDR gateway.
diagnostics, forecasting, archetypes, costs, probability of success, portfolio, P2I
The Portfolio-To-Impact (P2I) model is a financial forecasting tool developed by the Special Programme for Research and Training in Tropical Diseases (TDR)1. The model enables users to estimate funding requirements for development of a portfolio of candidate health products, from late stage preclinical studies to phase III clinical trials, and estimates the number of potential product launches over time, as well as the probability of success of health products. The P2I v.2 model allows a range of different types of medical products to be assessed, including drugs, biologics, vaccines, and diagnostics. These are described as ‘archetypes’ and have further subdivisions within the model depending on the complexity of the product1,2. The model is intended to be continually refined and improved, and users are encouraged to provide inputs to update key parameters and assumptions. In line with this, a second iteration of the model (P2I v.2) that includes additional archetypes and has modified cost assumptions was subsequently developed and used to estimate research and development costs associated with a pipeline of candidates for 35 neglected diseases2. The model has also been used to assess the vaccine portfolio of the European Vaccine Initiative (EVI), which includes vaccine candidates for various diseases of poverty and emerging infectious diseases3.
The development pathway for diagnostics differs considerably from that of pharmaceuticals and vaccines, as they do not follow the traditional pathway from preclinical to phase III studies. Rather, after initial concept and research and feasibility planning, diagnostics move from the design and development phase directly to clinical validation, approval and launch4,5. However, there is a lack of academic literature available on development characteristics for diagnostics, thus the archetypes and assumptions used within the P2I v.2 model were based solely on interviews with diagnostics developers and other diagnostic experts. Based on the experience of the Foundation for Innovative New Diagnostics (FIND), a product development partnership (PDP) focusing on diagnostics for diseases of poverty6, the diagnostic assumptions in the P2I v.2 model tend to underestimate the research and development costs and timelines for diagnostic discovery and early stage development. Additionally, due to the complex nature of the diagnostic landscape, the archetypes and assumptions in P2I v.2 may not accurately describe all diagnostics. A range of factors can impact diagnostic research and development costs, timelines and probability of success, including the underlying technology of an assay, the maturity of the manufacturing company and their expertise and experience (in clinical, regulatory, quality management and infectious disease areas, as well as in assay development), the disease area, ease of obtaining samples for validation, and the Stringent Regulatory Authority (SRA) being pursued.
FIND has a large diagnostics pipeline across six disease areas (antimicrobial resistance, hepatitis C and human immunodeficiency virus [HIV], malaria and fever, neglected tropical diseases, tuberculosis [TB] and pandemic preparedness), and plans to use the P2I v.2 model as a complementary tool to existing portfolio management methods for prospective scenario planning, to inform funding decisions, refine technology assessments, and predict product launches and estimated research and development costs. The objective of this study was to propose revisions to the P2I v.2 diagnostic archetypes and assumptions, to improve accuracy of predictions for diagnostic portfolios, and to compare outputs of the revised model with the original P2I v.2 tool.
This work was carried out between April and December 2019. Data to inform the refinement of the P2I v.2 tool were collected through two methods: a) expert interviews and b) collection of historical data on development of existing diagnostics. The expert interviews were performed by the FIND project team. Seven experts with experience in diagnostic development in both high-income countries (HICs) and in low- and middle-income countries (LMICs) were asked if they were willing to be interviewed; all experts were either employees of FIND, consultants, or FIND external partners (Table 1). We obtained consent orally before the beginning of the interviews. Interviewees were provided with background information about the P2I v.2 tool, and were asked to give feedback on the tool’s diagnostic assumptions in relation to at least one product that they had supported through development. Data ranges for research and development costs, development timelines, and probability of success per product development phase were collected.
The historical data for existing diagnostics (ideally commercially available tests) were retrieved from the database housed by Halteres Associates (San Ramon, CA, USA), a consulting company with extensive experience in diagnostic development. A set of 26 diagnostic products for which sufficient data were available were selected from a broad group of product types and product development stages (Table 2). Research and development costs were approximate, and were based either on information from the companies themselves or from persons with knowledge of the companies; additionally, a number of the products were not yet marketed, thus final numbers for research and development costs and timelines were not available. As such, ranges for research and development costs and timelines were used except where otherwise stated.
| Diagnostic test description | Discovery | Design and development | Clinical validation and launch readiness | Commercialization (up to 3 years) cost (US$ million) | |||
|---|---|---|---|---|---|---|---|
| Alpha trial cost (US$ million) | Alpha trial time (years) | Beta trial cost (US$ million) | Beta trial time (years) | Cost (US$ million) | Time (years) | ||
| IA hs-Tni | 5–10a | 2–4 | 5–10a | 2–5a | 2–5 | 2–3 | 2–5 |
| hs-HCV Ag | 1–2 | 1–2 | 1–2 | 1–2 | 2–5 | 2–3 | 1–2 |
| Lat TB | 2–5 | 2–3 | 1–2 | 1–2 | No data | No data | 2–5 |
| CMOS HIV VL | 5–10b | 2–3 | 2–5c | 1–2 | 5–10 | 2–3 | 2–5 |
| RDT HIV-ST 1 | 1–2 | 2–3 | 2–3 | 1–2 | 1–2 | 2–3 | 0.5–1 |
| NAT PC | 5–10 | 3–5 | 5–10 | 2–5 | 10–25 | 2–3 | 5–10 |
| HCV VL | 1–2 | 1 | 2–5 | 1–2 | 5–10 | 2–3 | 2–5 |
| IA hs-TSH | 20–50d | 3–5 | 2–5e | 1–2 | 2–5e | 1–2 | 5–10 |
| RDT CAA | 0.5–1 | 1–2 | 1–2 | 1–2 | 1–2f | 1–2 | 0.5–1 |
| RDT Ov16 | 0.5–1 | 1–2 | 1–2 | 1–2 | 1–2f | 1–2 | 0.5–1 |
| PCR BC Recurrence | 150 | 3–5 | 10–25 | 2–5 | 10–25 | 1–2g | 10–25 |
| Central IA RA | 10–25 | 3–5 | 5–10 | 1–2 | 10–25 | 1–2g | 5–10 |
| NAT PCR HAI | 10–25 | 8–12 | 5–10a | 2–5 | 10–25 | 3–5h | 5–10 |
| Cell CD4 | 2–5 | 3–5 | 5–10a | 1–2 | 2–5 | 1–2 | 0.5–1 |
| RDT HIV-ST 2 | 0.5–1 | 1–2 | 2–3 | 1–2 | 1–2 | 2–3 | 0.5–1 |
| NAT HPV | 0.5–1 | 0.5–1 | 6.5 | 2–5 | 29 | 2–3 | 5–10 |
| NAT HIV VL 1 | 0.5–1 | 0.5–1 | 4.5 | 2–5 | 9 | 2–3 | 5–10 |
| NAT TB AMR | 10–25d | 3–5 | 2–3 | 1–2 | 5–10 | 1–2 | 0.5–1 |
| IA CrAg | 0.5–1 | 1–2 | 2–3 | 1–2 | 2–5 | 1–2 | 2–5 |
| NAT HIV VL 2 | 10–25d | 3–5 | 5–10 | 2–5 | 5–10 | 2–3 | 2–5 |
| TB LAM | 2 | 1 | 1 | 0.5 | 0.1 | 0.5–1 | 0.1 |
| Cell CBC | 10–25 | 8–12 | 5–10a | 2–5 | 10–25 | 3–5h | 5–10 |
| RDT HIV | 0.5–1 | 1–2 | 1–2 | 1–2 | 1–2 | 1–2 | 2–5 |
| NAT TB | 2–5 | 1–2 | 5–10 | 2–5 | 2–3 | 5–10 | |
| NAT Malaria | 2–5 | 3–5 | 2–5 | 1–2 | 5–10 | 2–3 | 2–5 |
| IA Malaria | 2–5 | 3–5 | 5–10 | 2–3 | 5–10 | 2–3 | 2–5 |
aIncluding instrument; bincluding manufacturing system; cwith new organization; dincluding instrument and disposable or cartridge; eassay only; fno regulatory; gCLIA LDT; hFDA. Products are not ascribed to a specific company due to confidentiality agreements. Ag, antigen; AMR, antimicrobial resistance; BC, breast cancer; CAA, circulating anodic antigen; CBC, complete blood count; CLIA, Clinical Laboratory Improvement Amendments; CMOS, complementary metal-oxide semiconductor; CrAg, Cryptococcal Antigen; FDA, United States Food and Drug Administration; HAI, haemagglutination inhibition assay; HCV, hepatitis C virus; HIV, human immunodeficiency virus; HPV, human papillomavirus; hs, high-sensitivity; IA, immunoassay; LAM, lipoarabinomannan; Lat, latent; PC, pancreatic cancer; RA, rheumatoid arthritis; RDT, rapid diagnostic test; ST, self-test; TB, tuberculosis; Tni, troponin I; TSH, thyroid stimulating hormone; VL, viral load.
Diagnostic archetypes were determined by identifying clusters among the 26 products with similar estimates for research and development costs, timelines and probability of success. This was done by calculating a composite ‘level of risk’ score that comprised factors thought to have most impact on these three assumptions. Initially, the following factors were included: target product profile, biomarker status, assay technology, instrumentation, per assay development costs, system development costs, regulatory requirements, preclinical/clinical studies, team competence, financial strength, payment/reimbursement model, product line extension, voice of customer, partner options, market development and commercialization plan/budget, entity stability, number of tests needed, and market demand/development. From this list, 15 factors were extracted that were believed to have the most impact (resulting in the removal of entity stability, number of tests needed, and market demand/development from the list), and the list was then further reduced for practicality of scoring, to obtain a set of eight criteria. Each of the 26 products was then assessed using the eight criteria, scored on a scale of 0 to 3 (Table 3). Approximate groupings were then determined based on the level of risk score.
In order to compare the two models, data on the products from two of FIND’s portfolios, TB and pandemic preparedness, were input into the P2I v.2 model, using the original diagnostic assumptions and archetypes (Table 4 and Table 5) and using the revised diagnostic assumptions and archetypes collected from the expert interviews and the historical database of 26 existing diagnostics. The research and development cost and timelines to move the candidates from the two FIND portfolios through the pipeline, and to estimate the likely number of launches per disease, was estimated. The model assumed a 2019 start, with all diagnostic candidates inputted based on their development phase at the time of review.
This table is adapted from reference 2 under a CC-By 4.0 license.
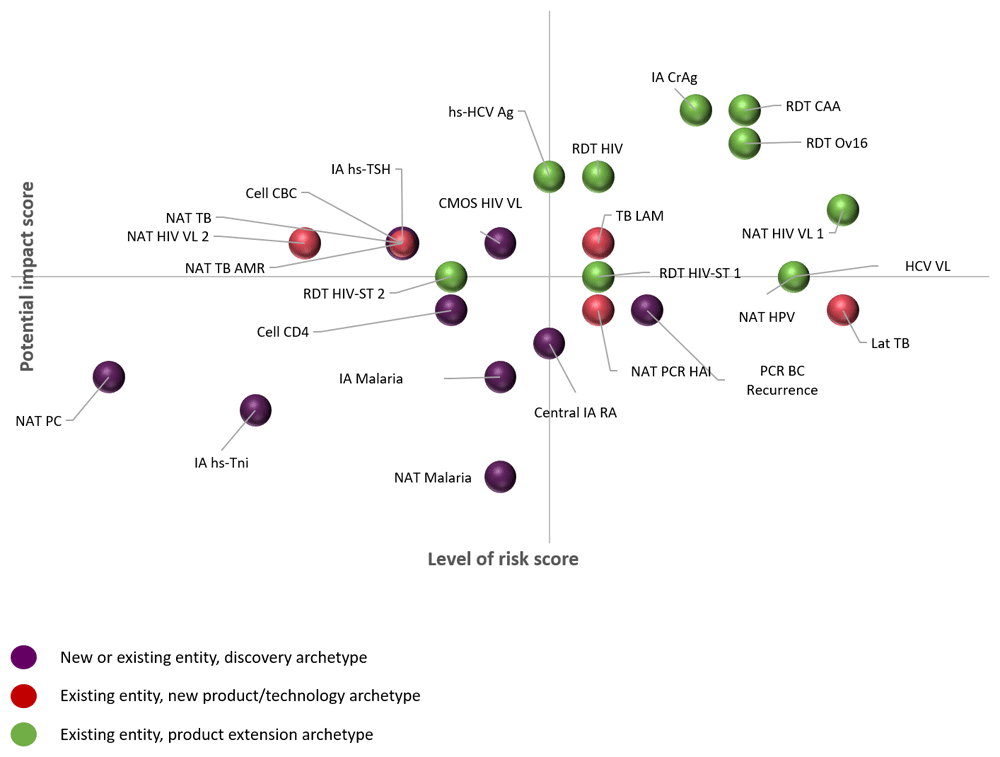
It can be challenging to compare diagnostic opportunities when they have comparable levels of risk. In these cases, the potential public health impact of a diagnostic can be a valuable differentiating factor. Factors that can influence the potential public health impact of a diagnostic product were identified from the historical database of 26 diagnostic products. Ten factors were identified; these were: increase in number of patients/year receiving appropriate treatment, cost per result, improvement in guideline adherence, time to intervention, improved access to critical data, support for diagnostic, surveillance or outbreak programmes (as intended), impact metrics, change in disease incidence or prevalence, reduction in loss to follow-up, and change in morbidity or mortality. The list was reduced to seven factors with the most influence, and a potential impact score for ranking was developed, scored on a scale of 0 to 3 (Table 6). Each of the 26 products from the historical database was scored according to this system.
Diagnostic archetypes. To determine the optimal diagnostic archetypes, clusters of diagnostic products that depicted similar estimates for research and development cost, timelines and probability of success were identified from the historical dataset of 26 diagnostic products (Figure 1). Approximate groupings of products that aligned with three archetypes emerged:

Products are not ascribed to a specific company due to confidentiality agreements. Ag, antigen; AMR, antimicrobial resistance; BC, breast cancer; CAA, circulating anodic antigen; CBC, complete blood count; CMOS, complementary metal-oxide semiconductor; CrAg, Cryptococcal Antigen; HAI, haemagglutination inhibition assay; HCV, hepatitis C virus; HIV, human immunodeficiency virus; HPV, human papillomavirus; hs, high-sensitivity; IA, immunoassay; LAM, lipoarabinomannan; Lat, latent; PC, pancreatic cancer; RA, rheumatoid arthritis; RDT, rapid diagnostic test; ST, self-test; TB, tuberculosis; Tni, troponin I; TSH, thyroid stimulating hormone; VL, viral load.
1. “New or existing entity, discovery” archetype: a research or commercial stage entity in the discovery phase of a new technology
2. “Existing entity, new product/technology” archetype: an established commercial company that is creating a new product that is not a product line extension
3. “Existing entity, product extension” archetype: an established commercial company that is creating a new product as an extension of an existing product line
Diagnostic assumptions. The expert interviewees proposed three development phases for diagnostics: “discovery”, “design and development” and “clinical validation and launch readiness”. These were fitted to the phases in the P2I v.2 model2 by encompassing both “concept and research” and “feasibility and planning” from the original P2I v.2 tool into the “discovery” phase. The remaining two development phases were the same as those in the P2I v.2 tool (“design and development” and “clinical validation and launch readiness”). A fourth phase, “commercialization”, was recommended by the interviewees, as this can be costly for diagnostics. Data for this phase are presented, but it was not included in the comparison analysis with the P2I v.2 tool.
Data from the expert interviews and the historical database of 26 existing diagnostics were used to identify the revised research and development cost, timeline and probability of success assumptions per product phase. Where the database included data ranges, averages were calculated for the purposes of inputting into the P2I model. Data were weighted at 0.67 for “concept and research” and 0.33 for “feasibility and planning”, based on expert experience suggesting that greater time and cost is placed at the concept stage.
Table 7 lists the revised diagnostic assumptions. The average costs per phase were higher in the updated assumptions compared with the original P2I v.2 tool assumptions (“discovery”: US$1.1–24.6 million versus 3.0 million (combined “concept and research” and “feasibility and planning”); “clinical validation and launch readiness”: US$6.9–10.0 million versus 3.5 million), with the exception of the cost of the “design and development” phase, which was significantly lower than the initial assumptions (US$3.3–6.9 million versus US$2.0 to 100.0 million). As it was not possible to calculate specific probability of success scores for each archetype with the available data, an average across all archetypes was used for each phase. The probability of success was significantly lower in the updated diagnostic assumptions compared with the initial assumptions.
| Diagnostic archetypes | Discoverya | Design and development | Clinical validation and launch readiness | TOTALb | Commercialization (up to 3 years) | |
|---|---|---|---|---|---|---|
| Cost per phase (US$ million) | New or existing entity, discovery | 24.6 (2.0–150.0) | 6.9 (2.0–25.0) | 10.0 (2.0–25.0) | 41.5 | 5.6 (0.5–25.0) |
| Existing entity, new product/technology | 8.8 (2.0–25.0) | 5.0 (1.0–10.0) | 7.2 (0.1–25.0) | 21.0 | 4.4 (0.1–10.0) | |
| Existing entity, product extension | 1.1 (0.5–2.0) | 3.3 (1.0–6.5) | 6.9 (1.0–29.0) | 11.3 | 3.8 (0.5–10.0) | |
| Length of phase (years) | New or existing entity, discovery | 4.3 (2.0–12.0) | 2.7 (1.0–10.0) | 2.2 (1.0–5.0) | 9.2 | — |
| Existing entity, new product/technology | 3.8 (1.0–12.0) | 2.3 (0.5–5.0) | 2.4 (0.5–5.0) | 8.5 | — | |
| Existing entity, product extension | 1.5 (0.5–3.0) | 2.3 0.5–5.0) | 2.4 (0.5–5.0) | 6.2 | — | |
| Probability of success (%) | All archetypes | 18c | 80 | 60 | — | 45–95 |
FIND’s current TB and pandemic preparedness portfolios contained a total of 27 diagnostic candidates under development (Table 8). This included three products for Lassa fever, two on multi-disease fever-causing pathogens, one on yellow fever, and 12 products for TB. Using the P2I v.2 model, 12 products were classified as the “simple technical platform development” archetype and 15 were categorized as the “assay development” archetype. All four development phases were covered. Using the revised model, nine products were classified as the “existing entity, new product/technology” archetype; 10 as the “new or existing entity, discovery” archetype; and eight as the “existing entity, product extension” archetype.
Using the P2I v.2 model, the total estimated cost to move the 27 candidates along the pipeline to launch was US$641.62 million, with the majority of costs (77%) incurred by the development of the TB diagnostic candidates, followed by the multi-disease fever candidates (20%) (Figure 2A). Using the revised model, total estimated costs to move the 27 candidates along the pipeline to expected launch were around US$274.00 million, substantially lower than the cost estimate from the initial model. However, the costs of developing the yellow fever and Lassa fever diagnostics were higher compared with the initial model due to increased costs during early development (Figure 2B).

Cost by disease area using A) P2I v.2 model and B) revised model.
The total expected number of launches across all 27 candidates using the P2I v.2 model was 21.65, with the majority of launches for the TB candidates (17.82), followed by the Lassa fever candidates (2.42) (Figure 3A). Using the revised model, the total launch probability for all 27 candidates was reduced to 11.48 (Figure 3B), a little over 50% lower than the P2I v.2 model projected probability, most likely due to the lower probability of success rates.
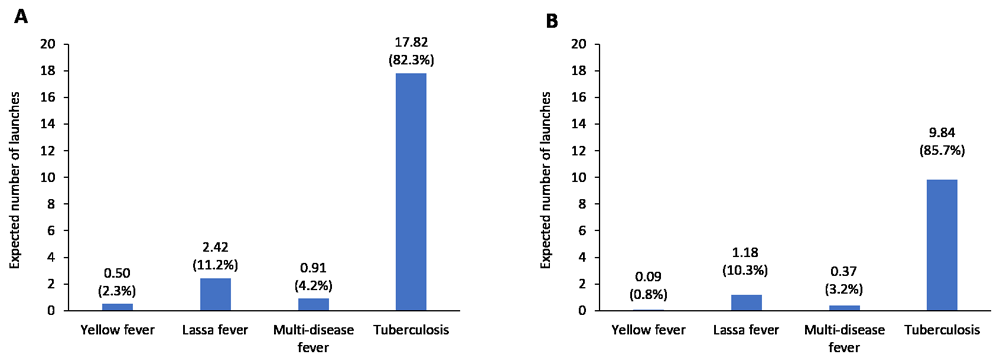
Number of launches by disease area using A) P2I v.2 model and B) revised model.
The P2I v.2 model predicted that the majority of costs would fall in the first three years of development; development time for all diagnostic candidates was predicted to be completed by 2024 (Figures 4A and 4B). Using the revised model, development timelines were extended, with development time for all diagnostic candidates predicted to be completed by 2028 (Figures 4C and 4D).
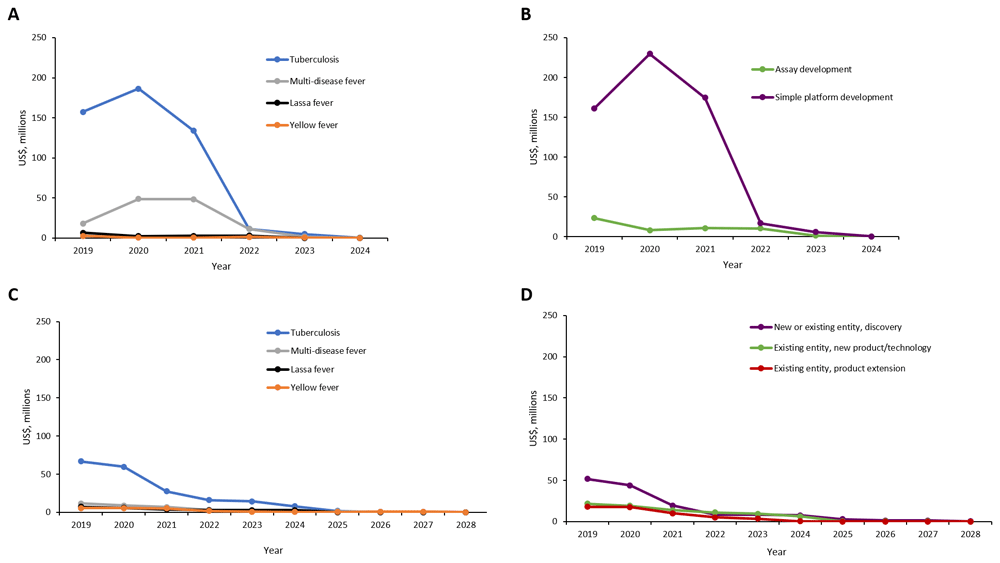
Total portfolio cost per year (A and B: P2I v.2; C and D: revised model).
Level of risk scores versus potential impact scores for each product are shown in Figure 5. A number of products had the same level of risk score but substantially different potential impact scores.
Products are not ascribed to a specific company due to confidentiality agreements. Ag, antigen; AMR, antimicrobial resistance; BC, breast cancer; CAA, circulating anodic antigen; CBC, complete blood count; CMOS, complementary metal-oxide semiconductor; CrAg, Cryptococcal Antigen; HAI, haemagglutination inhibition assay; HCV, hepatitis C virus; HIV, human immunodeficiency virus; HPV, human papillomavirus; hs, high-sensitivity; IA, immunoassay; LAM, lipoarabinomannan; Lat, latent; PC, pancreatic cancer; RA, rheumatoid arthritis; RDT, rapid diagnostic test; ST, self-test; TB, tuberculosis; Tni, troponin I; TSH, thyroid stimulating hormone; VL, viral load.
The P2I v.2 tool predicted that we would require US$642 million to move the 27 products from the FIND TB and pandemic preparedness portfolios forward through the pipeline, with a launch probability of 21.65 launches over five years. Using our revised P2I model with updated diagnostic archetypes and assumptions, costs were reduced to US$274 million, with a launch probability of 11.48 launches over eight years. While the diagnostic archetypes and assumptions in P2I v.2 were solely based on interview feedback, our revised archetypes and assumptions were partially based on an analysis of the development history for 26 existing diagnostics, thus our revised tool incorporated actual data as well as expert feedback. The revised outputs are more in line with FIND’s experience compared with the outputs of the P2I v.2 model, especially for early stage products. The considerable differences between the outputs of the two models suggest that the current P2I v.2 tool may not accurately capture the research and development costs, timelines, and probability of success for diagnostics.
We found that the previous P2I diagnostic archetypes, “assay development” and “simple technical platform development”, were too confining given the breadth of assay and platform technologies used for the 26 products we analysed from the historical database. For example, some products were being developed on existing platforms and others on new platforms, but both would have been categorized under the “assay development” archetype even though the costs and development times differed significantly. While some products that improve upon current technologies with simple modifications, such as readers for lateral flow assays, fit the “simple technical platform” archetype, others were new systems with novel disposables, chemistry and instruments, which were too complex in terms of the technology used to fit under this heading. However, while the updated diagnostic archetypes may better capture the complexity of diagnostics product development, they do not necessarily represent the optimal and complete view of the reality. We recommend continued collection of additional data in order to identify more precisely the archetypes and factors that have the most impact on the assumptions examined, and allow more effective prioritization of investment in diagnostic companies and products.
The reduction in cost using the revised model compared with the P2I v.2 tool is most likely due to the reduced cost for clinical validation in the updated assumptions, as well as the lower probability of success rates compared with the original assumptions. Notably, the lower probability of success assumptions are in line with previous work on this subject7. As expected, our analysis and the feedback from the expert interviewees showed that developing newer products tends to require more investment and development time compared with menu expansion and product extension. This reflects FIND’s experience in diagnostic development for LMIC settings. In addition, there is a significant development burden in the discovery stage, particularly under the “concept and research” phase, as successful products must not only be technically sound, but must reflect their intended use.
Evaluating the public health impact of a product in addition to the probability of success is valuable, as products with a high public health impact but low probability of success may still be worth investing in; although riskier than products with higher success probability, they are likely to improve the health of a greater number of people if successful. We assessed the potential impact of a new diagnostic product at the same time as assessing its level of risk, as a way to prioritize investment in diagnostic products or technologies that, on the surface, display similar cost requirements. We believe that it is important to incorporate this notion into decision-making when estimating funding needs to move candidate health products through the pipeline. Understanding the potential impact of a product can inform decisions on whether to fund or include a high-risk product in a portfolio, as well as supporting advocacy and fundraising efforts.
The interviewees recommended the addition of average research and development costs, timelines and probability of success of commercialization to the model, by inserting a new development phase. Once a product has launched, understanding the costs associated with access and sustainability, especially in LMIC markets, is important, as the probability of success of a new diagnostic test depends not only on the development of the product itself but also on the way it is delivered to the target patient populations. Even when they are available, diagnostic tests are not necessarily affordable, appropriate for use in LMICs, and/or adopted in these settings. To maximize the access to a diagnostic product, a sizeable level of human and financial resources needs to be invested in marketing, sales, manufacturing, distribution and in-country registration, which can lead to higher costs. For more accurate estimates of overall funding needs for diagnostics, future iterations of the tool could incorporate the commercialization phase.
In addition to the limitations of the P2I model already described1,2, there are some further limitations specific to our revised model that should be noted. First, the research and development costs and timelines for product development phase used in the revised P2I model correspond to averages of the historical data collected, as we were only able to obtain ranges of data rather than unique data points, from which averages were calculated to allow for inclusion into the tool. The averages may not effectively capture the large differences that were observed between products within the same archetype, which stem from a complex and multifaceted environment of the diagnostics industry. Secondly, like the developers of the original P2I tool, we faced challenges in data collection for diagnostic development, as the information needed was either not publicly available or not systematically recorded. For FIND and other PDPs with interest in diagnostics, we recommend improving organizational processes and systems for tracking, storing and sharing this type of information and/or dedicating human resources, such as a Portfolio Manager, to this task. Similarly, the number of diagnostic products used to generate new archetypes and development assumptions was limited, thus more data are required to further validate the proposed archetypes and assumptions.
In summary, we believe that our proposed revisions to the archetypes and assumptions for diagnostic products of the P2I model improve the accuracy of the tool for estimating costs and timelines relating to diagnostic portfolios. During the preparation of this article, a corrected version of the P2I v.2. was published8. We hope the data and recommendations presented here are considered for inclusion in a future iteration of this tool, particularly with regards to the inclusion of commercialization and public health impact, which may be applicable to other health products.
All data underlying the results are available as part of the article and no additional source data are required. Feedback from expert interviews is not provided due to data protection/confidentiality considerations. The diagnostic products used to inform revised assumptions are not ascribed to a specific company due to confidentiality agreements.
| Views | Downloads | |
|---|---|---|
| F1000Research | - | - |
|
PubMed Central
Data from PMC are received and updated monthly.
|
- | - |
Provide sufficient details of any financial or non-financial competing interests to enable users to assess whether your comments might lead a reasonable person to question your impartiality. Consider the following examples, but note that this is not an exhaustive list:
Sign up for content alerts and receive a weekly or monthly email with all newly published articles
Already registered? Sign in
The email address should be the one you originally registered with F1000.
You registered with F1000 via Google, so we cannot reset your password.
To sign in, please click here.
If you still need help with your Google account password, please click here.
You registered with F1000 via Facebook, so we cannot reset your password.
To sign in, please click here.
If you still need help with your Facebook account password, please click here.
If your email address is registered with us, we will email you instructions to reset your password.
If you think you should have received this email but it has not arrived, please check your spam filters and/or contact for further assistance.
Comments on this article Comments (0)