Keywords
brain tumor, convection-enhanced delivery, optimization
brain tumor, convection-enhanced delivery, optimization
Surgery, radiation therapy, and chemotherapy are the standard of care for brain tumors1. Surgery or tumor resection removes all or part of the tumor; however, this method is invasive and risky. Radiation therapy seeks to remove the tumor using high-energy x-rays, while chemotherapy attacks the tumor using drugs taken either orally or intravenously. Radiation therapy and chemotherapy may cause side effects, which may include hair loss and decreased mental functionality1.
Although therapy delivery methods, such as Ommaya reservoirs and convection-enhanced delivery (CED), are not standards of care, these methods are available in clinical trials, appear to be less invasive, and could offer effective treatment2–5. Ommaya reservoirs use a catheter-reservoir system implanted under the scalp for therapy delivery, while CED uses a catheter-syringe-pump system for therapy delivery. In this study, researchers used a response surface optimization (RSO) technique for the selection of the ideal catheter placement locations, which may improve the effectiveness of CED.
In general, optimization techniques improve speed and accuracy during the search for the ideal solution for a given problem. Study groups used an array of these techniques to address the challenges associated with brain tumor treatments6–10. Li et al. developed an optimization method using a genetic algorithm to determine catheter positions that would yield optimal therapy concentrations in the tumor and white matter, while limiting concentrations in the cortex6. The study demonstrated that a genetic algorithm can determine optimal catheter positions and suggests that it may be sufficient to determine the optimal locations for our study. Vidotto et al. used a neural network based algorithm to improve the accuracy and speed of axon diameter distribution within the brain7.
Zhang et al. used RSO to determine the optimal extrusion die design, which resulted in a more accurate extrudate shape and lower extrusion die production costs11. Using a response surface methodology Sultana et al. predicted that jute fiber can improve compressive and tensile concrete strength12. This group validated the predicted results against experimental results and concluded that the variation was only approximately 5%. Akhbar et al. used RSO to optimize rotational speed and feed to prevent heat damage during bone-drilling surgical procedures13. Albe et al. examined the effect of pH and salt concentration on the extraction of sunflower protein using the response surface to maximize the protein14. Silva et al. used RSO to achieve a mean recovery of 91% and overall precision of 5% when verified using fortified samples of pharmaceutical residues15. Each of these groups used RSO and improved the accuracy of their respective designs, which suggests that this technique will optimize the infusion locations in our study within 5% precision.
In this study RSO allowed an efficient determination of the optimal location for therapy distribution and includes design of experiments (DOE), response surface, and optimization. DOE uses input and output parameters as the major components and analyzes the input-output relationship generating design points that lie within boundaries in proximity of the baseline point. The response surface results from an algorithm that does not simulate a complete solution, but instead performs a quick analysis of the DOE sampling percentages using cross-validation to predict surface percentages. The fitness function associates DOE percentages to surface percentages, where alignment of the percentages on a diagonal line suggests that the response surface fits the DOE percentages. Using results from DOE and response surface, optimization determines the ideal locations for the maximum therapy distribution.
To conduct response surface optimization, the researchers derived the tumor geometry with x, y, z lengths of 12.86 mm, 30.4 mm, and 37.43 mm, respectively, and volume of 5031.35 mm3 from patient specific T1-weighted images (T1W)16. The anonymized T1W (approved for use by the University of Alabama Institutional Review Board as not human-subjects research) includes 135 dicom files for one subject were obtained from The University of Alabama at Birmingham Department of Radiology. Diffusion tensors inside the tumor resulted from the diffusion-weighted images (DWI) of the patient using the DSI Studio 2019_10 version17. Viscous resistance of the tumor is the transformation of the diffusion tensor as discussed by the Støverud group18. Because the tensors may not align to the center of the computational elements, it was necessary to interpolate these values using trilinear interpolation.
We expect the suspension of the oncolytic herpes simplex virus to be uniform in a fluid and use a transport equation to model fluid flow inside the tumor19. Velocity components in the transport equation are a function of the therapy infusion rate and thereby, calculated by solving the Navier-Stokes equation19 with an assumption of laminar flow inside the tumor. The virus density and viscosity information were unavailable. Therefore, we analyzed the flow using density and viscosity values for water of 1×10⁻⁶ kg/mm3 and 1.003×10⁻⁶ kg/mm-s, and a porosity value of 0.6 and pressure of 266.65 Pa from previous studies20,21.
The researchers selected six input parameters, which included x, y, and z coordinates along the tumor boundaries and fixed values for flow rate (0.1 mL/hr), minimum dose (1×10-19 mL/mm3), and radius (1.5 mm). The radius of 1.5 mm ensures that the infusion location is larger than the catheter radius (0.5 mm). After the selection and analysis of 16 locations (x, y, z coordinates) within the tumor, four baseline locations were available for the response surface optimization. The baselines represent the locations that produced the highest therapy distribution percentages in the tumor.
DOE generated 28 sampling points using the input parameters of the baseline point as the reference point. Default lower and upper bounds for the coordinates reflect the baseline point as the midpoint. ANSYS (free student version download available) calculated therapy percentages for sampling points using default parameters – flow rate, infusion location radius, and minimum dose19. Based on the DOE, the response surface determines minimum and maximum percentages. The goodness of fit compared the predicted response surface to the observed surface for the design points and determined the surface quality and discrepancies between observed and predicted percentages.
Nonlinear Programming by Quadratic Lagrangian (NLPQL)19 provided a local optimization solution, which maximizes the therapy distribution percentages. Baseline point specification was necessary to define the exploration region and identify three candidate points per region. Number of evaluations varied by region and included several iterations. Tolerance for checking convergence was 0.0001.
Volume distribution percentages from region one design points ranged from 3.01 % to 9.02%, region two ranged from 4.19% to 9.09%, region three ranged from 2.51% to 8.12%, and region four ranged from 3.17% to 8.18%.
Response surfaces in region one suggest that maximum therapy distribution percentage is approximately 9% (Figure 1). Location combinations of y and z (Figure 1c) appear to produce a larger region with percentages that are greater than 8% as opposed to combinations of locations x and y (Figure 1a) and locations x and z (Figure 1b). Maximum therapy distribution for region one occurred at location -13.28 mm, 23.80 mm, 39.77 mm and was approximately 9.02%.
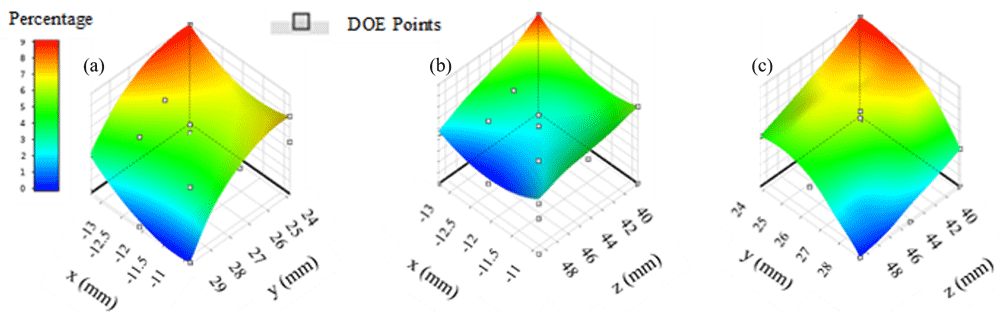
(a) x axis represents input parameters along the x direction, y axis represents input parameters along the y direction; (b) z axis represents input parameters along the z direction; (c) y and z input combinations appear to include the highest number of locations with therapy distribution percentages greater than 8%.
Response surfaces in region two suggest that the therapy distribution percentage is approximately 9% (Figure 2). Location combinations of y and z (Figure 2c) appear to produce a larger region with percentages that are greater than 8% when compared to combinations of locations x and y (Figure 2a) and x and z (Figure 2b). Maximum therapy distribution for region two occurred at location -11.04 mm, 15.17 mm, 26.68 mm and was approximately 9.09%.
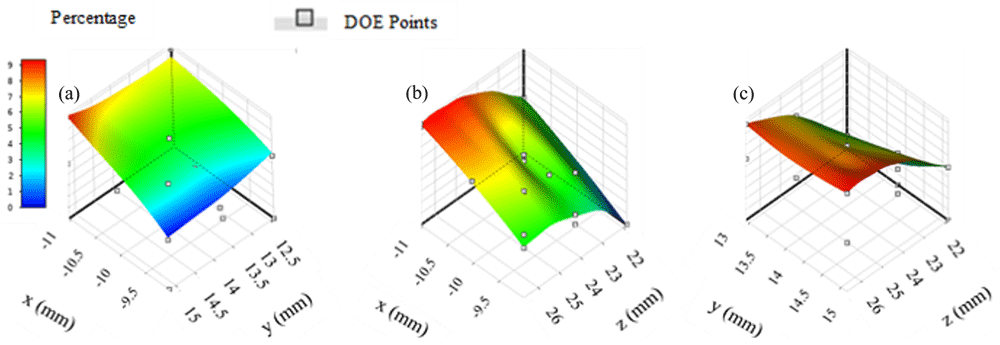
(a) x axis represents input parameters along the x direction, y axis represents input parameters along the y direction; (b) z axis represents input parameters along the z direction; (c) y and z input combinations appear to include the highest number of locations with therapy distribution percentages greater than 8%.
Response surfaces in region three suggest that maximum therapy distribution percentage is approximately 8% (Figure 3). Location combinations of y and z (Figure 3c) appear to produce a larger region with percentages that are greater than 7% as opposed to combinations of locations x and y (Figure 3a) and locations x and z (Figure 3b). Maximum therapy distribution for region three occurred at location -9.17 mm, 6.81 mm, 31.20 mm and was approximately 8.12%.
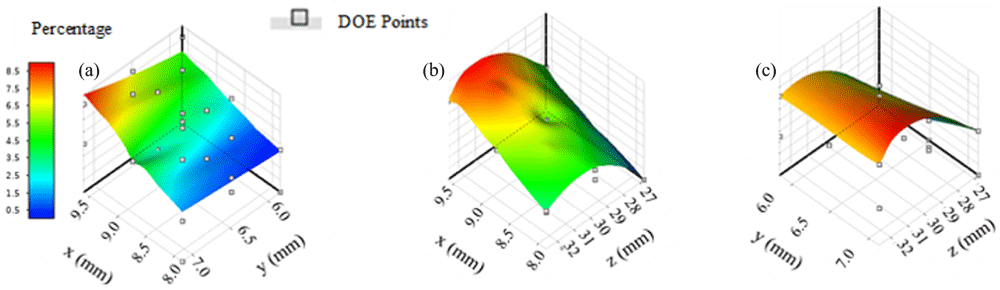
(a) x axis represents input parameters along the x direction, y axis represents input parameters along the y direction; (b) z axis represents input parameters along the z direction; (c) y and z input combinations appear to include the highest number of locations with therapy distribution percentages greater than 7%.
Response surfaces in region four suggest that maximum therapy distribution percentage is approximately 8% (Figure 4). Location combinations of x and z (Figure 4b) appear to produce a larger region with percentages that are greater than 7% as opposed to x and y (Figure 4a) or y and z (Figure 4c). Maximum therapy distribution for region four occurred at location -12.89 mm, 17.93 mm, 48.80 mm and was approximately 8.27%.
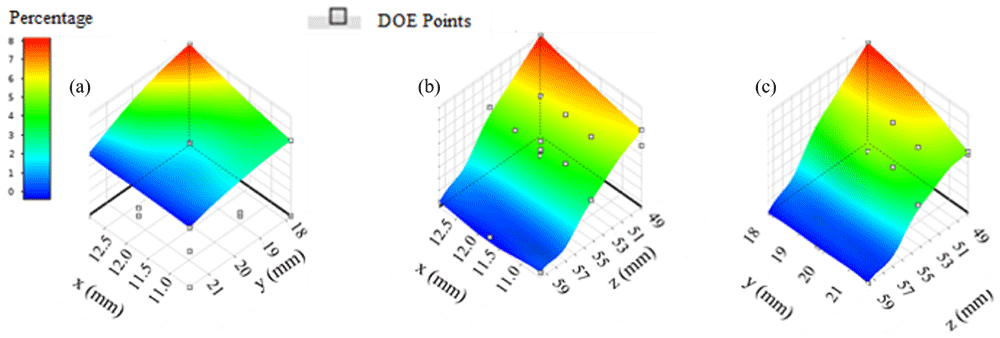
(a) x axis represents input parameters along the x direction, y axis represents input parameters along the y direction; (b) z axis represents input parameters along the z direction, x and z input combinations appear to include the highest number of locations with therapy distribution percentages greater than 7%; (c) y and z input combinations appear to include high numbers of locations with percentages greater than 7%.
During optimization the goal was to maximize the volume distribution percentage to a value greater than or equal to 8% based upon the observed percentages from the design points. The number of evaluations varied among the regions with region one and two requiring 22 and 47 evaluations, respectively. Regions three and four required 39 and 59 evaluations, respectively.
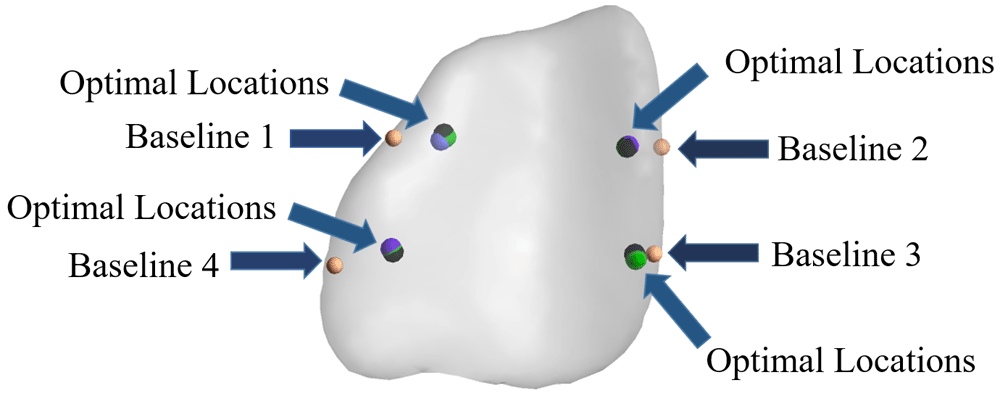
Optimization resulted in twelve optimal locations – three locations for each region. Maximum therapy distribution percentages throughout the regions ranged from 8.12% to 9.09% (Table 1). The location of the largest therapy distribution of 9.02% in region one was -13.28 mm, 23.80 mm, 39.77 mm, while the location in region two with a distribution of 9.09% was -11.04 mm, 15.17 mm, 26.68 mm. In regions three and four the largest distributions were 8.12% at location -9.17 mm, 6.81 mm, 31.20 mm and 8.27% at -12.89 mm, 17.94 mm, 48.80 mm, respectively. Optimal locations clustered together (Figure 5) and clustered closely to the baseline locations for region three.
More than 25 years ago Bobo et al. introduced CED to deliver therapy to treat brain tumors; however, CED currently remains in clinical trials and appears to be mostly tested for safety and toxicity22,23. Shi et al. reviewed CED clinical treatment methods from 1997 through 2018 and found that irrespective of therapeutic agents, survival rates during phase III clinical trials did not improve24. Median survival times for the Carpenter et al., Weaver et al., Sampson et al., Hau et al., and Desjardins et al. trials were 7, 5.2, 7.5, 11, and 12.5 months, respectively25–29. These survival times may correlate to the difficulty in reaching all tumor cells and in evaluating the movement of therapy within the tumor30. Shi et al. suggested that catheter placement and corresponding therapy distribution may be the missing link.
In an effort to promote CED to standard of care, the current study aimed to quantitatively identify the optimal catheter locations for therapy delivery to brain tumors. The optimization technique requires one baseline location from each region with the highest therapy distribution. This group randomly selected 16 locations to determine the four baselines.
Response surfaces revealed 2D regions that show maximum therapy distribution. Both the predicted percentages from the response surface and observed percentages from the design of experiments aligned closely, which suggest that the response surface fits the design points. NLPQL approximated derivatives using the central differences scheme to refine the results and produce three locations per region with the maximum therapy percentages.
The mean percentage of the locations was 8.82% for region one with location -13.28 mm, 23.80 mm, 39.77 mm, yielding the highest percentage at 9.02%, while the baseline location (-12.07 mm, 26.45 mm, 44.19 mm) yielded therapy distribution of 6.26%, which varies from the mean distribution percentage by 29.05%. The mean Euclidean distance between the baseline and the three locations is 2.05 mm.
The mean percentage was 9.05% for region two with location -11.04 mm, 15.17 mm, 26.68 mm yielding the highest percentage at 9.09%, which contrasts with the baseline location (-10.03 mm, 13.79 mm, 24.25 mm) and its yield of 6.32%. Although the Euclidean distance between the two locations is 2.97 mm, the baseline provides 30.47% less therapy distribution than this location, which results from the optimization.
Location (-9.17 mm, 6.81 mm, 31.20 mm) for region three returned a distribution percentage of 8.12%, which varies by 34.73% from the baseline location (-8.73 mm, 6.48 mm, 29.71 mm) at 5.30%. The Euclidean distance between the locations is 1.59 mm. Location (-12.89 mm, 17.94 mm, 48.80 mm) for region four produced an optimal therapy distribution percentage of 8.27%, while the baseline location (-11.72 mm, 19.76 mm, 54.22 mm) returned therapy distribution of 4.47%, which varies by 45.95% from this location. Euclidean distance between the two locations is 5.84 mm.
In summary, CED as a brain tumor treatment method shows promise, but the treatment still remains in clinical trials despite being available for more than 20 years. The missing link for advancement to standard of care for CED may be the selection of catheter placement that yields the highest distribution percentage.
We developed an optimization method to determine the optimal catheter placement based on diffusion, viscous resistance, porosity, fluid pressure, and tumor geometry. Our results suggest that catheter placement does influence volume distribution percentages and that this optimization method improved distribution from 27.80% to 45.95%. The selection of the highest percentages per region may provide optimal therapy for the tumor.
In the future, investigators can verify this optimization method using patient-specific T1W and DWI data and therapy-specific density and viscosity information. Experimental validation using animal models is a critical step in determining the effectiveness of this quantitative tool31–39.
Harvard Dataverse: Catheter placement selection for convection-enhanced delivery of therapeutic agents to brain tumors. https://doi.org/10.7910/DVN/H7C6A216.
Data are available under the terms of the Creative Commons Zero “No rights reserved” data waiver (CC0 1.0 Public domain dedication).
| Views | Downloads | |
|---|---|---|
| F1000Research | - | - |
|
PubMed Central
Data from PMC are received and updated monthly.
|
- | - |
Provide sufficient details of any financial or non-financial competing interests to enable users to assess whether your comments might lead a reasonable person to question your impartiality. Consider the following examples, but note that this is not an exhaustive list:
Sign up for content alerts and receive a weekly or monthly email with all newly published articles
Already registered? Sign in
The email address should be the one you originally registered with F1000.
You registered with F1000 via Google, so we cannot reset your password.
To sign in, please click here.
If you still need help with your Google account password, please click here.
You registered with F1000 via Facebook, so we cannot reset your password.
To sign in, please click here.
If you still need help with your Facebook account password, please click here.
If your email address is registered with us, we will email you instructions to reset your password.
If you think you should have received this email but it has not arrived, please check your spam filters and/or contact for further assistance.
Comments on this article Comments (0)