Keywords
chromatin profiling, snakemake, ChIP-seq, ATAC-seq
chromatin profiling, snakemake, ChIP-seq, ATAC-seq
Protein-DNA binding interactions are fundamental to gene regulation and are involved in regulating disease processes. However, the methods of investigating these interactions through ATAC-seq, ChIP-seq, and DNase-seq experiments generate data that require extensive processing before biological interpretation (Furey 2012). Chromatin profiling using sequencing technology can also generate bias (Meyer and Liu 2014), which needs to be mitigated before interpreting the biological significance. Therefore, consistent and reproducible processing of the chromatin profiling data is essential in deriving meaningful information from the experimental data. Moreover, experiments can fail due to technical complexities. Comprehensive quality control will help to identify failed samples, and robust processing can facilitate reproducible analysis.
There are other pipelines available for processing ChIP-seq data. For example, ENCODE has its own pipeline written in Workflow Description Language (WDL) (The ENCODE Project Consortium 2012). Recently, Snakemake (Köster and Rahmann 2012) workflow language becomes popular in the bioinformatics field partly because it is python-based. Using Snakemake v5.4.5 we developed CHromatin enrIchment ProcesSor (CHIPS) to standardize processing and quality control evaluation for ATAC-seq, ChIP-seq, and DNase-seq data following best practice (Bailey et al. 2013). Furthermore, CHIPS generates a comprehensive interactive HTML report using Plotly for the users to easily inspect the quality of the samples. Encapsulated in a Conda environment, it can be executed in the local computing cluster engine or in the cloud computing settings such as Amazon AWS and Google Cloud. CHIPS has been used to analyze >1500 samples since 2016 within Dana-Farber Cancer Institute, and now serves as the standard processing pipeline for tumor ATAC-seq data from the Cancer immune Monitoring and Analysis Centers and Cancer Immunologic Data Commons (CIMAC-CIDC) trials (H. X. Chen et al. 2021).
Alignment and basic quality control
The workflow of CHIPS is described in Figure 1. CHIPS takes FASTQ or BAM files as input and supports both single-end and paired-end data. To save time and resources, CHIPS subsamples 100,000 reads and uses them in the FASTQC module for basic quality control analysis. For aligning reads to the reference genome, FASTQ files are trimmed to remove adaptors and low-quality sequences using fastp (S. Chen et al. 2018) and then aligned by BWA-MEM (Li 2013) to generate sorted and deduplicated BAM files. After alignment, the mapping statistics, including the number of mapped and uniquely mapped reads, are then reported.
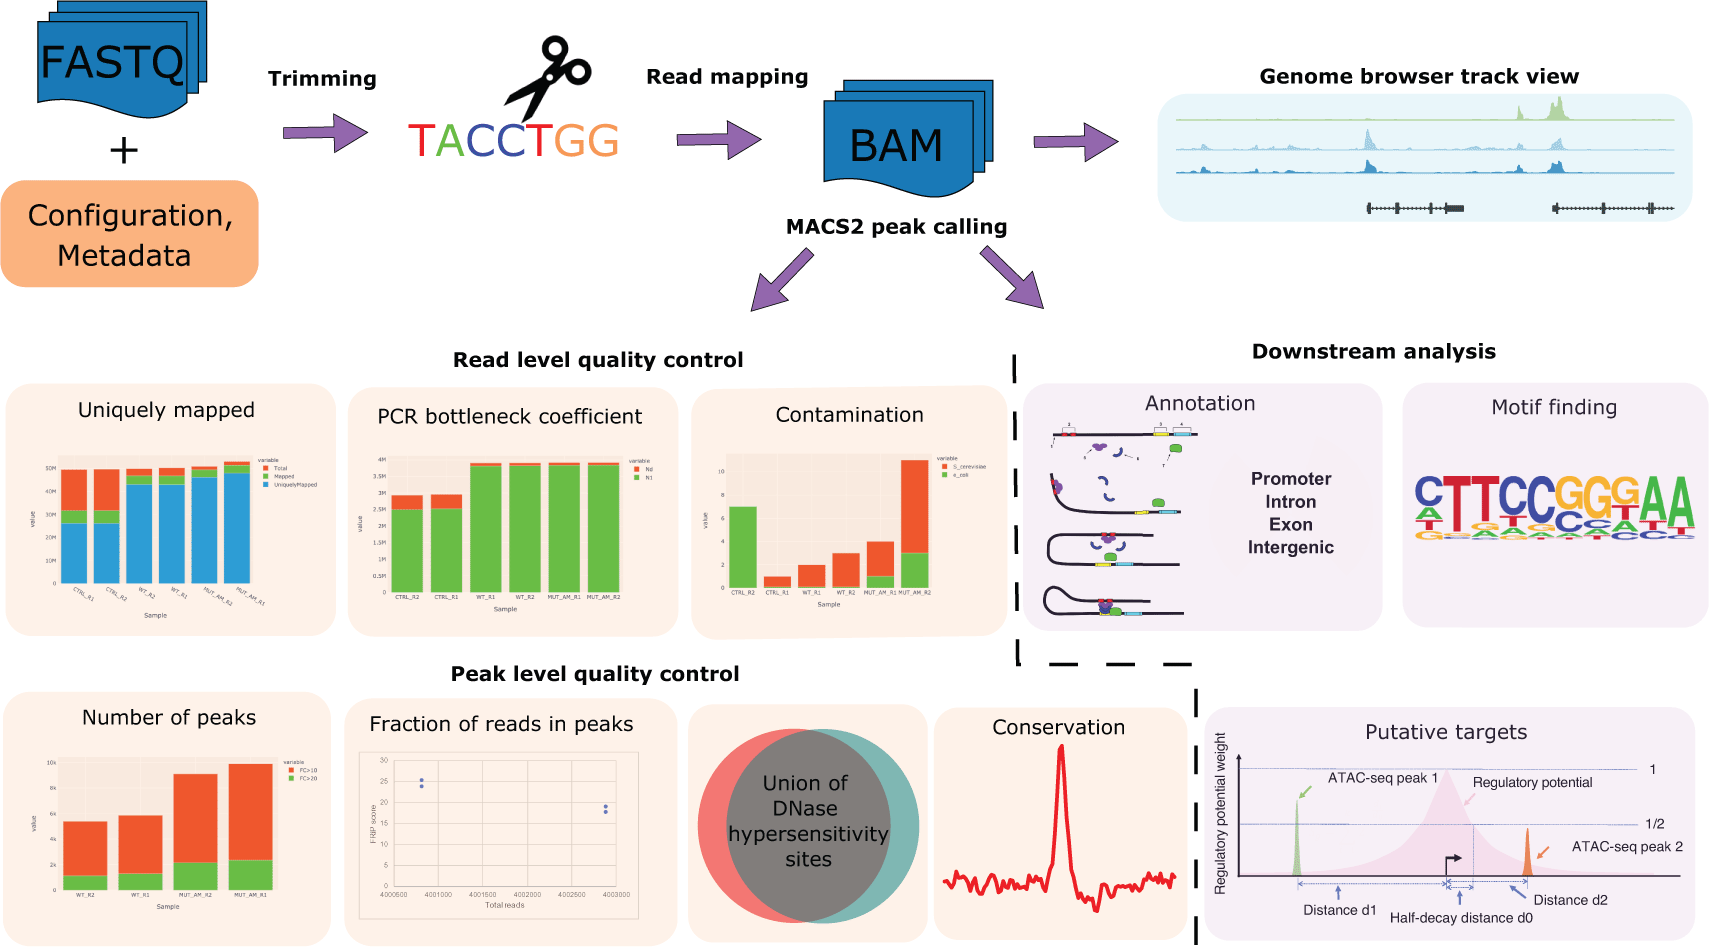
The CHIPS pipeline is designed to perform robust quality control and reproducible processing of chromatin profiling data derived from ChIP-seq, ATAC-seq, and DNase-seq. The CHIPS pipeline includes basic steps of read trimming, read alignment, and peak calling. For quality control, it calculates metrics such as contamination profile, mapping statistics, the fraction of reads in peaks (FRIP) score, PCR bottleneck coefficient (PBC), overlap with union DNaseI hypersensitive sites (DHS), and peak evolutionary conservation. For downstream analysis, CHIPS carries out peak annotation, motif finding, and putative target prediction. The inputs to the pipeline are FASTQ/BAM format DNA sequence read files.
CHIPS carries out other basic quality control. The contamination profile reports the percentage of 100,000 reads that map to a contamination panel’s reference genomes. The contamination panel, specified by the user in a configuration file, includes dm3, Saccharomyces cerevisiae, E. coli, and mycoplasma of different types in addition to hg38, hg19, mm10, and mm9 genomes. We provide static reference files along with the installation of CHIPS. Users may add new assemblies to the contamination panel by adding the BWA index files. In addition, 4,000,000 reads are downsampled for calculating the PCR bottleneck coefficient (PBC). The PBC is the number of locations with exactly one uniquely mapped read divided by the number of uniquely mapped genomic locations. PBC ranges from 0-1, and a higher number indicates higher library complexity.
Particularly useful in the setting of ATAC-seq experiments, CHIPS also provides a fragment lengths distribution plot. ATAC-seq data with high quality should have fragment length peaks at < 100 bp nucleosome-free regions and show periodical enrichment at the 1- and 2-nucleosome lengths.
Peak calling and peak characteristics for quality control
Peaks represent regions of the genome that are enriched with aligned reads. The MACS2 (Zhang et al. 2008) algorithm is used to call peaks from uniquely sorted BAM files. The minimum false discovery rate (FDR) cutoff for defining peak confidence is set to 0.01 by default but can be changed in the config.yaml file. A summary of the number of peaks, including those with a > 10 or > 20-fold increase relative to the background, is also reported describing the data quality. More peaks and a higher fraction of >10X peaks tend to indicate higher quality. Moreover, a read per million (RPM) normalized BedGraph signal track file generated by MACS2 is further converted to a BigWig file for visualization in the genome browsers more efficiently. A qualitative assessment of peak quality can be determined by static genome browser track views in the CHIPS output.
After peak calling, the fraction of reads in peaks (FRIP) scores is calculated to assess the samples’ quality. The FRIP score is the fraction of 4,000,000 subsampled reads that fall within the peak regions. FRIP score increases with sequencing depth, so a subsample of reads is used. The FRIP score indicates data’s signal-to-noise ratio, and a higher FRIP score indicates higher quality.
Certain characteristics of the peaks can be used to describe further the quality of the data. Peaks from a high-quality sample should have a high percentage of overlap with the known DNaseI sites. CHIPS overlaps the peaks with the union of the public DNaseI hypersensitive sites to determine the data’s quality. Moreover, high-quality peaks tend to be evolutionarily conserved across species. CHIPS plots the conservation plot across all peaks. The conservation plots of transcription factors typically show a high focal point around the peak summits, while histone modifications show bimodal peaks with a dip in the center.
Downstream analysis
Peak annotation is performed to describe how the peaks distribute across the genome. Specifically, CHIPS determines the proportions of peaks that overlap with promoters, exons, introns, or intergenic regions. Motif identification is carried out using HOMER v4.11 (Heinz et al. 2010). The top 5,000 most significant peak summits (ranked by the MACS P-value) are used for motif analysis. Finally, to determine which genes may be regulated by the peaks, a regulatory potential score is calculated for each gene using an exponential decay model implemented in LISA (Qin et al. 2020). LISA calculates regulatory potential scores that represent the cumulative influence of nearby peaks associated with each gene.
Output
CHIPS provides results files in.txt and.png forms inside well-structured folders and a dynamic HTML report summarizing quality control metrics at the sample level. An example report for the Cancer Genome Atlas Lung Adenocarcinoma (TCGA-LUAD) ATAC-seq data is available at here.
CHIPS (Tang, 2021) can be executed in any Linux-based operating system. All the tools can be installed through Conda. Documentation accompanying the CHIPS software describes the installation process and the structure of the analysis results and report directories. Due to the modular nature of the Snakemake workflow, the report can be customized to meet individual needs and easily expanded if new metrics are added. Furthermore, the same metrics are reported in the CistromeDB (Zheng et al. 2019) which facilitates comparisons of results with that resource.
There are three steps to run CHIPS. Step1: Install CHIPS Conda environment and download reference files. Step2: Set up CHIPS project folder. Step3: Run the Snakemake pipeline. All work is done within a single project folder. Four core components are required within the project directory: CHIPS/, config.yaml, metasheet.csv, and ref_files/. Each core component is indispensable to run CHIPS, and their relative paths are restricted. Optionally, we recommend soft linking the data folder to the project directory. If the analysis uses data from species other than human or mouse, a ref.yaml file must also be attached to indicate where the references are. In the following examples, we will use human TCGA and ENCODE ATAC-seq data to illustrate how to run the CHIPS in detail.
In this use case, we will demonstrate how to set up and run a CHIPS pipeline using 22 TCGA ATAC-seq datasets with bam files as input. Data are available in Genomic Data Commons Data Portal (see Underlying data). A recommended way to download the data is to use the manifest file.
Step 0. Download data

     ```bash
     cd ~
     mkdir tcga_ATAC_Seq_LUAD/
     cd tcga_ATAC_Seq_LUAD/
     gdc-client download -m gdc_manifest.txt
     ```

Step 1. Install CHIPS and download reference genome

     ```bash
     cd ~
     git clone https://github.com/liulab-dfci/CHIPS
     cd CHIPS

     conda env create -f environment.yml -n chips
     conda activate chips
     perl ~/miniconda3/envs/chips/share/homer/.//configureHomer.pl -install
     perl ~/miniconda3/envs/chips/share/homer/.//configureHomer.pl -install hg38

     cd ~
     wget http://cistrome.org/~galib/ref_files.tar.gz
     tar –xvzf ref_files.tar.gz ref_files
     ```

Step 2. Setting up the project folder

     ```bash
     mkdir TCGA_atacseq/
     cd TCGA_atacseq/

     ln -s ../CHIPS

     cp CHIPS/config.yaml.
     cp CHIPS/metasheet.csv.

     ln -s ../ref_files
     ln -s ../tcga_ATAC_Seq_LUAD data
     ```
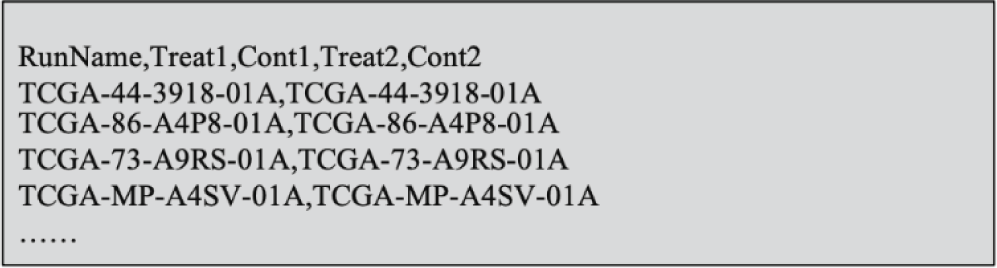
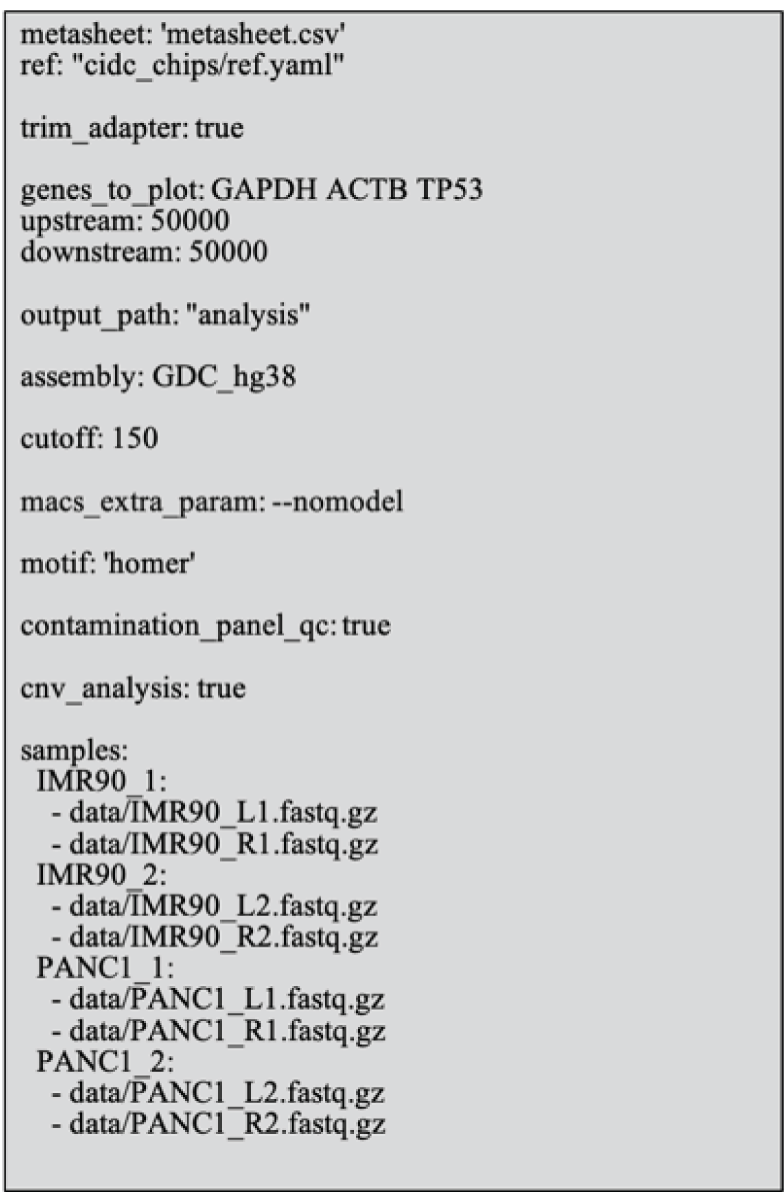
Here, we modify config.yaml and metasheet.csv according to the samples. The config.yaml is where CHIPS run parameters are defined. Each parameter is listed in Figure 2. Unused parameters are not shown. The metasheet.csv is where the samples are grouped to each run. Detailed settings can be found in Figure 3.

Step 3. Running the CHIPS Snakemake pipeline

     ```bash
     snakemake -np -s CHIPS/chips.snakefile --rerun-incomplete
     nohup snakemake -s CHIPS/chips.snakefile --rerun-incomplete -j 16 > run.out &
     ```
When an entire run is completed, an analysis folder with all the output and report will be generated within the project directory.
In use case 2, we will process ENCODE ATAC-seq samples with two replicates of each. We will use paired-end fastq.gz files as input to demonstrate the workflow. The steps in running ENCODE data are the same as running the TCGA data. The main difference is that we need to group the replicates in config.yaml and metasheet.csv. One only needs to install and configure CHIPS once on a computer. Thus, in the second example, we will only use the soft link to set up the project directory. This is also the best practice to follow when using CHIPS multiple times for different data sets.
Step 0. Download data
The two ENCODE datasets used in this example are ENCSR591PIX (ATAC-seq of Panc1) and ENCSR200OML (ATAC-seq of IMR-90) which are available in Underlying data. Four pairs of fastq.gz files are downloaded, renamed, and saved in the ENCODE_data/folder within your home directory with the following format:
Step 0.

     ```bash
     ls ~/ENCODE_data
     - IMR90_L1.fastq.gz
     - IMR90_L2.fastq.gz
     - IMR90_R1.fastq.gz
     - IMR90_R2.fastq.gz
     - PANC1_L1.fastq.gz
     - PANC1_L2.fastq.gz
     - PANC1_R1.fastq.gz
     - PANC1_R2.fastq.gz
     ```

Step 1. Set up CHIPS project folder

     ```bash
     cd ~
     mkdir ENCODE_ATAC
     cd ENCODE_ATAC
     ln -s ../CHIPS/
     cp CHIPS/config.yaml.
     cp CHIPS/metasheet.csv.

     ln -s ../ref_files
     ln -s ../ENCODE_data data
     ```
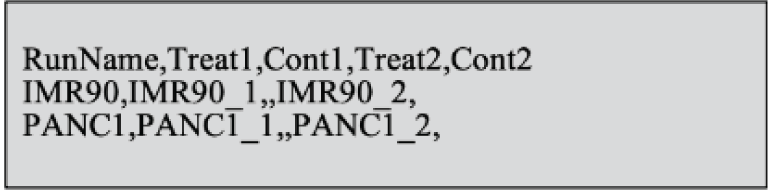
Then, we edit config,yaml to give each pair of fastq.gz files a sample name (Figure 4). In metasheet.csv file, we group replicates within the same run and leave control group empty (Figure 5).
Step 2. Run CHIPS Snakemake pipeline

     ```bash
     snakemake -np -s CHIPS/chips.snakefile --rerun-incomplete
     nohup snakemake -s CHIPS/chips.snakefile --rerun-incomplete -j 16 > run.out &
     ```
Check the run.out and when the pipeline prints out 100% complete, an analysis folder with all the output and report will be generated within the project directory.
Taken together, CHIPS is a scalable and reproducible pipeline written in Snakemake. It performs quality control and reproducible processing of the chromatin profiling data generated from ATAC-seq, ChIP-seq, and DNase-seq experiments. CHIPS does not explicitly label samples as being “low” or “high” quality overall. We rely on the users to interpret information from multiple quality control features to determine which samples to include for further downstream analyses. CHIPS also does not provide downstream analyses comparing cases and controls. Downstream analyses depend on the biological context of the experiments and may consist of differential binding, motif analysis, and pathway analysis in the setting of chromatin profiling experiments. An independent Snakemake pipeline COBRA (Qiu et al. 2020) is designed for this purpose.
- The TCGA LUAD ATACseq data for Use Case 1 are available from Genomic Data Commons Data Portal: https://bit.ly/3bPytgG.
- The ENCODE ATACseq data for Use Case 2 are available from ENCODE data portal: https://www.encodeproject.org/experiments/ENCSR200OML/ (ATAC-seq of Panc1). https://www.encodeproject.org/experiments/ENCSR591PIX/ (ATAC-seq of IMR-90).
Source code available from: https://github.com/liulab-dfci/CHIPS.
Archived source code at time of publication: http://doi.org/10.5281/zenodo.4782801 (Tang, 2021).
License: MIT.
| Views | Downloads | |
|---|---|---|
| F1000Research | - | - |
|
PubMed Central
Data from PMC are received and updated monthly.
|
- | - |
Provide sufficient details of any financial or non-financial competing interests to enable users to assess whether your comments might lead a reasonable person to question your impartiality. Consider the following examples, but note that this is not an exhaustive list:
Sign up for content alerts and receive a weekly or monthly email with all newly published articles
Already registered? Sign in
The email address should be the one you originally registered with F1000.
You registered with F1000 via Google, so we cannot reset your password.
To sign in, please click here.
If you still need help with your Google account password, please click here.
You registered with F1000 via Facebook, so we cannot reset your password.
To sign in, please click here.
If you still need help with your Facebook account password, please click here.
If your email address is registered with us, we will email you instructions to reset your password.
If you think you should have received this email but it has not arrived, please check your spam filters and/or contact for further assistance.
Comments on this article Comments (0)