Keywords
ammonia, carbon dioxide, methane, nitrogen, organisms, oxygen, static magnetic field, water
ammonia, carbon dioxide, methane, nitrogen, organisms, oxygen, static magnetic field, water
There are a considerable number of monographs1–3 and papers4–12 characterizing the effects of all kinds of magnetic field upon flora and fauna. Currently, a focus is noted on the effect of magnetic resonance imaging on humans13–16. There are several reports with well documented biological effects of magnetic field. However, their interpretation and considerations on mechanisms of those effects on the molecular level are scarce16–20. Because of increasing environmental pollution with magnetic fields21,22 and considerable involvement of magnetic fields in current and future technologies23–25 this problem should attract particular attention.
Recently, Jaworska et al., reported the stimulating effect of water treated with static magnetic field (SMF) of up to ~0.2T upon the growth and pathogenicity of entomopathogenic organisms both nematodes26 and fungi27,28. These results suggested a modification of the water macrostructure. Thus, one might assume that SMF can influence hydration of biological membranes and objects within the living cells. Turning the water macrostructure into smaller clusters29,30 could facilitate the penetration of water across membranes into the cells. Also structures of nitrogen, ammonia and carbon dioxide molecules present in living organisms could be modified by SMF and these processes might be involved in the observed effects. Białopiotrowicz et al.29 reported formation of singlet oxygen on a treatment of water saturated with air with a low-temperature, low-pressure glow plasma of low frequency. The singlet oxygen molecules were stabilized by their incorporation into aqueous clathrates of the nanometric dimensions.
These factors strongly suggested that water and small inorganic molecules could participate in the observed effects of magnetic field and control mechanisms and kinetics of phenomena induced by SMF.
This paper presents results of computational simulations of the structure of molecular oxygen, nitrogen, water, carbon dioxide, ammonia and methane in SMF of the flux density from 0 to 100T.
Molecular structures were drawn using the Fujitsu SCIGRESS 2.0 software31 (open-access alternative software: GaussView 6). Their principal symmetry axes were oriented along the x-axis of the Cartesian system. The magnetic field was fixed in the same direction with the south pole from the left side. Subsequently, the molecules were optimized involving Gaussian 0.9 software equipped with the 6-31G** basis32 (open-access alternative software: Spartan 1.0.0). For those optimized single molecules bond lengths, dipole moments, heaths of formation and bond energies were computed. Additionally, computations of HOMO/LUMO energy level for single molecules as well as HOMO/LUMO energy level and total energy for systems built of three molecules were also performed.
In the consecutive step, influence of SMF upon optimized molecules were computed with Amsterdam Modeling Suite software33,34 (open-access alternative software: ORCA 5.0). and the NR_LDOTB (non-relastivically orbital momentum L-dot-B) method35,36. Following that step, using Gaussian 0.9 software equipped with the 6-31G** basis32 values of bond length, dipole moment, heath of formation equal to the energy of dissociation, bond energy HOMO/LUMO energy level for single molecules were again computed using the single-point energy option key word.
Visualisation of the HOMO/LUMO orbitals and changes of the electron density for particular molecules and their three molecule systems was performed involving the HyperChem 8.0 software37 (open-access alternative software: GaussView 6).
Properties of the single molecule of oxygen (O2) situated along the x-axis of the Cartesian system in SMF of the flux density of 0 to 100T are presented in Table 1. Isosurfaces resulting from computations for molecules of the triplet and singlet molecules are presented in Figure 1 and Figure 2, respectively. Energy of electrons situated on particular orbitals in the single molecule of oxygen (O2) placed in SMF of the flux density of 0 to 100T are collected in Table 2. Table 3 and Table 4 collect data characterizing properties of the system of three molecules of oxygen and HOMO/LUMO energy of the molecules of oxygen building the three molecular system, respectively. Influence of the application of flux density and resulting distribution of corresponding maximum positive and negative charge density in case of three triplet and singlet oxygen molecules are presented in Figure 3 and Figure 4, respectively.

Isosurface along the x-axis of the Cartesian system of the single molecule of triplet oxygen placed in the magnetic field of 0T (a), 0.1T (b), 1T (c), 10T (d) and 100T (e).
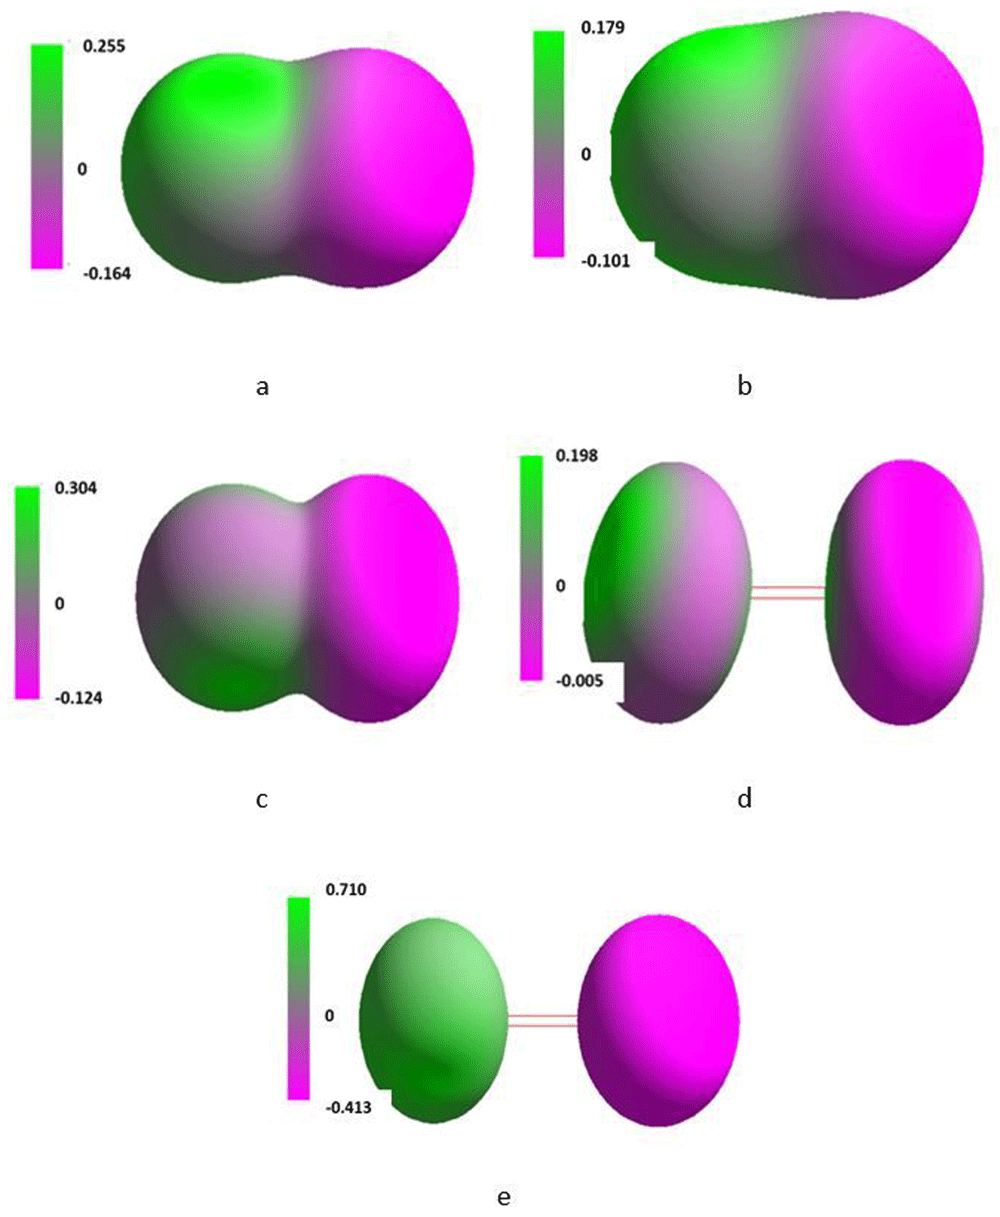
Isosurface along the x-axis of the Cartesian system of the single molecule of singlet oxygen placed in the magnetic field of 0T (a), 0.1T (b), 1T (c), 10T (d) and 100T (e).

Isosurface along the x-axis of the Cartesian system of three molecules of triplet oxygen placed in the flux density of 0T (a), 0.1T (b), 1T (c), 10T (d) and 100T (e).

Isosurface along the x-axis of the Cartesian system of three molecules of singlet oxygen placed in the flux density of 0T (a), 0.1T (b), 1T (c), 10T (d) and 100T (e).
Molecular oxygen in its ground state resided as triplet. Its excitation transformed it into singlet states38,39. They differed from one another in the heat of formation (Table 1). For the triplet molecule its value was slightly negative whereas for the singlet molecule it was considerably positive. Considerable difference between the values of heat formation of the triplet and singlet molecules reflected the fact that the singlet oxygen was a specific short leaving excited state of oxygen40. The bond energy for the triplet as well as singlet molecules slightly decreased with an increase in applied flux density. Corresponding values for the singlet molecules were lower than those for the triplet molecules. The O-O bond length in the triplet molecule was slightly shorter than in the singlet molecule. Therefore, the singlet molecule was more stretched, hence more unstable and reactive. In both cases the bond length fairly regularly increased with an increase in applied flux density. In both cases it resulted in developing residual electric dipole moment more readily in the triplet molecule. Comparison of the energy gaps ΔHOMO/LUMO revealed that SMF only slightly influenced the excitation energy of the triplet oxygen molecule but considerably decreased it in the singlet oxygen molecule.
Figure 1 and Figure 2 present numerically simulated electronic density of so-called isosurfaces, for single molecules of the triplet and singlet oxygen, respectively, exposed to the magnetic field of 0.1 to 100 T along the x-axis. On these and subsequent figures green and pink colours represent positive and negative charge, respectively. The intensity of both colours associated with the value of the charges is scaled on the left side of every isosurface. An increase in applied SMF flux density resulted in polarization of the molecules. The original shape of isosurface of the triplet molecule only slightly changed but in case of the singlet molecule an essential change of the isosurface shape could be noted, particularly at 10 and 100 T.
Values of the maximal negative and positive surface charge densities are grouped in Table 1. In the molecule of triplet oxygen, the maximum of the positive charge density rose regularly against T whereas, simultaneously, the maximum of the negative charge density rose irregularly. The same parameters found for the singlet oxygen molecule also varied irregularly with increase in T. Above 10T a complete shift of the surface charge was observed.
Energy of corresponding LUMO and HOMO of triplet and singlet molecules fairly regularly declined with increase in T (Table 1) but energy of electrons situated on particular orbitals of those molecules varied nonlinearly (Table 2). It might suggest that some flux density dependent hybridizations of corresponding orbitals were involved leading to resonance like structures.
The distribution of the charge presented in structures d and e might suggest formation of ozone.
Like in case of single molecules placed in SMF of 100T also in the group of three singlet as well as triplet molecules the positive and negative charges were distributed symmetrically. Maximal positive charge density for the systems built of three triplet and singlet molecules changed irregularly (Table 3). An initial increase observed for the systems placed in SMF of 0.1 T declined reaching the lowest value for the system placed in SMF of 1 T. This irregularity was well illustrated with specific shapes of corresponding isosurfaces (Figure 3 and Figure 4). In contrast to the maximal positive charge density, maximal negative charge density declined with increase in applied flux density. The irregular pattern of those changes resembled these observed for the maximal positive charge density. Again, the irregularity was found in the data for the molecules placed in SMF of 1T.
An increase in the SMF flux density shortened and elongated distance between the excited (LUMO) and ground (HOMO) states in the system of three triplet and singlet molecules, respectively (Table 4).
Corresponding results for single molecules of nitrogen are presented in Table 5 and Table 6 and Figure 5. Data for the system of three molecules of nitrogen are given in Table 7 and Table 8 and in Figure 6. Molecular nitrogen in the ground state is in the singlet state but under specific conditions it can be excited into triplet states41,42. SMF of the flux density increasing up to 100T only slightly changed properties of that molecule retaining its singlet character (Table 5). The interatomic distance slightly increased and the residual dipole moment generated already at 1T remained practically unchanged up to 100T. As the applied T increased, heat of formation of the molecule considerably increased and, simultaneously, bond energy decreased. The energy of LUMO initially slightly decreased in order to increase the flux density of 10 and 100T. It was paralleled with a regular decrease in the energy of HOMO. An insight into energy of electrons situated on particular orbitals in the single molecule of nitrogen (N2) (Table 6) revealed that, with some exceptions, they changed regularly against increasing values of T. The irregularities were noted in case of the π*2p, σ*2s and σ*1s orbitals at 0.1 and 1T. They might be associated with the SMF promoted hybridization of those orbitals. An increase in ΔMOMO/LUMO informs that an increase in SMF flux density resulted in inhibiting excitation of the molecule. It also increased and decreased maximum of the positive and negative charge density, respectively (Table 4), however, as shown in Figure 5 the size and shape of the isosurface along the x-axis remained fairly stable.
| Parameter | Energy [kcal/mole] at flux density [T] | ||||
|---|---|---|---|---|---|
| 0 | 0.1 | 1 | 10 | 100 | |
| Total | 307.23 | 315.68 | 324.58 | 368.59 | 446.26 |
| LUMO | 29.52 | 29.59 | 30.25 | 31.38 | 33.85 |
| HOMO | -11.52 | -11.02 | -10.36 | -10.22 | -10.12 |
| ΔHOMO/LUMO | 41.04 | 40.61 | 40.61 | 41.60 | 43.97 |
| Charge | Maximal charge density at flux density [T] | ||||
|---|---|---|---|---|---|
| 0 | 0.1 | 1.0 | 10 | 100 | |
| Positive | +0.479 | +4.498 | +0.502 | +0.527 | +0.699 |
| Negative | -0.132 | -0.295 | -0.211 | -0.118 | -0.353 |
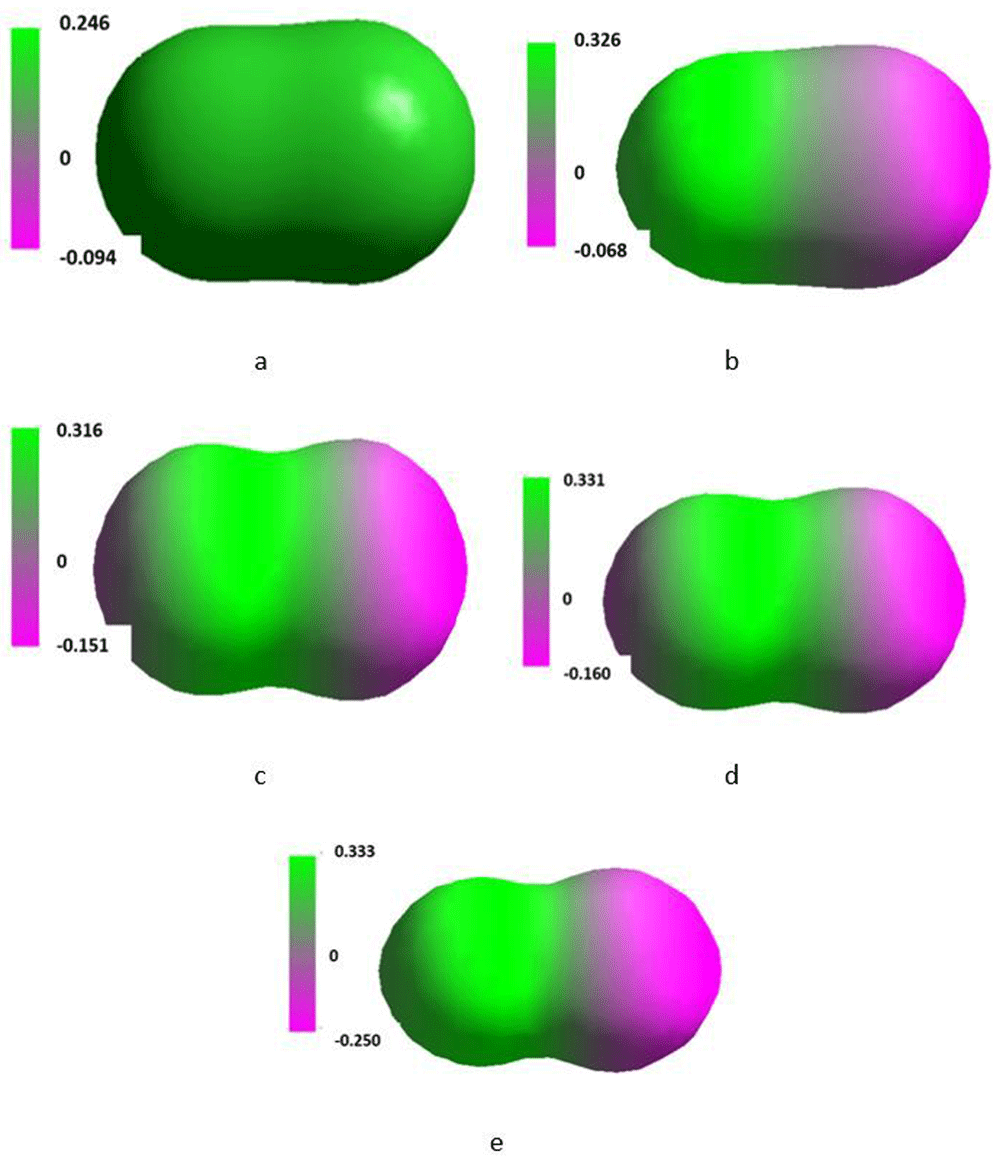
Isosurface along the x-axis of the Cartesian system of the single molecule of nitrogen placed in the SMF flux density of 0T (a), 0.1T (b), 1T (c), 10T (d) and 100T (e).

Isosurface along the x-axis of the Cartesian system of three molecules of nitrogen placed in the SMF flux density of 0T (a), 0.1T (b), 1T (c), 10T (d) and 100T (e).
In the system of three nitrogen molecules its total energy rose with applied flux density. Energy of LUMO and HOMO of the whole system increased and decreased, respectively (Table 7). Difference between energy of HOMO and LUMO was independent of applied SMF. Maximum of the positive and negative charge density distribution quoted in Table 7 reflected substantial changes of the shape and size of the isosurface presented in Figure 6.
On increase in applied T maximum of the positive charge on the surface increased by 0.220 units. Simultaneously, maximum of the negative charge density decreased by 0.221 units. Thus, the charge shifts proceeded solely on the surface. Because the sum of both values was close to zero the charge did not delocalize.
Depending on the applied flux density, the system of three nitrogen molecules reoriented in the Cartesian system as shown in Figure 6. It was accompanied with a fluctuation of the value of the maximum negative charge density (Table 8).
Table 9 and Table 10 and Figure 7 contain results of computations for a single molecule of water and Figure 8 shows its isosurface. Subsequently, data for the system of three molecules of water are given in Table 11 and Table 12. and the isosurface for that system is presented in Figure 9. In nature, above 0K, water molecules vibrate like other molecules. The O-H bond lengths change either symmetrically or asymmetrically. It is reflected by changes of their dipole moment. In consequence, their hydrophilic/hydrophobic properties are accordingly modified. Such vibrations also affect dissociation of the molecules influencing their ability to build the macrostructure with involvement of intermolecular hydrogen bonds. Additionally, bending modes change the H-O-H bond angle of these molecules43.
| Energy [kcal/mole] at flux density [T] | |||||
|---|---|---|---|---|---|
| 0 | 0.1 | 1.0 | 10 | 100 | Orbitala |
| 11.01 | 11.23 | 11.62 | 11.71 | 11.85 | 3a1 |
| -4.137 | -4.138 | -4.151 | -4.169 | -4.178 | ↑↓ 1b1 |
| -6.165 | -6.169 | -6.172 | -6.173 | -6.175 | ↑↓ 2a1 |
| -10.93 | -11.36 | -11.39 | -11.42 | -11.49 | ↑↓ 1b2 |
| -25.23 | -25.26 | -25.31 | -25.36 | -25.41 | ↑↓ 1a1 |
aSee Figure 7 for notation.

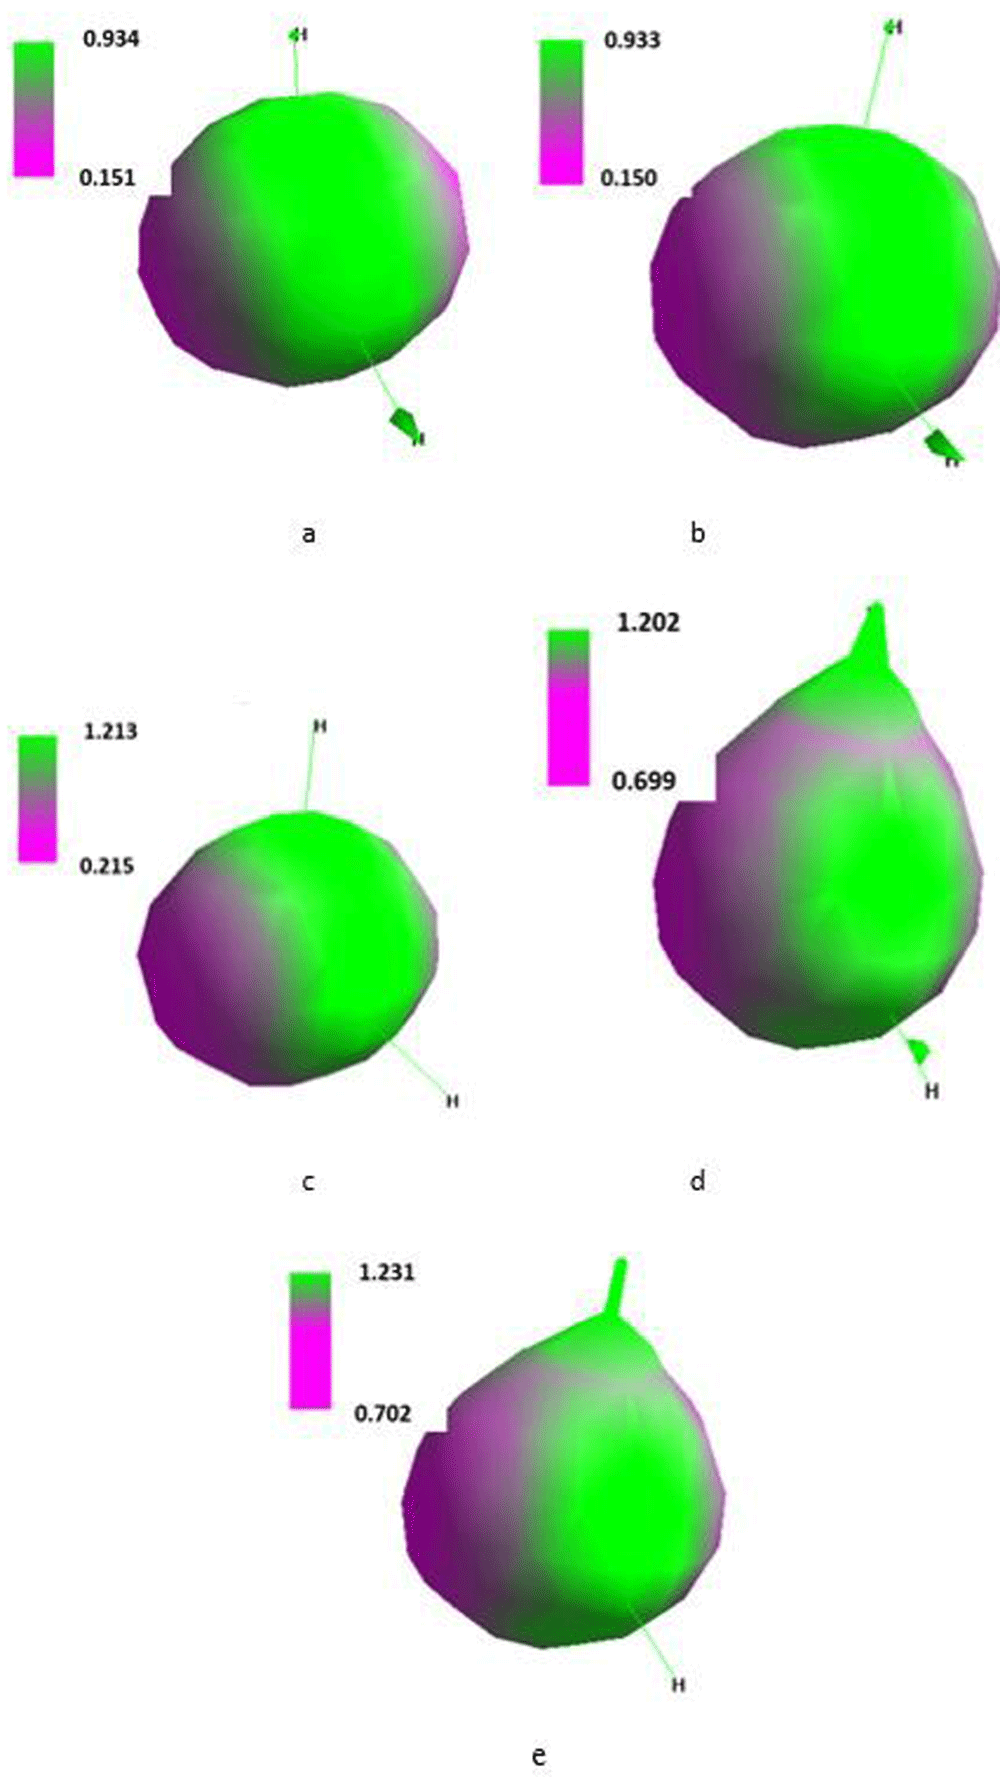
Isosurface along the x-axis of the Cartesian system of the single molecule of water placed in the SMF flux density of 0T (a), 0.1T (b), 1T (c), 10T (d) and 100T (e).
| Parameter | Energy [kcal/mole] at flux density [T] | ||||
|---|---|---|---|---|---|
| 0 | 0.1 | 1 | 10 | 100 | |
| Total | 156.3 | 156.8 | 157.3 | 159.6 | 161.8 |
| LUMO | 5.17 | 5.51 | 6.21 | 6.88 | 7.85 |
| HOMO | -2.14 | -2.07 | -1.53 | -1.22 | -1.12 |
| ΔHOMO/LUMO | 7.31 | 7.58 | 7.74 | 8.10 | 8.97 |
| Charge | Maximal charge density at flux density [T] | ||||
|---|---|---|---|---|---|
| 0 | 0.1 | 1.0 | 10 | 100 | |
| Positive | 1.621 | 2.248 | 3.522 | 30.656 | 2.301 |
| Negative | 0.545 | 0.470 | 0.446 | 0.318 | 0.456 |
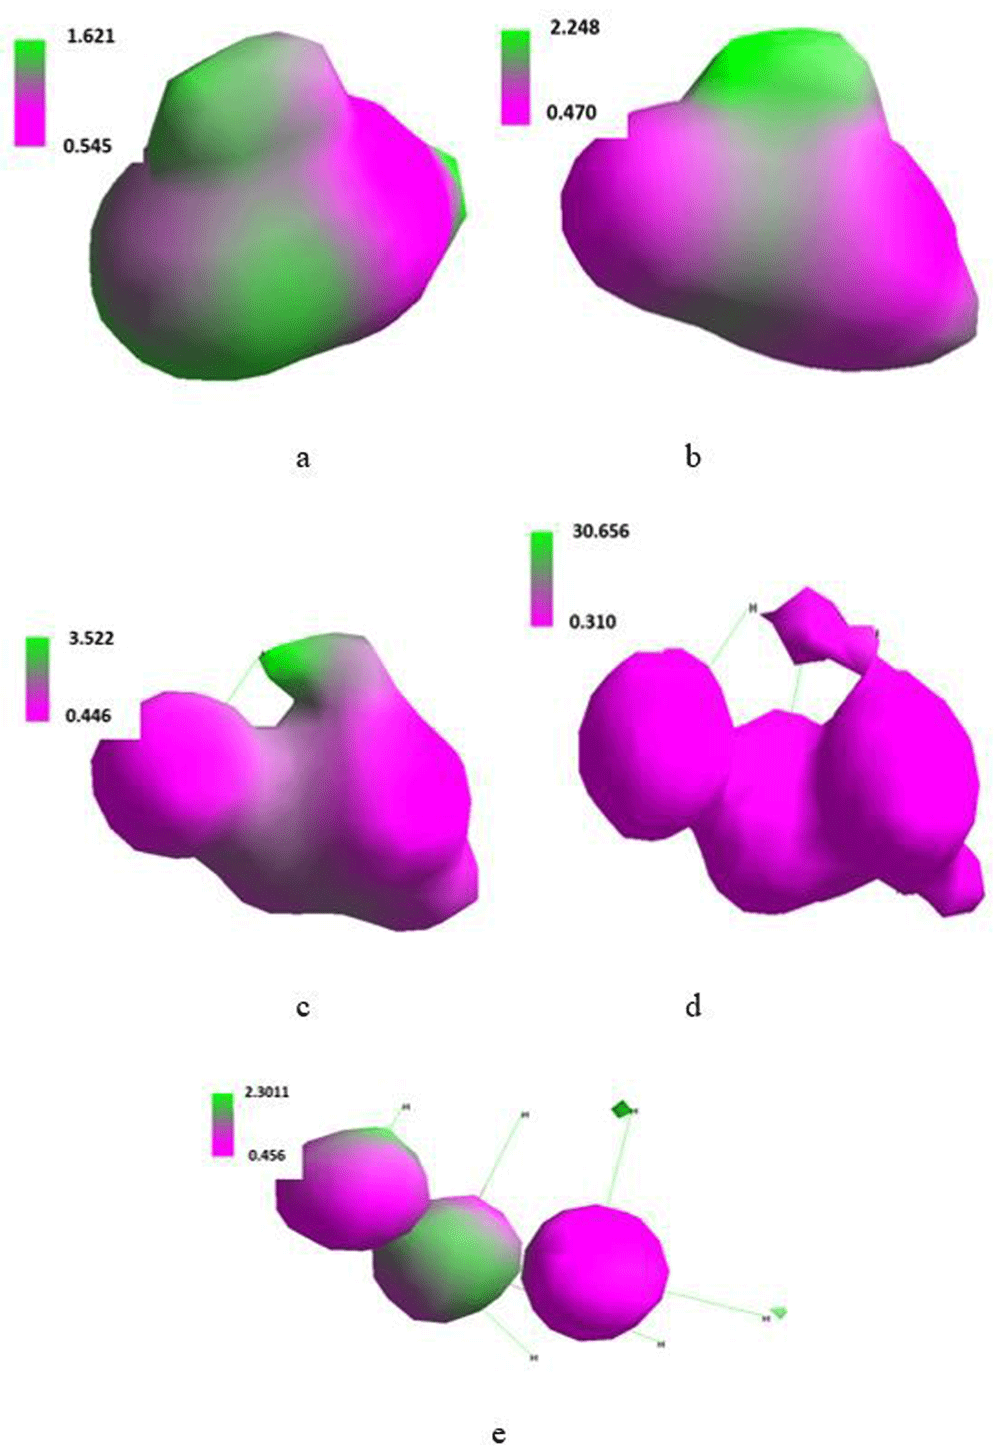
Isosurface along the x-axis of the Cartesian system of three molecules of water placed in the SMF flux density of 0T (a), 0.1T (b), 1T (c), 10T (d) and 100T (e).
Computations for the water molecule placed under computer vacuum in SMF could potentially suggest a facile H-O-H bond break and the ability to form intermolecular hydrogen bonds. If lone electron pairs at the oxygen atom were activated an increase in basicity of the water molecule could be considered.
As shown in Table 9, SMF of the flux density of 0.1T symmetrically elongated both O-H bonds and that symmetry ceased at 1 to 100T. That treatment provided moderate increase in dipole moment of the molecule, monotonous decrease in the bond energy and stability of the molecule in terms of increasing its heat of formation. However, it should be noted that starting from 10T the length of the first of the O-H bonds decreased. It pointed to an involvement of decrease in the symmetry of vibrations, whereas vibrations of the second O-H bond remained nearly constant.
An increase in the flux density was paralleled with increase in the positive energy of LUMO and negative energy of HOMO. Monotonous increase in ΔHOMO/LUMO values showed that an increase in the SMF flux density reduced a possibility of excitation of the water molecule. Energy of electrons on particular orbitals in the single water molecule varied with the flux density in the manner presented in Table 10. Solely the positive energy of the empty 3a1 orbital monotonously increased against increasing flux density whereas the negative energy of electrons occupying remaining orbitals slightly monotonously declined. It pointed to inhibiting excitation of the water molecule.
Isosurface along the x-axis of the Cartesian system for the single molecule of water (Figure 8) demonstrated that SMF only slightly changed orientation of the molecule with increase in the surface density but polarization of the molecule considerably increased.
Total energy of the system built of three molecules of water was fairly insensitive to an increase in applied flux density. Moreover, there was considerable response from the energy of LUMO and HOMO. The energy of LUMO monotonously increased and, simultaneously, energy of HOMO in the same manner decreased (Table 11) as demonstrated in terms of an increase in ΔHOMO/LUMO. Thus, SMF inhibited the excitation of the molecule of water.
Maximum of the positive and negative charge density distribution quoted in Table 12 reflected substantial changes of the shape and size of the isosurface presented in Figure 9.
Out of SMF, three water molecules arranged into an irregular ball. At 0.1T it polarized with simultaneous reorientation along the x-axis. Its shape was retained but as the flux density increased, it gradually expanded into a more linear shape in which the number of intermolecular hydrogen bonds declined. A considerable irregularity in the distribution of the maximum charge density at 10T should be noted. It was reflected by a specific shape of the corresponding isosurface (Figure 9).
Table 13, Table 14 and Figure 10 and Figure 11 present relevant data for a single CO2 molecule. and Table 15, Table 16 and Figure 12 show computed data for the system of three CO2 molecules.
| Energy [kcal/mole] at flux density [T] | Orbitala | ||||
|---|---|---|---|---|---|
| 0 | 0.1 | 1.0 | 10 | 100 | |
| 1.235 | 1.435 | 1.635 | 1.735 | 1.896 | ↑↓ 3b1u |
| -4.424 | -4.413 | -4.369 | -3.569 | -3.424 | ↑↓ 1b3g |
| -4.424 | -4.413 | -4.366 | -3.566 | -3.422 | ↑↓ 1b3g |
| -7.245 | -7.643 | -9.474 | -9.854 | -9.995 | ↑↓ 2b2u |
| -7.247 | -7.635 | -9.459 | -9.855 | -9.997 | ↑↓ 2b2u |
| -9.470 | -9.684 | -10.240 | -11.230 | -12.470 | ↑↓ 2b1u |
| -12.42 | -12.46 | -12.87 | -13.04 | -13.42 | ↑↓ 2ag |
| -27.45 | -27.47 | -27.56 | -27.62 | -29.45 | ↑↓ 1b1u |
| -29.36 | -29.43 | -30.09 | -30.13 | -32.36 | ↑↓ 1ag |
aSee Figure 10 for notation.


Isosurface along the x-axis of the Cartesian system of the single molecule of CO2 placed in SMF flux density of 0T (a), 0.1T (b), 1T (c), 10T (d) and 100T (e).
| Parameter | Energy [kcal/mole] at flux density [T] | ||||
|---|---|---|---|---|---|
| 0 | 0.1 | 1 | 10 | 100 | |
| Total | 317.23 | 319.38 | 324.58 | 358.44 | 387.98 |
| LUMO | 4.47 | 4.51 | 4.21 | 3.88 | 3.85 |
| HOMO | -3.64 | -3.67 | -3.53 | -3.22 | -3.12 |
| ΔHOMO/LUMO | 8.11 | 7.81 | 7.74 | 7.10 | 6.97 |
| Charge | Maximal charge density at flux density [T] | ||||
|---|---|---|---|---|---|
| 0 | 0.1 | 1.0 | 10 | 100 | |
| Positive | 1.282 | 1.981 | 1.710 | 9.643 | 6.801 |
| Negative | 0.214 | 0.370 | -0.003 | 0.888 | -0.123 |
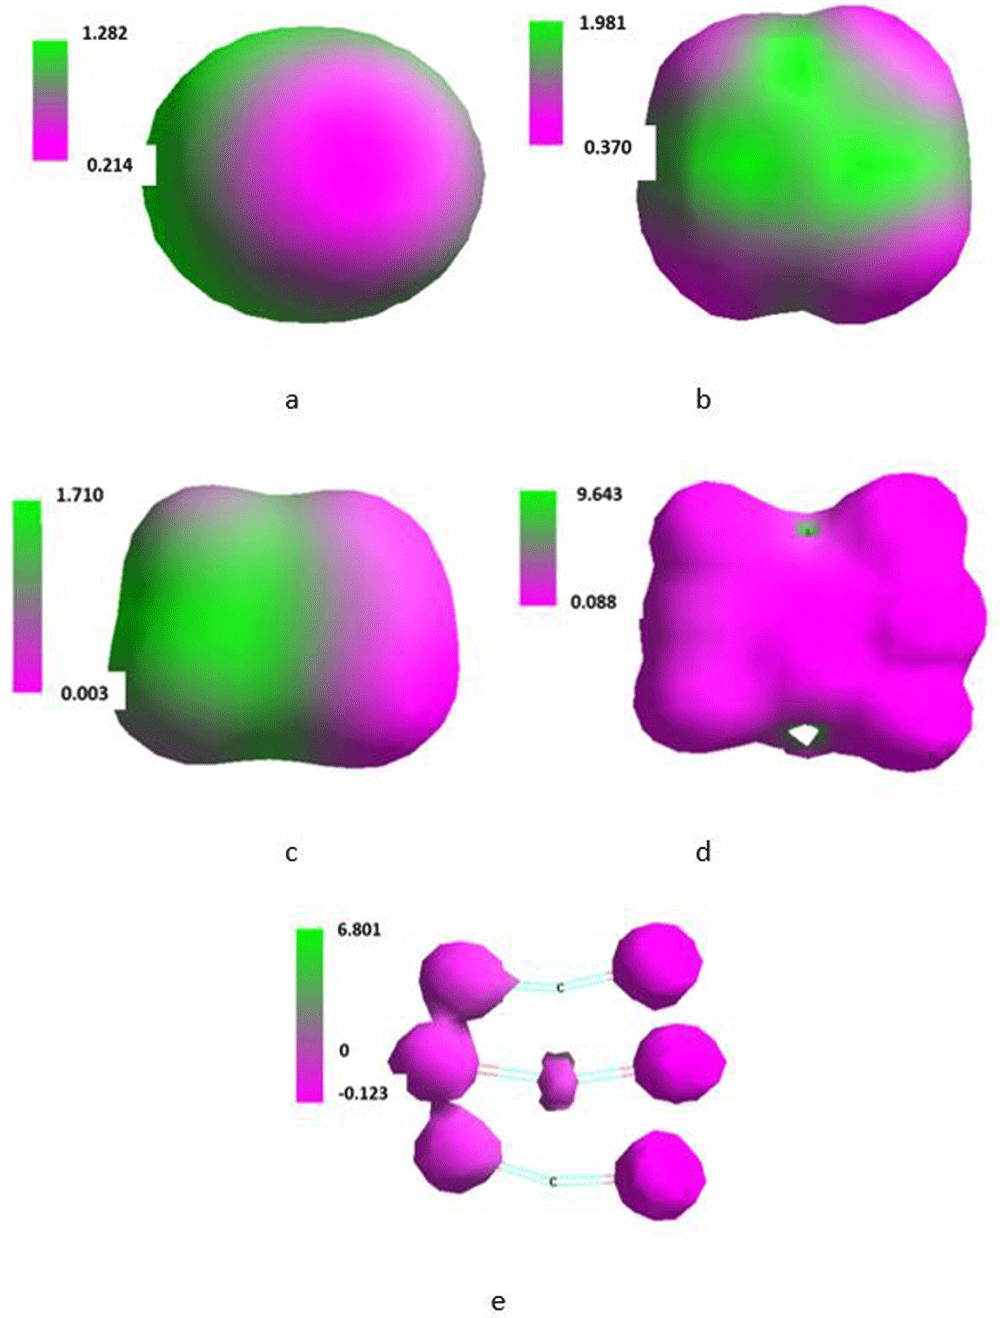
Isosurface along the x-axis of the Cartesian system of three molecules of CO2 placed in SMF flux density of 0T (a), 0.1T (b), 1T (c), 10T (d) and 100T (e).
Carbon dioxide represents a π-electron system. Hence, because of the mobility of the π-electrons44,45 unexpected behaviour of the molecule placed in SMF might be anticipated. Thus, the length of both C=O bonds changed with increase in T but at 0.1 and 100T both bonds had slightly different length, perhaps mainly because of limited precision of calculations. Dipole moment of the molecule increased with T whereas the heat of formation and bond energy practically linearly decreased against T (Table 13). Energy of LUMO and HOMO also monotonously increased and decreased, respectively. The energetic ΔHOMO/LUMO gap reached maximum at about 1T.
Irregularity was observed for changes of maximum of positive and negative charge density (Table 13). Maximum of positive charge density increased up to 1T in order to strongly decrease at 10 and 100T. Except electrons situated at 2b2u, level energy of electrons situated on particular orbitals of the single molecule at increasing SMF flux density only slightly changed. Energy of electrons located at the 2b2u jumped suddenly at 1T (Table 14).
Shape of isosurface of the SMF treated molecule (Figure 11) resulted in polarisation of the molecule in varying manner tending to localize the negative charge on the oxygen atoms. The effect was dependent on the applied flux density. The molecules did not reorient in the Cartesian system holding their initial orientation.
In the system composed of three CO2 molecules, total energy of the system increased with an increase in applied flux density. The LUMO energy reached maximum at 0.1T in order to decrease up to 100T. Energy of HOMO changed in the same way (Table 15).
Maximum of the positive and negative charge density distribution (Table 16) reflected substantial changes of the shape and size of the isosurface presented in Figure 12. Three molecules of CO2 out of SMF formed a ball. In the SMF of 0.1T a tendency to separate that ball into two parts perpendicularly to the x-axis was observed. This tendency increased with increase in applied T in order to afford a separation at 100T.
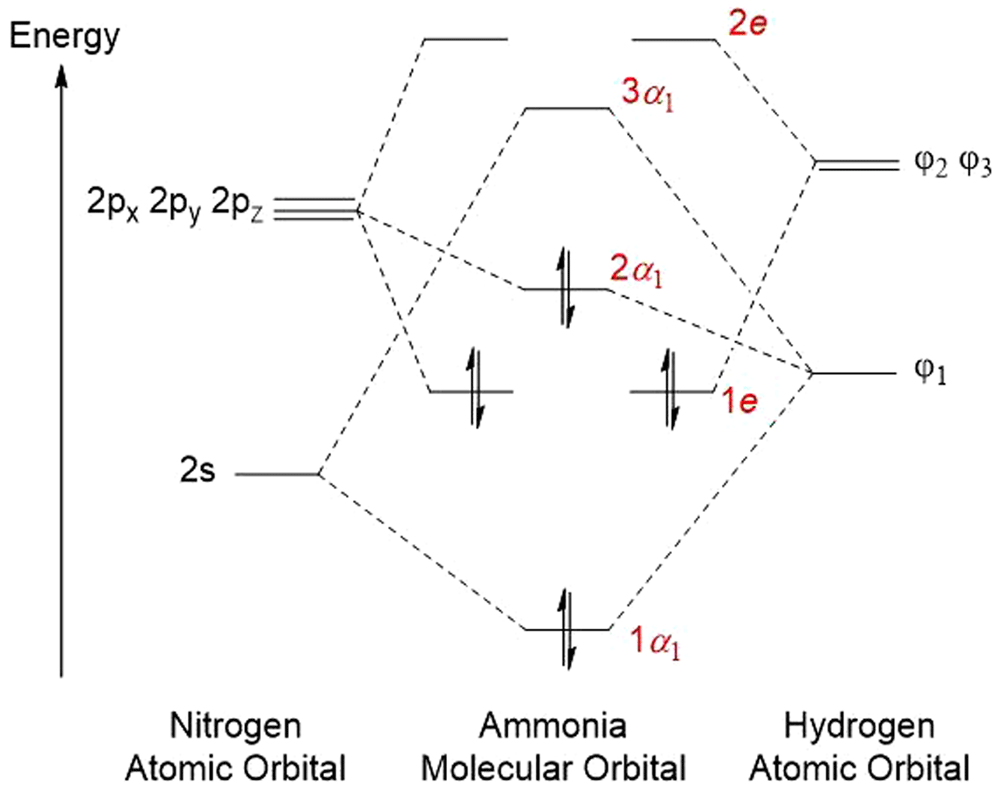
Results for a single molecule of ammonia are given in Table 17 and Table 18 and in Figure 13 and Figure 14. Data for the system of three molecules of ammonia can be found in Table 19 and Table 20 and in Figure 15.
| Energy [kcal/mole] at flux density [T] | |||||
|---|---|---|---|---|---|
| 0 | 0.1 | 1.0 | 10 | 100 | Orbitala |
| 5.229 | 5.232 | 5.856 | 6.028 | 6.534 | 3a1 |
| -5.092 | -5.098 | -5.625 | -5.874 | -6.125 | ↑↓ 2a1 |
| -11.64 | -11.56 | -11.45 | -11.14 | -10.25 | ↑↓ 1e |
| -11.62 | -11.54 | -11.45 | -11.15 | -10.23 | ↑↓ 1e |
| -25.21 | -25.25 | -26.05 | -26.72 | -27.52 | ↑↓ 1a1 |
aSee Figure 13 for notation.

Isosurface along the x-axis of the Cartesian system of the single molecule of ammonia placed in SMF flux density of 0T (a), 0.1T (b), 1T (c), 10T (d) and 100T (e).
| Parameter | Energy [kcal/mole] at flux density [T] | ||||
|---|---|---|---|---|---|
| 0 | 0.1 | 1 | 10 | 100 | |
| Total | 235.4 | 236.5 | 254.5 | 278.6 | 296.8 |
| LUMO | 5.47 | 5.45 | 5.21 | 4.88 | 3.99 |
| HOMO | -2.33 | -2.17 | -2.03 | -1.92 | -1.98 |
| ΔHOMO/LUM | 7.80 | 7.64 | 7.24 | 6.80 | 5.97 |
| Charge | Maximal charge density at flux density [T] | ||||
|---|---|---|---|---|---|
| 0 | 0.1 | 1.0 | 10 | 100 | |
| Positive | 3.616 | 2.317 | 2.293 | 3.009 | 3.341 |
| Negative | 0.370 | 0.425 | 0.492 | 0.596 | 0.467 |

Isosurface along the x-axis of the Cartesian system of three molecules of ammonia placed in SMF of the flux density of 0T (a), 0.1T (b), 1T (c), 10T (d) and 100T (e).
The molecule is the shape of a pyramid with the orbital occupied by the lone electron pair and it is also capable of excitation46. When placed in SMF the bond lengths responded depending on the applied flux density. At 1 to 100T their lengths gradually compressed to an extent individual to each bond (Table 17). Nevertheless, the N-H bonds turned shorter, dipole moment slightly increased paralleling applied flux density. These changes were paralleled by increase in heat of formation and decrease in bond energy.
An increase in the SMF flux density resulted in an increase in the ΔHOMO/LUMO energy, Thus, SMF deactivates ammonia. Simultaneously, energy of LUMO and HOMO proportionally increased and decreased, respectively.
Maximum of the positive charge density rapidly jumped after application of 0.1T and then rose regularly with increase in applied T (Table 17). This jump was accompanied by a similar jump of the maximum of the negative charge density. However, as the applied flux density increased, the value of the maximum charge density decreased. From the data for energy of electrons placed in SMF (Table 18), electrons situated on orbitals 1e could be involved. The molecule situated in the Cartesian system along the x-axis only slightly rotated under the influence of increasing flux density (Figure 14).
In the system of three ammonia molecules its total energy increased with increase in the SMF flux density whereas energy of LUMO monotonously decreased. Simultaneously, energy of HOMO monotonously increased up to 10T in order to slightly decrease at 100T (Table 19). A monotonously decreasing ΔHOMO/LUMO showed that an increase in the SMF flux density favoured excitation of the system. Maximum of the positive and negative charge density distribution quoted in Table 20 reflected substantial changes of the shape and size of the isosurface presented in Figure 15.
The change of the shape of isosurface of the system of three molecules of NH3 (Figure 15) suggested that in the system out of SMF the molecules interacted involving polar and van der Waals forces. Increasing flux density deteriorated these interactions leading to separated mutually non-interacting molecules.
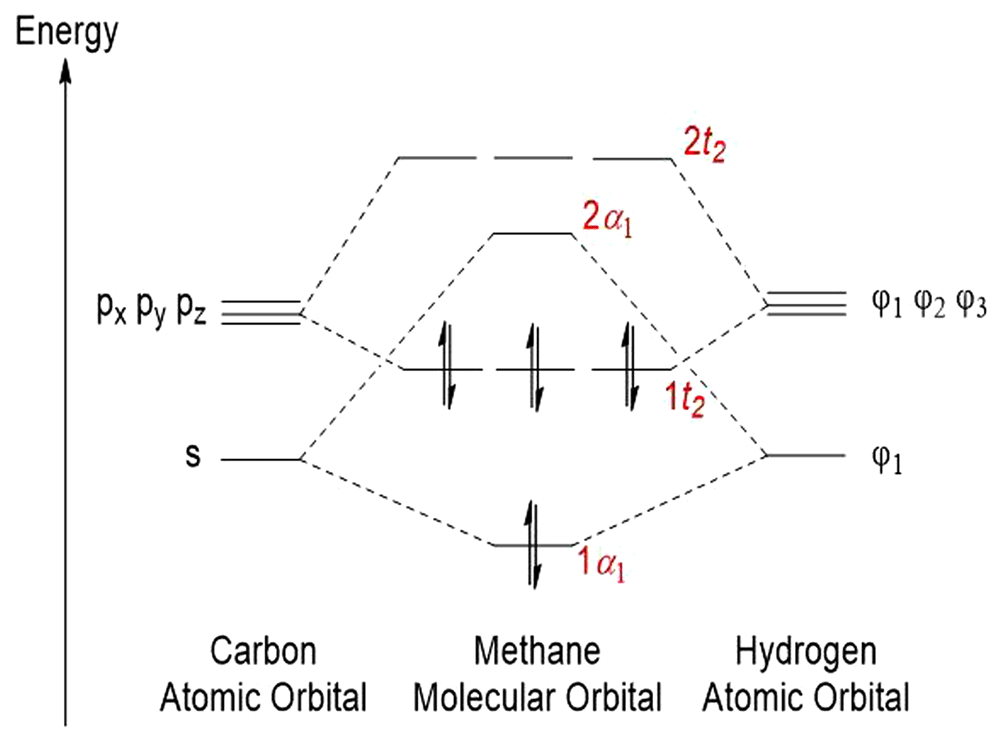
Computed data for a single molecule of methane are placed in Table 21 and Table 12 and in Figure 16 and Figure 17. whereas corresponding data for the system of three molecules of methane are given in Table 23 and Table 24 and in Figure 18.

Isosurface along the x-axis of the Cartesian system of the single molecule of methane placed in SMF flux density of 0T (a), 0.1T (b), 1T (c), 10T (d) and 100T (e).
| Energy [kcal/mole] at flux density [T] | Orbitala | ||||
|---|---|---|---|---|---|
| 0 | 0.1 | 1.0 | 10 | 100 | |
| 9.76 | 9.76 | 9.78 | 9.78 | 10.81 | 3a1 |
| -15.02 | -15.13 | -15.18 | -15.21 | -16.31 | ↑↓ 1b1 |
| -15.02 | -15.14 | -15.19 | -15.23 | -15.32 | ↑↓ 2a1 |
| -15.02 | -15.13 | -15.13 | -15.22 | -15.30 | ↑↓ 1b2 |
| -16.72 | -16.73 | -17.31 | -17.36 | -17.39 | ↑↓ 1a1 |
aSee Figure 16 for notation.
| Parameter | Energy [kcal/mole] at flux density [T] | ||||
|---|---|---|---|---|---|
| 0 | 0.1 | 1 | 10 | 100 | |
| Total | 213.5 | 213.2 | 212.8 | 212.3 | 203.5 |
| LUMO | 9.05 | 9.11 | 10.21 | 11.23 | 12.85 |
| HOMO | -1.48 | -1.58 | -1.83 | -2.22 | -3.22 |
| ΔHOMO/LUM | 10.53 | 10.69 | 12.04 | 13.45 | 16.07 |
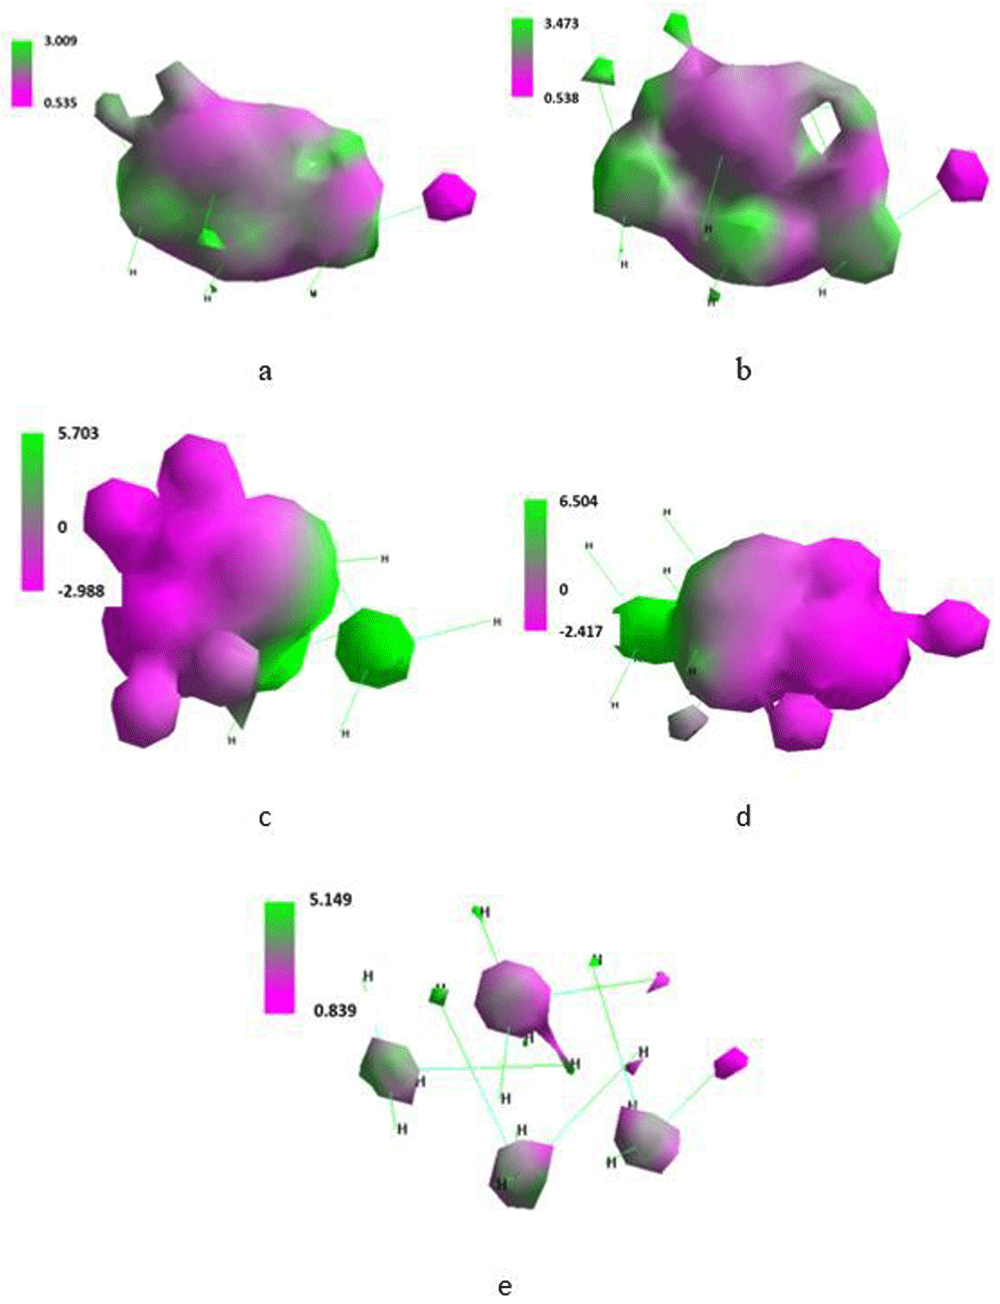
Isosurface along the x-axis of the Cartesian system of three molecules of methane placed in SMF flux density of 0T (a), 0.1T (b), 1T (c), 10T (d) and 100T (e).
Methane presents a symmetric tetrahedr with the carbon atom in its geometrical center and four hydrogen atoms in its corners. Some low-laying electronic excited states of the molecule were computed with the ab initio method47.
Low polarization of the C-H bonds makes the whole molecule fairly resistant to SMF. Just the flux density of 10T slightly expanded the C-H bonds from 1.0932 to 1.0936 (two of four C-H bonds) and to 1.0938Ǻ (remaining two bonds). Increase in the flux density to 100T produced further, non-symmetric elongation of the C-H bonds (Table 21). It resulted in generation of a residual dipole moment of the molecule. However, an increase in the heat of formation could be noted already on exposure of the molecule to 1T. It was accompanied with a slight decrease in the bond energy. Changes of maximum positive and negative charge density appeared peculiar. They were accompanied neither by specific changes of the LUMO and HOMO energy (Table 21) nor energy of electrons situated on particular orbitals of that molecule (Table 22). A monotonous increase in ΔHOMO/LUMO with increasing SMF flux density pointed to reduced affinity of methane to activation. The 3a1 level corresponded to its first unoccupied orbital. Its energy expressed the energy required for the excitation of the methane molecule.
Pecularity mentioned above was rationalized in terms of the shape of isosurface of the molecule in particular values of flux density (Figure 17). At 1T, positive charge density concentrated almost completely on the carbon atom and its traces could be observed on two of four hydrogen atoms. The total positive charge density resided solely at one hydrogen atom. Increase in the applied T shifted the negative charge density completely to one of four hydrogen atoms. At 100T only one hydrogen atom carried the negative charge density and another one held the positive charge density.
Total energy of the system built of three methane molecules slightly decreased when placed in SMF and a more considerable decrease was noted just at 100T (Table 23). Energy of LUMO and HOMO gradually increased and decreased, respectively. Maximal positive and negative charge density changed irregularly with increase in applied T (Table 24). Value of the ΔHOMO/LUMO energy increasing with the SMF flux density pointed to reduced affinity of the system to the excitation.
| Charge | Maximal charge density at flux density [T] | ||||
|---|---|---|---|---|---|
| 0 | 0.1 | 1.0 | 10 | 100 | |
| Positive | 3.009 | 3.473 | 5.703 | 6.504 | 5.149 |
| Negative | 0.535 | 0.538 | -2.988 | -2.417 | 0.839 |
Involving polar and van der Waals forces three molecules of methane formed various condensed structures. At 100T the system spread into three separate molecules (Figure 18).
Performed numerical simulations delivered strong evidence that small inorganic molecules commonly present in the living organisms of flora and fauna can substantially influence functioning of those organisms residing in SMF.
Static magnetic field polarizes molecules of oxygen, nitrogen, water, ammonia, carbon dioxide and methane depending on applied flux density. Static magnetic field of up to 100T causes neither ionization nor breaking valence bonds of molecules placed in that field. In modelled computer vacuum three-molecular conglomerates of very dense packing form systems involving supramolecular orbitals.
Static magnetic field deteriorates supramolecular orbitals of three-molecular conglomerates developing highly polarized structures.
Static magnetic field reduces affinity of the molecules and their conglomerates to the excitation.
All data underlying the results are available as part of the article and no additional source data are required
| Views | Downloads | |
|---|---|---|
| F1000Research | - | - |
|
PubMed Central
Data from PMC are received and updated monthly.
|
- | - |
Is the work clearly and accurately presented and does it cite the current literature?
Partly
Is the study design appropriate and is the work technically sound?
Yes
Are sufficient details of methods and analysis provided to allow replication by others?
Yes
If applicable, is the statistical analysis and its interpretation appropriate?
Not applicable
Are all the source data underlying the results available to ensure full reproducibility?
Yes
Are the conclusions drawn adequately supported by the results?
Partly
References
1. Gurhan H, Bruzon R, Kandala S, Greenebaum B, et al.: Effects Induced by a Weak Static Magnetic Field of Different Intensities on HT-1080 Fibrosarcoma Cells.Bioelectromagnetics. 2021; 42 (3): 212-223 PubMed Abstract | Publisher Full TextCompeting Interests: No competing interests were disclosed.
Reviewer Expertise: Bioelectromagnetics
Alongside their report, reviewers assign a status to the article:
| Invited Reviewers | |
|---|---|
| 1 | |
|
Version 1 20 Jul 21 |
read |
Provide sufficient details of any financial or non-financial competing interests to enable users to assess whether your comments might lead a reasonable person to question your impartiality. Consider the following examples, but note that this is not an exhaustive list:
Sign up for content alerts and receive a weekly or monthly email with all newly published articles
Already registered? Sign in
The email address should be the one you originally registered with F1000.
You registered with F1000 via Google, so we cannot reset your password.
To sign in, please click here.
If you still need help with your Google account password, please click here.
You registered with F1000 via Facebook, so we cannot reset your password.
To sign in, please click here.
If you still need help with your Facebook account password, please click here.
If your email address is registered with us, we will email you instructions to reset your password.
If you think you should have received this email but it has not arrived, please check your spam filters and/or contact for further assistance.
Comments on this article Comments (0)