Keywords
Biostatistics, Medical Education, Shiny, R-software, Sensitivity, Specificity, Positive Predictive Value, Negative Predictive Value.
Biostatistics, Medical Education, Shiny, R-software, Sensitivity, Specificity, Positive Predictive Value, Negative Predictive Value.
The importance of understanding biostatistics in the context of communicating and health-related probabilities and applying them meaningfully with colleagues and patients has been highlighted as an important 21st century component of medical education.1 Indeed, doctors increasingly strive to practice evidence-based medicine and make clinical decisions that are supported by careful evaluation of peer-reviewed research.2,3 Therefore, an effective physician must be able to interpret biostatistical data competently when necessary. Unfortunately, practicing physicians struggle to parse sound knowledge from statistical data.4,5 To address this, many medical school curricula include dedicated biostatistics teaching grounded in medically relevant data sets. Some challenges that medical students face when pursuing proficiency in biostatistics include limited time, motivation, and prior knowledge or experience with which to scaffold learning.6 These challenges necessitate an engaging and streamlined curriculum so that students can get the most out of the effort they put in. Additionally, medical students tend to have a wide range of scheduling and study habits, so individualized learning is often preferred.7 These factors suggest that online resources are a good option to aide medical students in their pursuit of learning biostatistics due to the flexibility of asynchronous, digital instruction. One category of digital tools being increasingly used in teaching statistics is interactive graphics.8,9 The ability to adjust inputs and see immediate outputs (i.e., receive real-time feedback) enables fast perception of trends. This ability is especially useful in statistics when potential inputs can often range from single digits to numbers in the millions. Unfortunately, interactive graphics for statistical visualization are rarely applied to epidemiology or biostatistics in a medical school context. Instead, materials relying on problem sets and manual calculations predominate. Wider adoption of interactive graphics as a suitable teaching resource may be hastened by the generation of evidence to indicate that they are non-inferior to current educational methods. In this study, we investigated how supplemental, online interactive webtools affected first-year medical student learning of sensitivity, specificity, negative/positive predictive values, and prevalence – all of which are biostatistical concepts that concern the calculation and interpretation of probability information used in medical decision-making. We hypothesized that interactive online biostatistical webtools if offered as supplemental learning resources would be used by first-year medical students. We expected that the inherent properties of asynchronous, online resources (e.g., time-flexibility, fosters independent learning) would make the resources appealing to students. We also expected that a constructivism-based design would facilitate conceptual understanding of biostatistics content. We did not anticipate any decline in test scores of students using the new biostatistics resources.
All 94 first-year students in the Frank Netter MD School of Medicine (FHNSOM) Class of 2023 were invited to participate in the study via an in-person announcement (given prior to a mandatory lecture), and then again via institutional email. Both the lecture announcement and email gave a brief overview of the study and indicated where students could find consent forms. If a student completed and submitted a consent form, they were considered enrolled in the study. The number of enrolled participants was 59. The Quinnipiac University IRB deemed data collection and analysis of those who did not enroll in this study, and therefore only interacted with the regular educational instructional strategies and practices for teaching and assessing competence with biostatistics at FNHSOM, to meet the exemption criteria for human subjects research (45 CFR 46.104(d)). These 35 students constituted the control cohort who had no access to the online interactive webtools.
Enrolled students were allocated into Before and After subgroups which determined whether they were able to access the online modules two weeks before or immediately after the regular in-person teaching event on ‘biostatistics used in medical decision-making’ in the Year 1 curriculum. Students at FHNSOM learn biostatistics in small groups of 5-6 students; membership of these small groups is determined through the random enroll feature of the Blackboard® learning management system. Random assignment of Before or After status was made at this small group level for participants in order to ensure that they would mainly interact with others in their in-class biostatistics small group who had the same Before or After access status as themselves. For example, if four members of the six-person small group, “Biostatistics Small Group 1” consented to participate in the study, all 4 were assigned status Before; the remaining two students had no access to the interactive online tools. If three members of the six-person small group, “Biostatistics Small Group 2” consented to participate in the study, all 4 were assigned status After; the remaining three students had no access to the interactive online tools. Thus, three cohorts were constructed: the Before group of students had access to the online interactive webtools two weeks before in-person teaching by FNHSOM faculty occurred (n = 28); the After group of students had access to the online interactive tools immediately after in-person teaching by FNHSOM faculty occurred (n = 31); the No Access control group of students who only received in-person teaching by FNHSOM faculty (n = 35).
Focus groups were comprised of three sets of six students (18 total) who were selected randomly from the pool of study participants. Focus groups were 1 hour in duration and scheduled for the week after the FHSOM biostatistics summative exam so that students could reflect and report on the entire learning period of the study. Focus group questions were centered around student motivation, tool usage, and differences in learning (e.g., “Given that using the biostats webtools was completely optional, what was your motivations to use them if you did or didn’t?”). All sessions were audio-recorded with participants using an assigned letter identifier (e.g., “Participant A”, and transcribed in a de-identified manner (by SH)).
This study lasted for five weeks from August 15, 2019 – September 19, 2019 and was conducted through a mixed methods approach in order to combine “qualitative and quantitative viewpoints, data collection, analysis, and inference techniques for the purposes of breadth and depth of understanding and corroboration”.10 For the qualitative focus groups, we chose an interpretative phenomenological epistemology to explore participants’ experience and interpretation of using or nor using the online interactive tools.11
The Before cohort were given access to the online interactive webtools two weeks before regular in-person teaching of ‘biostatistics used in medical decision-making’ at FHNSOM and for two weeks afterwards until the summative exam occurred. The After cohort were given access to the online interactive webtools immediately after regular in-person teaching of ‘biostatistics used in medical decision-making’ at FHNSOM and for two weeks afterwards until the summative exam occurred. The No Access cohort had no access to the online interactive tool at all but did participate in the regular in-person teaching of ‘biostatistics used in medical decision-making’ at FHNSOM and the summative exam.
Software
R software is a desktop application freely available from the Comprehensive R Archive Project (CRAN) that is well known and widely used in the statistical community.12 R statistical software was chosen as a platform because of SH’s pre-existing familiarity and its diverse statistical capability, online package availability, and open-source nature.13 A recent addition to its functionality has been the development of “Shiny” software that enables R to export a browser compatible HTML file whose functionality may be used to update the R code. By frequently resampling, the R software becomes “reactive” to its own HTML output, enabling an interactive interface. This means that a server with R software on it can be called to produce a webpage to any computer connected to the internet, and the webpage can be used to interact and manipulate with the server-based statistical coding (Figure 1).
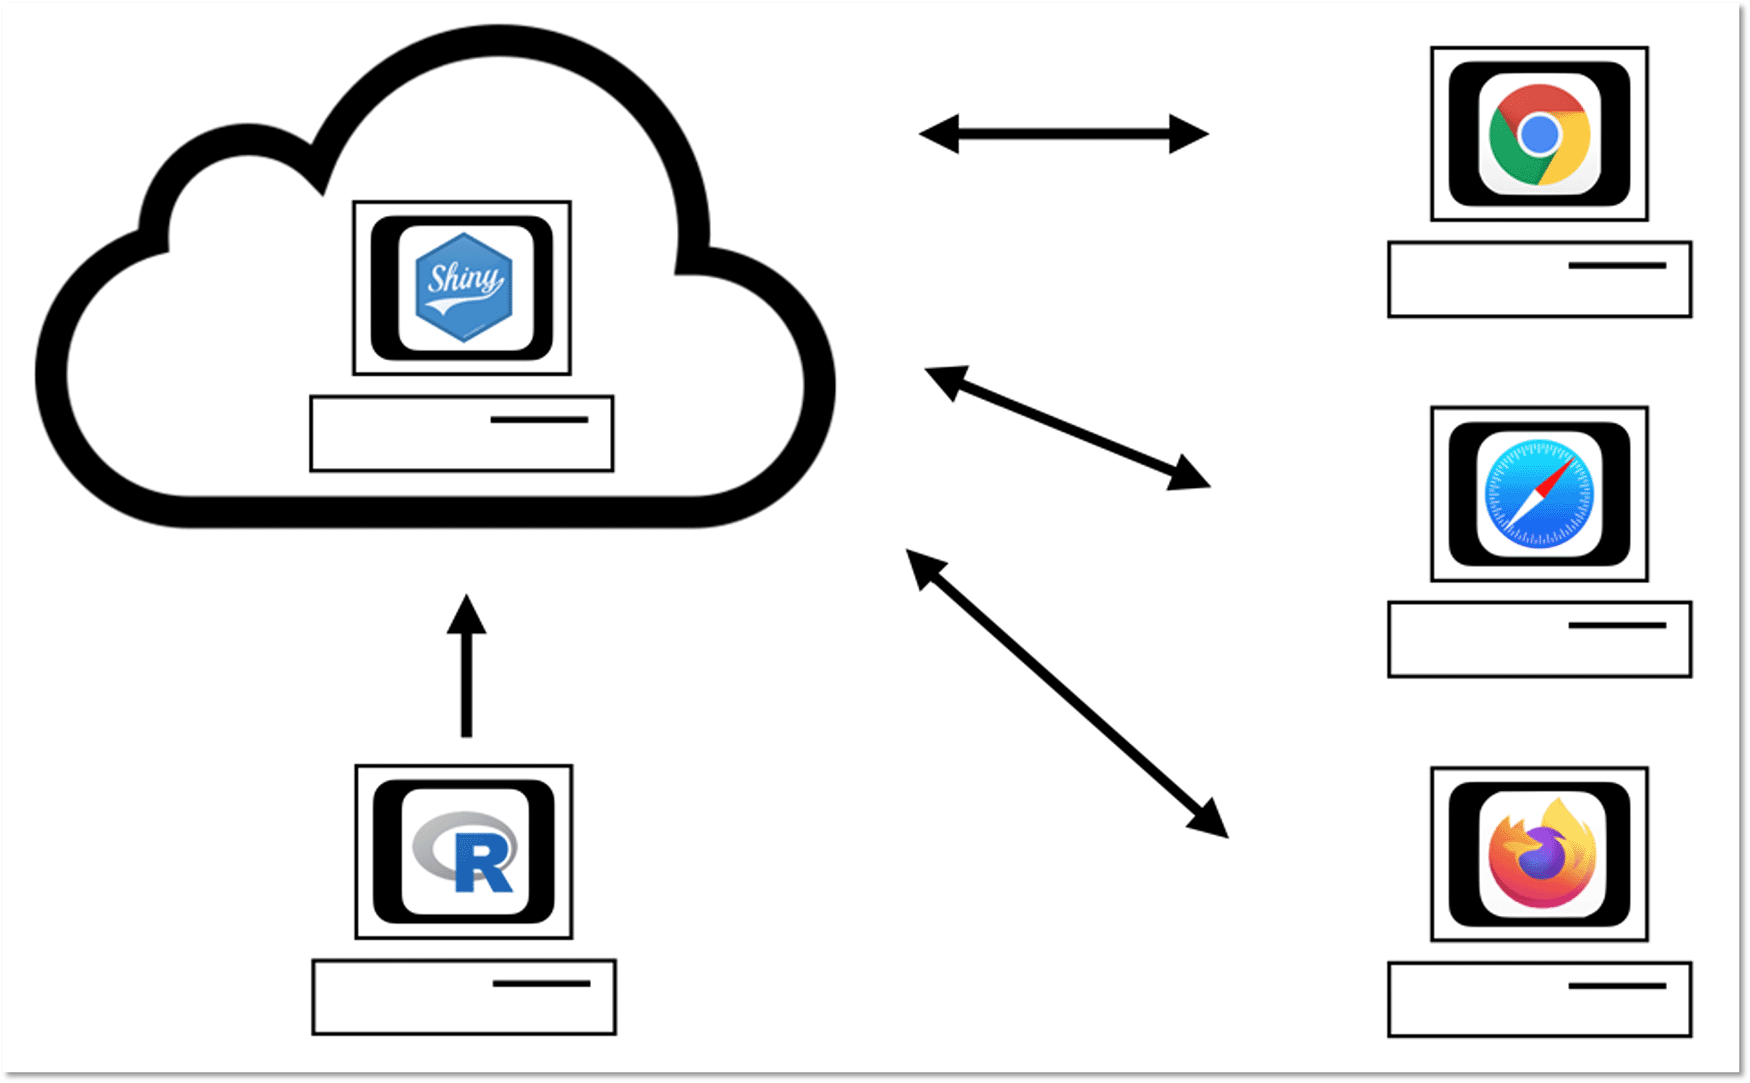
R software was used to code the online tools, which were then uploaded to the ShinyApp cloud service. Any student provided the appropriate link to use with a HTML capable web browser (e.g., Chrome, Firefox, or Safari) could access and interact with the online tools hosted on the ShinyApp cloud servers.
Since its development, ShinyApps have been widely used, and have developed their own server hosting service enabling any member of the public to create an account, write code, and make it available for a large audience.14 Links to the ShinyApp webtool pages were displayed to students via the Quinnipiac University Blackboard® ™ page. Blackboard® ™ is a learning management system that allows online availability of electronic curricula as well as a host of analytic tools to enable tracking of web-link access.
Webpage creation
Using principles of instructional design and constructivism,15 a minimalist design approach was selected to create the interactive tool webtool pages. They had a simple title followed by simple graphics that displayed the biostatistical equations being explored (e.g., sensitivity) as well as a simple two-by-two table indicating relevant inputs. Graphics were screen captures from the regular FNHSOM biostatistics curriculum to signal continuity and cue students to the familiar content.
The second element of each webtool page was a set of instructions guiding students through the manipulation of input variables. These instructions directed attention to particular relationships. Questions were designed for students to quickly interact with the biostatistical equations in a way that encourages students to create predictions in a rapid estimate-based style and quickly check their results with the interactive tools for immediate feedback (Figure 2). Questions were written as plain text and placed in code that auto-formats based on the width of the users’ web-browser. An example of such a question is as follows
The third component of the webtool page was the interactive input bar, reactive two-by-two table, and refreshing calculated output values. Slider controls (Figure 3) were chosen for numerical inputs as they may add to the user’s concept of input magnitude. We created an additional feedback mechanism for the user by adding the movement and visualization of sliding numerical input because numerical literacy in the general population is a long-standing challenge and even those with substantial education experience difficulty interacting with, analyzing, and correctly interpreting straightforward numeracy questions.16,17 All slider inputs go directly into equations for the desired statistical parameter (i.e., a/a+b). Slider range was set to start at 1 to avoid confusing divide by zero situations, and preset to begin at the same value so that test values began at a neutral outcome.
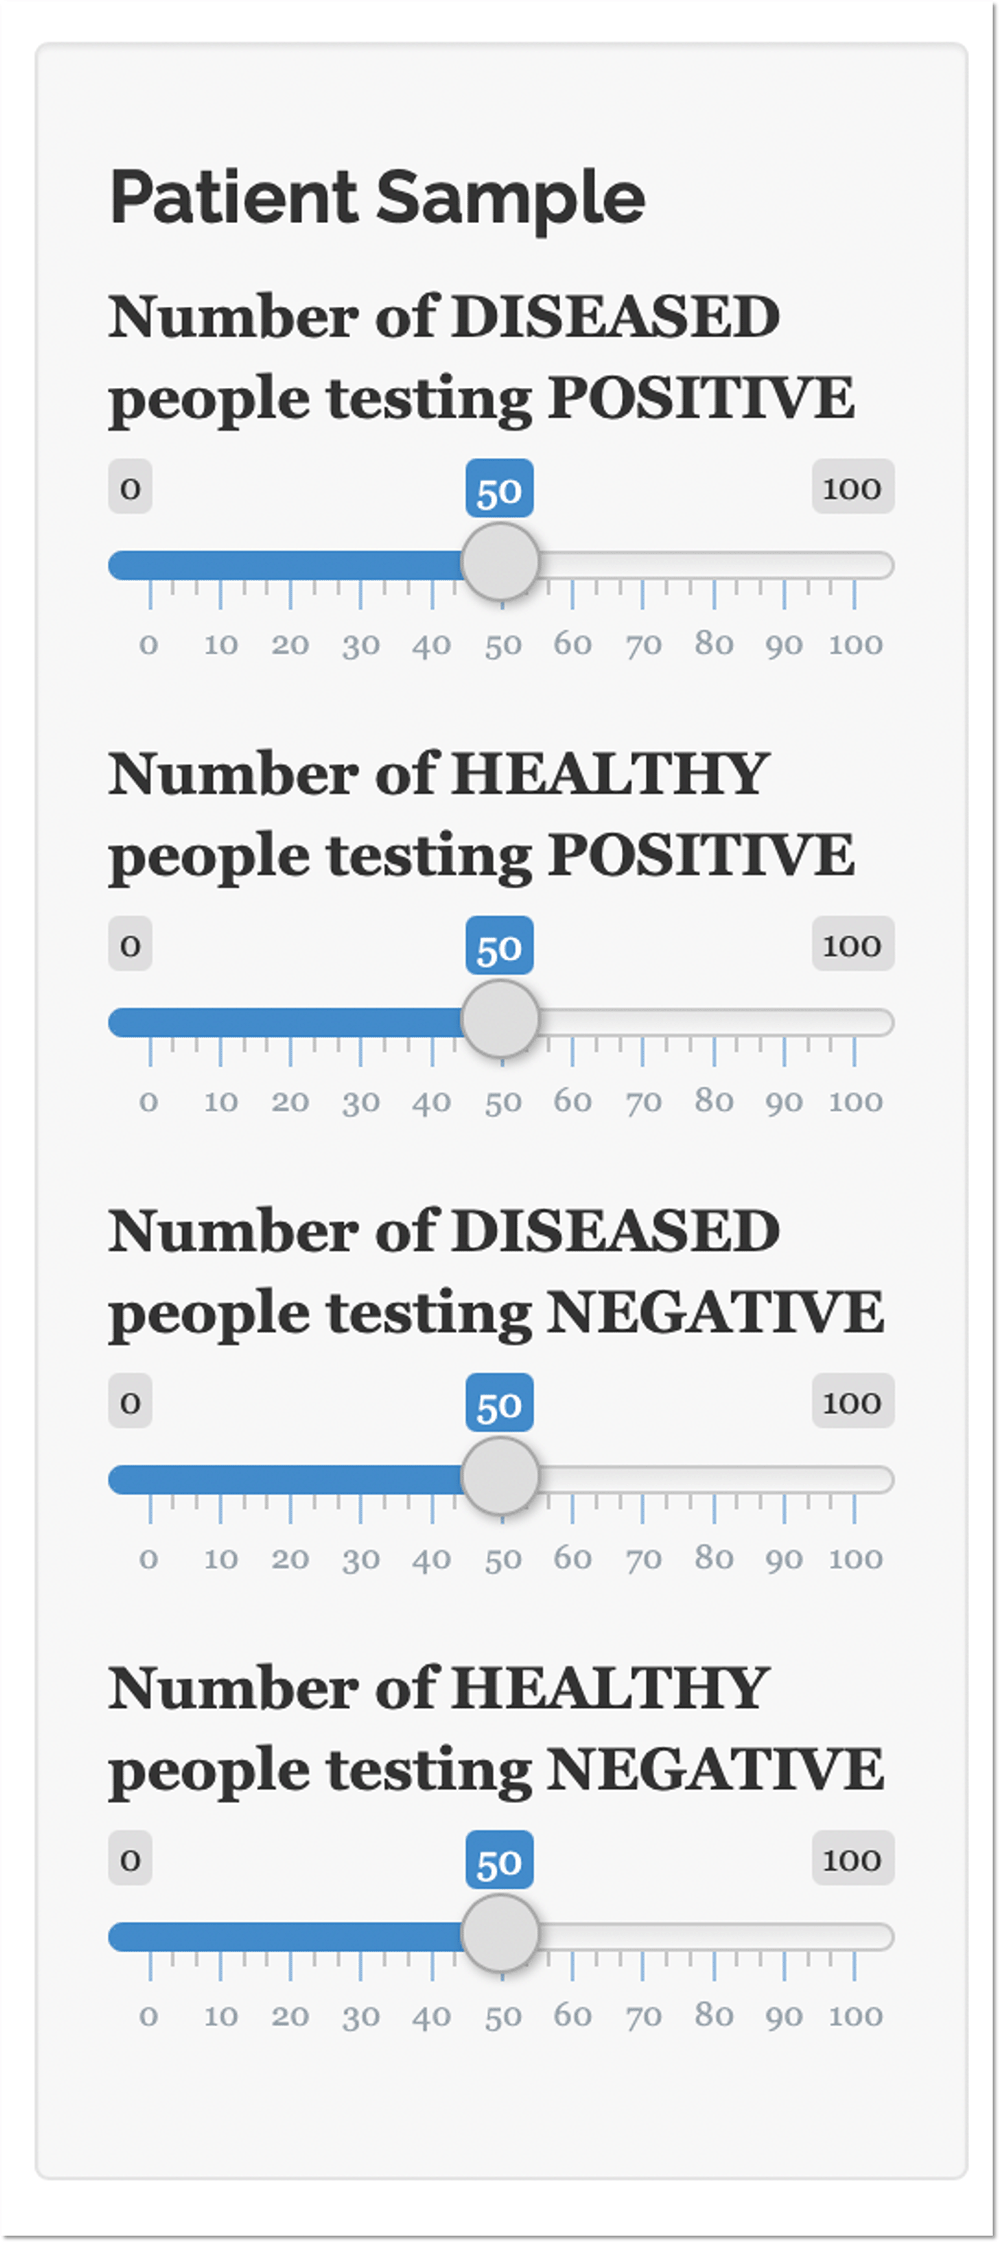
Note: sliders are in their default position.
The interactive two-by-two table (Figure 4) was created to show user inputs and aide understanding. Additionally, a <color_bar> function was added to represent the magnitude of inputs. Output values were simple reactive outputs <renderText> of inputs within the studied equation, rounded to 2 digits to minimize computational overload.
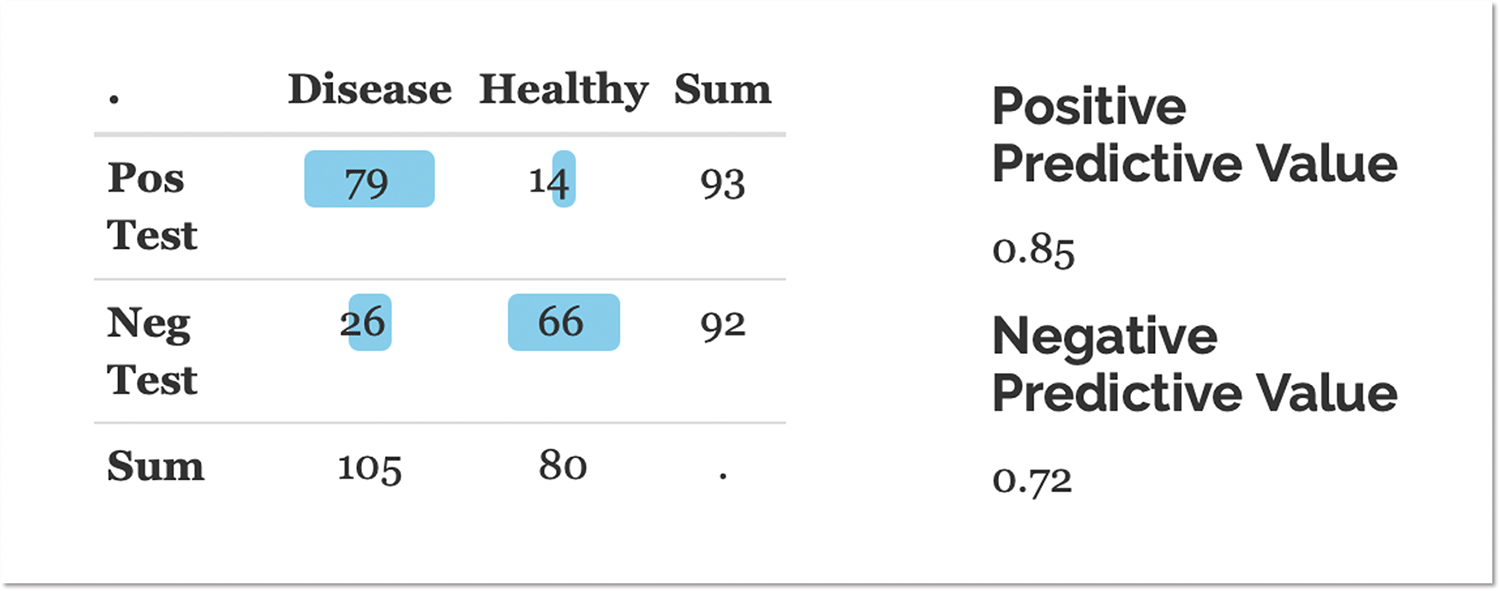
Note: the table is not showing default values to demonstrate the scaling color bars placed behind each input value.
To promote learner progress from the ‘Understanding’ to ‘Applying’ and ‘Analyzing’ levels of Bloom’s cognitive taxonomy,18 the next portion of the webtool page was designed to allow translation of theoretical concepts to a scenario likely encountered by a first-year medical student (i.e., a peer-reviewed journal article from the PubMed® database, which contains 32 million searchable citations of biomedical literature).19 To do this, PubMed® was searched and article abstracts retrieved that presented relevant biostats concepts complete with reporting sample numbers and calculated results. These abstracts were presented as “Practice in Context” screen captures (Figure 5) within the webpage so as to be as realistic of an encounter as possible. A short set of questions pertaining to the displayed abstract tested the major concepts explored in the previous portion of the webtool page, with a similar style of estimate-based calculation. Some questions encouraged students to use the slider and reactive outputs as a simple calculator to check their work while tying applied scenarios back to basic concepts. Answers with a brief stepwise explanation were provided below for users to check their work and receive immediate feedback (Figure 6).
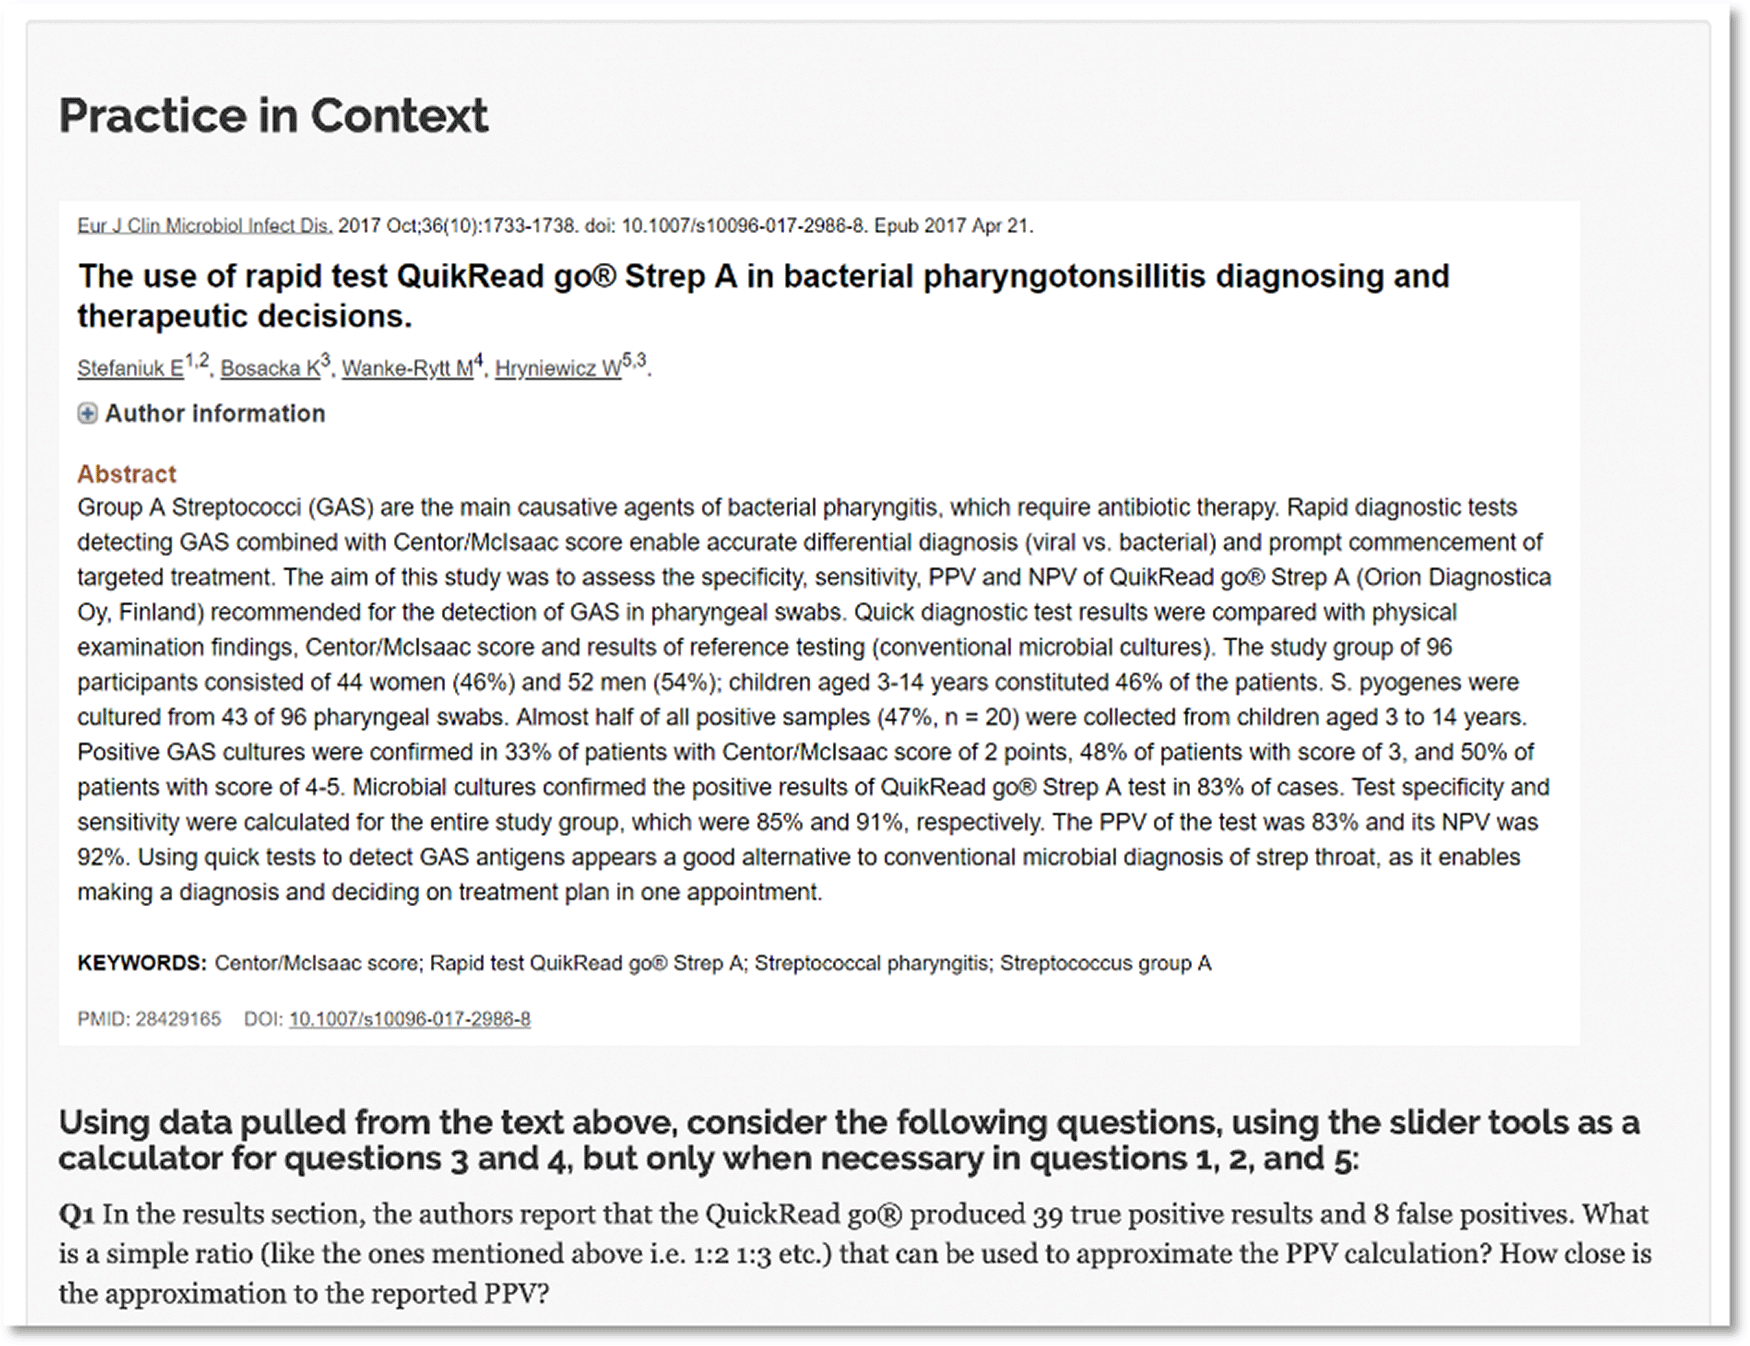
Note: the complete screen capture of the abstract as displayed in PubMed®. Directly below the abstract image are the section instructions and a single practice question.
The quantitative data collected consisted of online interactive webtool access metrics (i.e., the number of distinct visits to the relevant webpage by a participant), summative exam scores, and scores for a self-reported prior knowledge survey. An 11-question survey designed to query student prior knowledge of biostatistics used in medical decision-making was collected via Blackboard® before any in-person teaching or access to the online interactive webtools was granted (a copy is provided as Extended data24). Webtool usage data was collected from Blackboard® through individual link clicks. Additional usage trends were observed from charts of server usage provided to the Shiny App administrator account used to host the online webtools. The summative assessment of students’ biostatistical knowledge occurred at the end of the month-long learning period. This exam consisted of 10 single-best answer multiple-choice questions, which were constructed to assess students’ competence of biostatistics used in medical decision-making, including definitions, calculation, and interpretation.
The quantitative data was imported to s for analysis and descriptive statistics (e.g., mean, standard deviation) calculated. A two-sample independent Student’s t-test was used to compare the access metrics between the Before and After cohorts. One-Way ANOVA with Tukey’s HSD post hoc test was used to make pairwise comparisons of summative exam performance and prior knowledge scores between the three Before, After, and No Access cohorts. Analyses were conducted in SPSS v26 (IBM SPSS Statistics, Armonk, NY, USA) and the alpha level for statistical significance was set at 0.05.
SH facilitated the focus group sessions. De-identified audio recordings were transcribed manually then analyzed using an inductive, constant comparison approach.20 Major concepts were organized iteratively and stated as themes.
This study was conducted according to the guidelines of the Declaration of Helsinki and approved by the Human Experimentation Committee/Institutional Review Board of Quinnipiac University (#08919; 22 August 2019). Written informed consent to participate was obtained from the participants, including consent to publish audio recordings of the focus groups.
Prior knowledge survey
The mean (± standard deviation) prior knowledge survey scores out of 110 points for the Before, After, and No Access cohorts were 53.8 (± 20.9), 53.6 (± 23.3), and 51.7 (± 22.1) points respectively (Figure 7). These scores were not significantly different from one another (p = 0.91; One-Way ANOVA) indicating that none of the three cohorts were different at the onset of the study. The range of the prior knowledge scores was 1 – 84 points. The median value was 55.5 points.
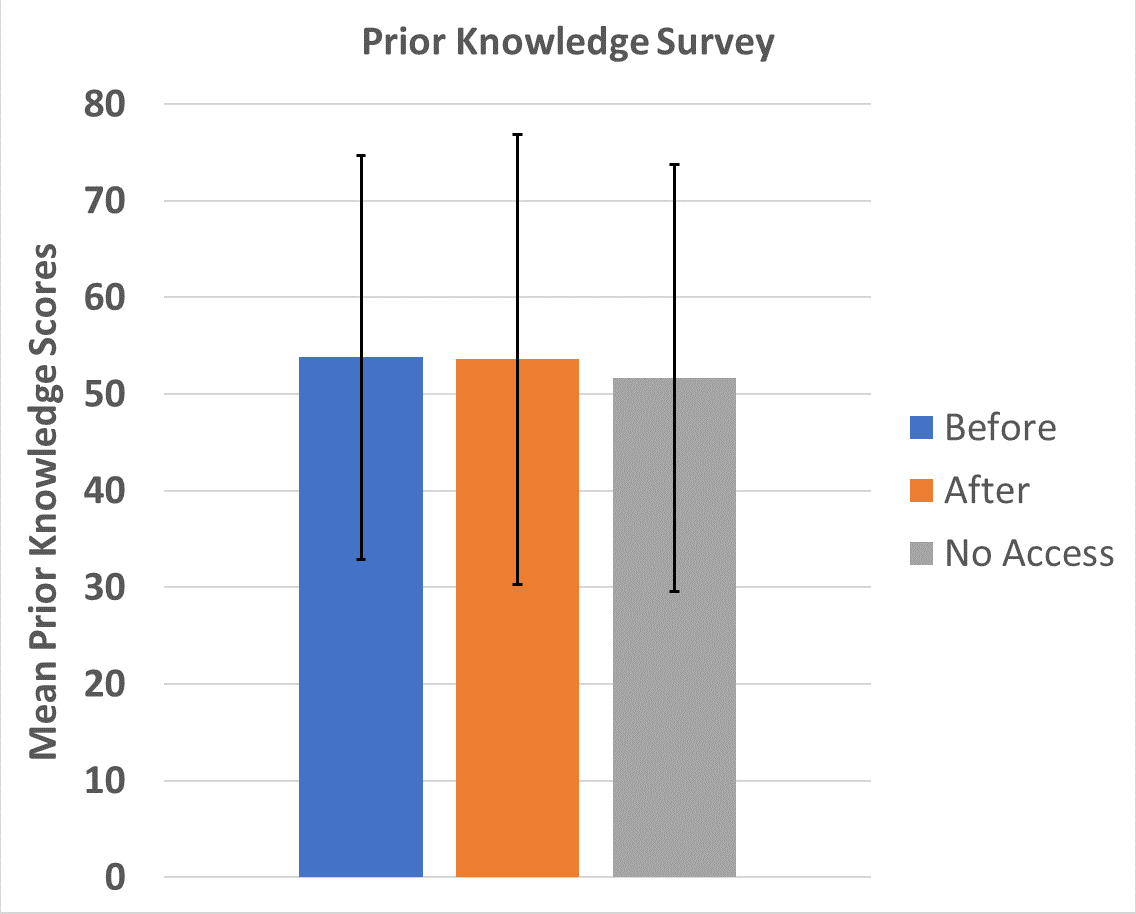
These scores were not significantly different from one another (p = 0.91; One-Way ANOVA).
Summative exam scores
The mean (± standard deviation) summative exam scores as percentages for the Before, After, and No Access cohorts were 87.5% (± 10.8%), 90.7% (± 11.2%), and 88.9% (± 12.9%) respectively (Figure 8). These scores were not significantly different from one another (p = 0.49; One-Way ANOVA) indicating that none of the three cohorts were different at the onset of the study.
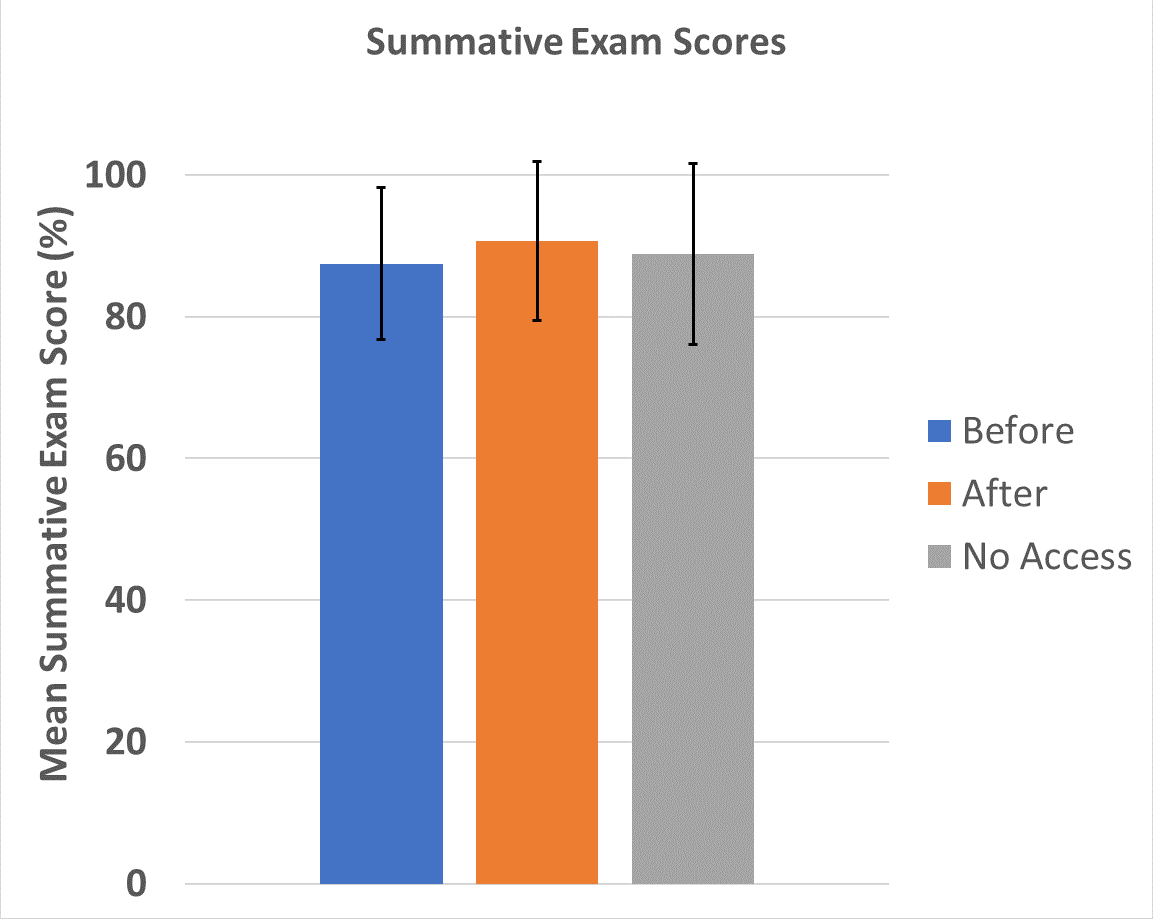
These scores were not significantly different from one another (p = 0.49; One-Way ANOVA).
Access metrics
The mean (± standard deviation) number of distinct visits per participant over the 5-week study period for the Before and After cohorts were 4.3 (± 2.6) and 2.6 (± 1.5) visits respectively (Figure 9). These scores were significantly different from one another (p = 0.003; independent t-test) indicating that the Before group chose to engage with the online interactive webtools more often than the After group. The range of the number of distinct visits per participant was 0 – 10 visits for the Before group, and 0 – 6 visits for the After group.
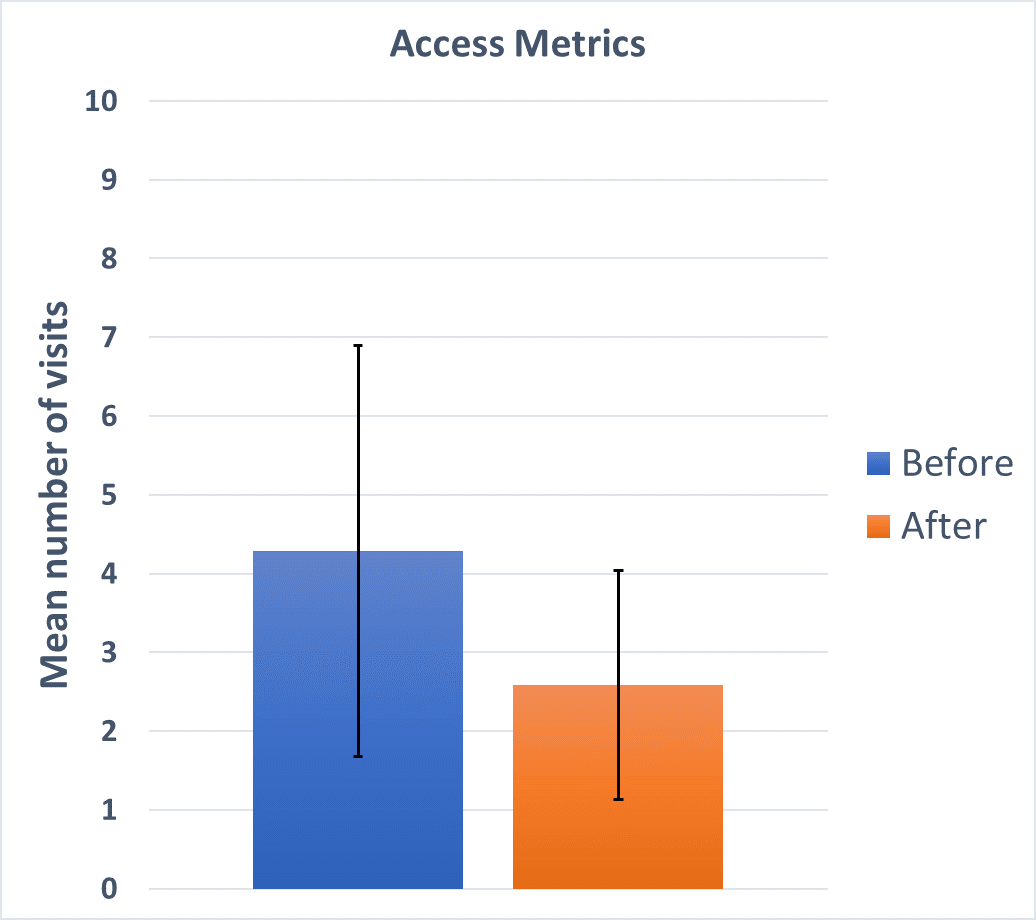
These scores were significantly different from one another (p = 0.003; independent t-test).
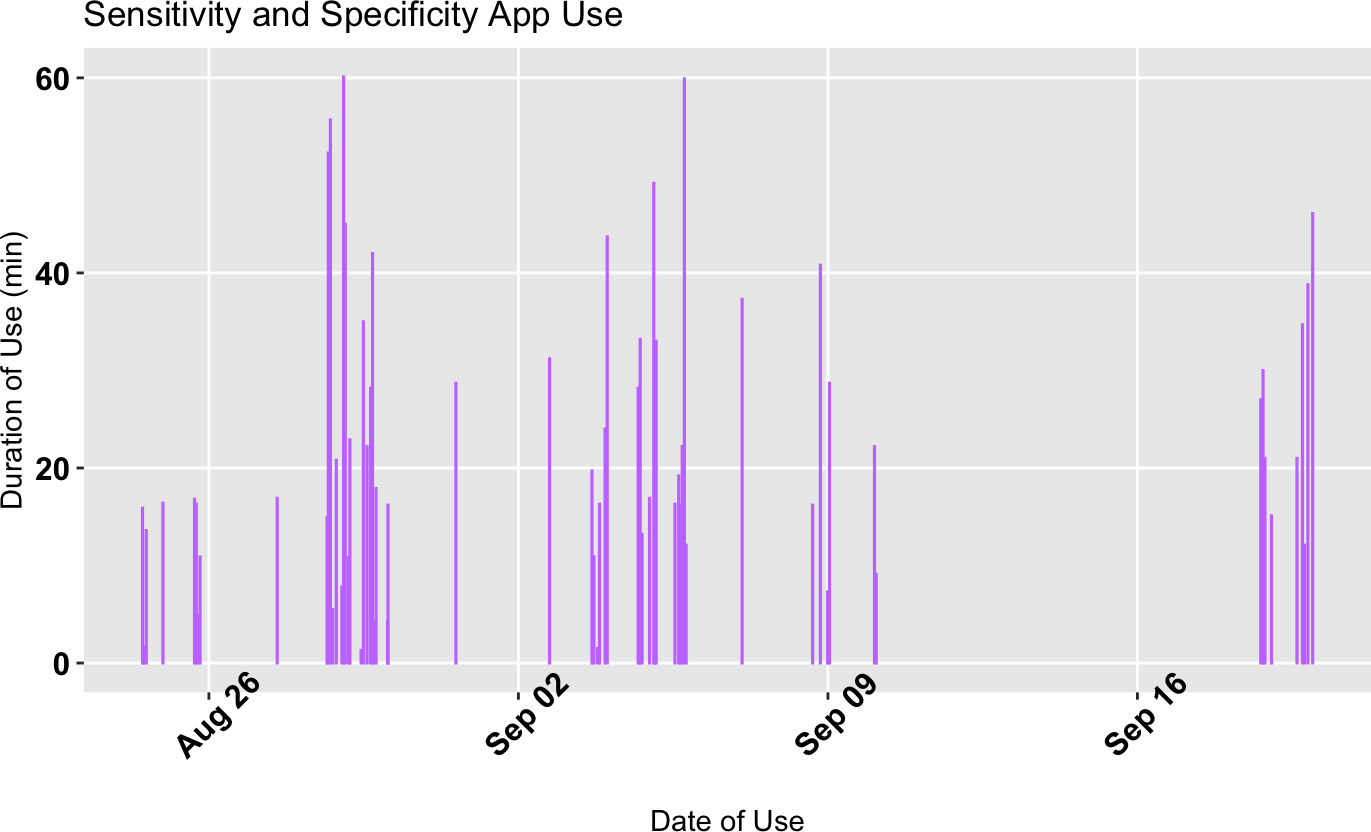
Server usage data available to the Shiny App administrator account showed a bimodal distribution over time, with the majority of student using the apps around the time during which the regular in-person ‘biostatistics used in medical decision-making’ was taught to the Class of 2023 (Figures 10 and 11). There was also a large spike in activity during the few days before the summative exam. These major groups of activity were separated by approximately a week during which there was zero activity.
Focus group discussion
Comparatively, about 75% of the focus group participants stated that they had opened the links provided to the online interactive webtools. In total, 50% said they used at least some portion of the webtools, while 25% reported engaging with and completing all interactive components of the webtools multiple times. A majority of students reported using the webtools for only one specific component. Some stated that they found the interactive calculators and tutorial most useful, while others found the practice-in-context element most useful. It was not uncommon for students to only use one and not the other.
Two themes from the focus group discussion emerged: facilitation of learning and time efficiency. Illustrative quotes are identified by the anonymous letter identifies assigned to each participant.
Theme 1 - Facilitation of learning
There was substantial agreement among the participants that the webtools enabled them to take more control of their learning processes to improve their comprehension and application of the biostatistical content.
A: “Once I hit a spot where I pause and I don’t understand, that’s when I used them [the webtools] for something extra to supplement my studying, something extra to help me understand.”
H: “I used the [webtools] as a way of tuning up for the exam. I wanted to make sure I was a bit more concrete and so it was nice to have something to walk through and play around with and get an actual feel for what that stuff looked like.”
C: “I was looking at the [regular curriculum teaching] slides and felt that they were a lot of definition and not numbers, so I used your [webtools] to play around with numbers and get an understanding of how sensitivity works.”
E: “I kinda struggled to understand some of the concepts or what we wanted to know about each concept from the [regular curriculum teaching] videos, so I used [the webtools] to play around and see how it would change without having to do each individual calculation.”
H: “What I thought was nice about the [webtools] is that you were able to … um … directly change the numbers and see what effect that that had on the calculations without actually having to do all the calculations. So it saved a lot of leg work but you still got the big picture idea. Even though working out methodically can be helpful, it was nice to just see the trends.”
F: “I think I kinda use [the webtools] in conjunction with the [regular curriculum teaching] that we had and there are some examples with real studies and I kinda used that with the [the webtools] like “oh what would happen if I increased the number of people in this.”
Theme 2 - Time efficiency
There was also substantial consensus that the webtools helped the time investment needed to learn or set an appropriate learning pace.
D: “I like that I could have more control … like for me, the slow parts of traditional lectures are too slow for me, and the fast parts are too fast. [With the webtools] I have the ability to control the pace at which I go … allows me to be more effective and efficient.”
A: “I think that I would have been able to get to apply [my knowledge of the biostatistics] by spending a longer time with the lectures and rereading them, but I think that the [webtools] helped me get there faster than I would have. It was more efficient for me.”
D: “I would agree … that it kind of sped up the getting to applying and being able to broadly conceptualize it.”
D: “I would say that playing with the [webtools] did help me to get to apply faster.”
F: “I definitely would be more confident … just because I didn’t really understand the concepts behind the equations until I use [the webtools] so now I feel like I could explain this to my family if they were gonna get a test done that had those parameters.”
This pragmatic trial study was designed to explore the use of interactive web-based resources to alleviate some of the challenges associated with teaching first-year medical students biostatistics such as a lack of time, motivation, and cognitive scaffolding. To accomplish this goal, constructivism was used as a conceptual framework to design interactive the webtools. Constructivism is a theory of learning that says, “people construct their own understanding and knowledge of the world, through experiencing things and reflecting on those experiences”.15 Put succinctly, it posits that learning is an active process whereby knowledge is constructed through appropriately contextualized experiences rather than mere transmission of information from teachers to learners. The webtools sought to have learners 1) build conceptual representations by connecting new information to existing knowledge, 2) interact with primary sources of biostatistical data, and 3) begin with whole concepts then explore component parts.21,22 The webtools were provided to the students for use alongside the regular biostatistics teaching curriculum at FHNSOM in two temporally spaced groups. Access metrics, summative exam scores, and qualitative focus group data was collected and analyzed. Our findings support our initial hypotheses that medical student users would interact with the webtools and deem them useful, that the constructivism-informed design would facilitate the conceptual understanding of learners, and that there would be no detrimental impact of using the webtools on biostatistical exam scores.
There was no significant difference in summative exam scores or self-reported prior knowledge between the three study cohorts. These data, along with the interest expressed by the focus group participants and the repeated access metrics, indicate that this new resource could be added alongside existing biostatistics curricula without detrimental effects to learning. Results of access metrics data showed an elevated level of participation from those who chose to access the webtools with an average of 5 clicks per student. This indicated that many students found the webtool content valuable enough to return to after an initial experience. Furthermore, a temporal view of server data showed a significant spike of usage prior to the summative exam date suggesting that students returned to the webtools as a study resource during a high-pressure time period. Additional server data indicated that most webtool interactions were sessions less than 30 minutes in duration, suggesting that students were able to quickly visit the webtools to get what they needed rather than using them for long, unbroken sessions. This may be especially valuable to medical school students who are routinely trying to determine and make choices around what they will focus on learning in a time-scarce environment.
Focus group discussion indicated a positive response to the constructivist design choices with students reporting that they allowed efficient use and increased students ability to experiment. Similarly, students endorsed the webtools’ part in allowing them to explain statistical concepts to others (e.g., friends or family members). Interestingly, one focus group argued against the constructivist design reporting that a more directed process would have been appreciated. This may reflect some learners’ preferences for passive versus active learning.23 The multi-component design and its associated flexibility of the online webtools was prominent in focus group discussion; a large portion of students revealed that they only used select portions of each webtool depending on their perceived personal learning deficits. Students often used the webtools as a way to test the knowledge and comprehension they had built and validate their conceptual understandings; our participants valued a setting where they may quickly experiment with concepts and receive immediate feedback – which is consistent with constructivism.
While we cannot claim that students had any increased learning motivation, it should be noted that once the webtools were created and made available to the Before and After cohorts, there was no additional reminder or external pressure to use them. No instructor time was required for their use; therefore, they may be cost effective resources regardless of how many students are motivated to use them. There was consensus in focus groups that given the low resources necessary to keep the webtools running they should be made available to future students to broaden their learning options.
Access data indicated that students mostly used the webtools during the weeks concurrent with the regular in-class curriculum at FHNSOM. This suggests that students may have desired additional or different types of resources during their active knowledge construction processes. This bore out in focus group discussions when participants mentioned regularly looking for a multitude of resources to be used at their discretion during periods of intensive academic focus.
In focus groups, some Before cohort students mentioned accessing the webtools to “pre-study” the material. They generally reported finding the webtools alone without introduction or explanation (provided by the regular biostatistics curriculum) confusing and counterproductive. Further, students who found the modules confusing reported abandoning them altogether or stopped using the webtools until a later date.
Most curricula for biostatistics follow some variation of the following steps: 1) knowledge acquisition via text or lecture format, 2) knowledge application via problem sets or other use-case based tasks, and 3) testing to assess learner competency. This sequence moves students along Bloom’s cognitive taxonomy from remembering > understanding > application > analysis.18 Due to the constraints of synchronous teaching modalities like timing of lectures or physical presence in student discussion groups, traditional methods offer limited opportunities for the learner to move up and down Bloom’s taxonomy as they might see fit and at their own pace. Through the use of R software and Shiny we created webtools for producing interactive, web-ready data visualizations and practicing learning in context. These resources were valued by learners for facilitating student-paced learning in a time efficient manner and may represent a pragmatic approach to supplementing existing medical school teaching strategies for biostatistics and learners’ abilities to curate their own learning experience.
Zenodo: A Pragmatic Trial of Interactive Online Statistical Webtools for Teaching Biostatistics to First Year Medical Students: A Constructivism-Informed Approach. https://doi.org/10.5281/zenodo.5092290.24
This project contains the following underlying data:
• Steven Hardy F1000 Data (Quantitative data).xlsx (access metrics, summative exam scores, prior knowledge survey scores).
• Focus Group 1 09-30 Participants A-E.m4a (focus group 1 audio recording).
• Focus Group 2 09-30 Participants F-H.m4a (focus group 2 audio recording).
• Focus Group 3 10-01 Participants I-N.m4a (focus group 3 audio recording).
• Focus Group 4 10-02 Participants O-R.m4a (focus group 4 audio recording).
• Focus Group 1 participants A-E.docx (focus group 1 transcript).
• Focus Group 2 F-H.docx (focus group 2 transcript).
• Focus Group 3 I-N.docx (focus group 3 transcript).
• Focus Group 4 O-R.docx (focus group 4 transcript).
Zenodo: A Pragmatic Trial of Interactive Online Statistical Webtools for Teaching Biostatistics to First Year Medical Students: A Constructivism-Informed Approach. https://doi.org/10.5281/zenodo.5092290.24
This project contains the following extended data:
• Prior Knowledge of Biostatistics Used in Medical Decision.docx (a blank copy of the self-reported ‘prior knowledge of biostatistics used in medical decision-making’ survey)
Data are available under the terms of the Creative Commons Attribution 4.0 International license (CC-BY 4.0).
| Views | Downloads | |
|---|---|---|
| F1000Research | - | - |
|
PubMed Central
Data from PMC are received and updated monthly.
|
- | - |
Is the work clearly and accurately presented and does it cite the current literature?
Yes
Is the study design appropriate and is the work technically sound?
Partly
Are sufficient details of methods and analysis provided to allow replication by others?
Partly
If applicable, is the statistical analysis and its interpretation appropriate?
Partly
Are all the source data underlying the results available to ensure full reproducibility?
Partly
Are the conclusions drawn adequately supported by the results?
Yes
Competing Interests: No competing interests were disclosed.
Reviewer Expertise: Biostatistics, epidemiology, teaching medical statistics at undergraduate and postgraduate level, curriculum development
Is the work clearly and accurately presented and does it cite the current literature?
Yes
Is the study design appropriate and is the work technically sound?
Yes
Are sufficient details of methods and analysis provided to allow replication by others?
Yes
If applicable, is the statistical analysis and its interpretation appropriate?
Yes
Are all the source data underlying the results available to ensure full reproducibility?
Yes
Are the conclusions drawn adequately supported by the results?
Yes
Competing Interests: No competing interests were disclosed.
Reviewer Expertise: I am a psychologist with 25 years experience in human factors redesign and clinical education
Alongside their report, reviewers assign a status to the article:
| Invited Reviewers | ||
|---|---|---|
| 1 | 2 | |
|
Version 1 16 Aug 21 |
read | read |
Provide sufficient details of any financial or non-financial competing interests to enable users to assess whether your comments might lead a reasonable person to question your impartiality. Consider the following examples, but note that this is not an exhaustive list:
Sign up for content alerts and receive a weekly or monthly email with all newly published articles
Already registered? Sign in
The email address should be the one you originally registered with F1000.
You registered with F1000 via Google, so we cannot reset your password.
To sign in, please click here.
If you still need help with your Google account password, please click here.
You registered with F1000 via Facebook, so we cannot reset your password.
To sign in, please click here.
If you still need help with your Facebook account password, please click here.
If your email address is registered with us, we will email you instructions to reset your password.
If you think you should have received this email but it has not arrived, please check your spam filters and/or contact for further assistance.
Comments on this article Comments (0)