Keywords
Personalized psychotherapy, precision medicine, Bayesian statistics
Personalized psychotherapy, precision medicine, Bayesian statistics
Over the past half century, psychotherapy research has made great efforts to establish psychotherapy as an effective method. For anxiety and depressive disorders, clinical studies found short-term effects comparable to psychopharmacological treatment.1,2 A recent meta-analysis indicates that psychotherapy is superior to pharmacotherapy as an initial treatment choice.3 However, the average effect sizes decrease when adjusting for various sources of bias. In the case of psychological treatments for depression,4 reported that an average effect of Hedges g = 0.70 decreased to g = 0.31 after removing biased studies and correcting for publication bias. A separate analysis of the same data after removing self-help interventions led to a slightly larger effect of g = 0.43.5 It is estimated that 59% of patients respond to psychotherapy for depression6 and from 35 to 50% in anxiety disorders.7 Additionally, 5% of patients deteriorate,6 which often remains undetected by clinicians.8,9 Finally, an umbrella review of all the available meta-analyses on psychotherapy outcome studies10 concludes that “the effect sizes of psychotherapies and pharmacotherapies for mental disorders are limited, suggesting a ceiling effect for treatment research as presently conducted”.
The previously discussed results warrant a paradigm shift that is necessary in to show that the outcomes of psychotherapy can be improved. Several meta-analyses have determined the average treatment effect of psychotherapy. Based on these average treatment effects, guidelines11,12 might provide clinicians with useful information on the selection of a general treatment strategy for a given diagnosis. However, treatment effects of psychotherapy are heterogenous13 and individuals differ in their response to the available options. Thus, the development of methods to answer the question of which of the available treatment options will show the greatest effect in an individual is an important step toward improved outcomes.
As Cohen et al.14 summarize, personalization can be achieved by several strategies that vary in their level of structure. The least structured, but probably most common approach is idiosyncratic (or “clinical”15) decision-making. Here, therapists base their decisions about treatment on experience, intuition and personal judgment. Clinicians, including psychotherapists, acknowledge the complexity of mental disorders that goes beyond diagnostic categories and, thus, rarely base their treatment plan on a diagnosis alone.16 Thus, idiosyncratic decision-making often is the only option. The possible sources of bias in this mode of decision making have been discussed for decades.17 A more structured approach to decision-making is the usage of statistical models for predicting outcomes of interest. Compared to its clinical counterpart, statistical decision-making has several advantages in terms of accuracy,18 transparency and reproducibility.14 Research on personalized psychotherapy makes it its mission to find out whether it is possible to determine the best treatment alternative for each patient.19
At the level of selecting different treatment packages (such as cognitive behavioral therapy, psychodynamic therapy, or antidepressant medication), various statistical algorithms have been developed in recent years.20–23 While many of their results are promising, the treatment package selection approach has limitations. A review by Lorenzo-Luaces et al.24 concluded that sample sizes of the development studies were too small and few of these algorithms have been validated in independent studies. Addressing these methodological issues would mean conducting even larger studies of the effects of different therapeutic techniques that include the largest possible number of robust predictors of treatment success.
For the individual practitioner, even well-validated treatment package selection algorithms are often of little importance. Most clinicians are only trained in some of the treatment packages. In clinical practice, it is not so much a matter of selecting treatment packages, but rather of selecting the available components within a given treatment method so that they are most appropriate for the individual case. In cognitive-behavioral therapy, for example, methods of structured case formulation, like the SORKC25 model, are used for treatment planning. While these methods are based on retrospective data, statistical approaches to validate case formulations by collecting individualized questionnaires on a daily basis have been proposed.26 In this approach, the results of statistical models can be used for treatment planning. For example, if a regression model shows that a patient’s level of avoidance predicts subsequent anxious cognition, interventions that reduce avoidance could be expected to reduce anxious cognitions as well, without targeting them specifically. Algorithms for selecting treatment components based on this basic rationale have only been developed recently.27 Instead of evaluating data sets with as many patients as possible to identify subgroups that respond to different treatment packages, they collect and statistically analyze as much data as possible from the individual case. Mostly, these are data from short questionnaires collected several times a day via Ecological Momentary Assessment (EMA). The widespread use of smartphones makes such data easy to collect. In the algorithm proposed by Fisher and Boswell and described in detail by Fernandez et al.,28,29 a dynamic factor model is used to determine which items from a smartphone survey have the greatest explanatory power for an individual’s disorder. Similarly, Rubel et al.30 used person-specific dynamic network models for determining symptom priority. The most relevant items are then prioritized in a subsequent treatment plan.
Just like its nomothetic counterpart, the person-specific module selection approach to personalization has some methodological pitfalls. The most pressing one has recently been described by Bastiaansen et al.31 In this study, several independent research teams analyzed the same EMA data set. It was found that every team used a different statistical approach and that there were no two teams that selected the same target symptoms. This shows the enormous influence of the choice of methods in person-specific data analysis.
In this article, I describe the development of the “Bayesian Statistical Individualization Compunt Algorithm” (BaSICA). This algorithm constitutes an extension and refinement of the treatment planning algorithm used in the DynAMO system.32 The development of BaSICA is intended to address two important weaknesses of previous treatment selection algorithms:
First, the foundational input of a treatment module selection algorithm is a set of interventions matched to a set of problems. In the previously discussed algorithms, this matching was done by a consensus procedure including a small number of clinicians and researchers. The use of a larger sample of expert ratings as a basis of intervention selection is intended to represent the diversity of possible clinical strategies.
Second, previous selection algorithms work by combining a set of statistical parameter estimates. If a parameter estimate is uncertain, so is the information conveyed on an individual’s disorder. By using Bayesian statistical methods, posterior distributions instead of point estimates for all parameters of interest can be evaluated. This way, a credible range for the importance of each symptom is estimated. This way, an algorithm can be trained that maps the uncertainty in module selection and leaves the decision to the therapist if the uncertainty is too great.
In the first part of this article, the different statistical steps of BaSICA are presented using a case study. In the second part, the results of the expert survey are presented, which forms the basis for the allocation of interventions based on the statistical model.
BaSICA is designed to determine the optimal treatment modules of the Unified Protocol for Transdiagnostic Treatment of Emotional Disorders (UP, Ref. 33) in their sequence and intensity so that the resulting treatment plan addresses an individual patient's core problems as efficiently as possible. The UP consists of six core treatment modules that are accompanied by two auxiliary modules. In addition to the therapist’s manual, a patient workbook containing text examples for the module content discussed in sessions, worksheets, and instructions for homework is available to patients. The modules are summarized in Table 1.
Prior to treatment, a smartphone application (PIEL Survey34) will be installed on patients’ phones. This application is programmed to collect data using a 22-item questionnaire ten times per day over 20 days. An internet connection is not required for this application. The collected data is stored on patient’s phones and can be transmitted via E-mail or using a USB cable.
The 22 items are summarized in Table 2. They consist of the symptoms of the Diagnostic and Statistical Manual of Mental Disorders, Fifth Edition criteria for Generalized Anxiety Disorder (GAD) and Major Depressive Disorder (MDD). Additionally, 11 items describing positive affect (positive, energetic, enthusiastic, and content), negative affect (angry and afraid), rumination (dwelled on the past), behavioral avoidance (avoided people, avoided activities), and reassurance seeking (sought reassurance) were included. Finally, an item was added that asked about the presence of states that led to a decision to seek psychotherapy. This is intended to capture the idiosyncratic content of a person’s disorder. With this item selection, we aimed for comparability with previous work on personalized treatment selection,29,35 in which similar scales were used. A rich, individual data set containing temporal information on the structure of an individual patient’s symptoms and behavior is obtained. This data set will be analyzed by the treatment planning algorithm that will be described in the next section.
The BaSICA algorithm analyzes the data obtained by the smartphone-based assessment in several steps. Bayesian statistical methods are used throughout the procedure, so all estimated parameters are obtained as probability distributions around the point estimate. For every patient, BaSICA will produce a treatment plan consisting of the order of modules as well as the number of sessions to be delivered per module. Below, the individual steps of the algorithm will be described using a case example.
The case presented is a 25-year-old female patient diagnosed with a generalized anxiety disorder who participated in a pilot study testing BaSICA. She completed 153 of the 200 possible EMA surveys before starting her treatment at the university outpatient clinic for psychotherapy at the University of Greifswald. Code to reproduce these results is provided.
Step 1: Sanity check and detrending. The data set is checked for completion. The patient needs to complete at least 120 of the 200 EMA assessments to be included in the study. If this is the case, missing values are imputed using a Kalman filter. After every last signal for a given day, empty rows are inserted. This prevents time-series models from regressing the next day’s values on values from the previous day, thus violating the condition of equally-spaced time series. All 22 items’ time series are tested for stationarity using the augmented Dickey-Fuller test. Items showing a linear trend are detrended. This is done to reduce the probability of observing spurious correlations between time series. Finally, items with zero variance are removed from the data set and not considered in the following steps.
Step 2: Determine the number of factors to extract. To determine the number of factors to extract in the subsequent factor analysis, a Bayesian parallel analysis (Levy et al., 2020)36 is conducted on the resulting data set. The result of this parallel analysis is a probability distribution for the number of factors to extract. According to the recommendations by Levy et al., a minimum posterior probability should be defined in advance to decide whether a factor solution is accepted or not. Thus, a 25% probability cut-off was chosen to determine whether to include a factor solution. If more than one plausible number of factors to extract is determined, the following steps would be repeated for all of these. The results would be weighted by the likelihood determined by the parallel analysis and then pooled. However, for the example patient, the parallel analysis suggested only a five-factor solution with a posterior probability of 100%.
Step 3: Preliminary factor model. Exploratory factor analysis is conducted. For the example patient, the loading matrix is shown in Table 3. The loading matrix patterns suggest a factor describing broad negative affect (F1), a factor describing avoidance (F2), a positive affect factor (F3), one factor suggesting anhedonia and lack of energy (F4), and a depressive withdrawal and rumination factor (F5). The five factors explained a total of 44% of the variance. The loading matrix is now converted to a matrix of binary values. Items with factor loadings above .30 are recoded as ‘1’, and items with all loadings below .30 are recoded as ‘0’. Only items with at least one ‘1’ are retained. The resulting matrix is converted to equations used in the next step.
Step 4: Structural equation model. Bayesian structural equation modeling is used to estimate factor loadings of the retained items. Posterior distributions of all loadings are saved. The algorithm will give a higher priority to items with higher factor loadings, as they have higher explanatory power for an individual’s disorder. Also, items belonging to factors that explain more variance in the model are given a higher priority. Parameter estimates from this step can be found in Table 3.
Step 5: Determine time-lagged associations of factor scores. Factor scores of the five estimated latent factors are saved from the structural equation model. A Bayesian vector-autoregressive model estimates time-lagged associations between factor scores. This way, it is estimated how strongly the extracted factors predict each other’s values over time. Items belonging to factors that are highly predictive of other factors’ future values are given a higher priority by the algorithm. This is done because the more predictive factors are assumed to be more strongly related to the underlying causes of the disorder. As depicted in Figure 1, the anhedonia factor was predictive of subsequent negative affect and lack of positive affect for the example patient. Thus, the priority of items belonging to this factor will be increased.
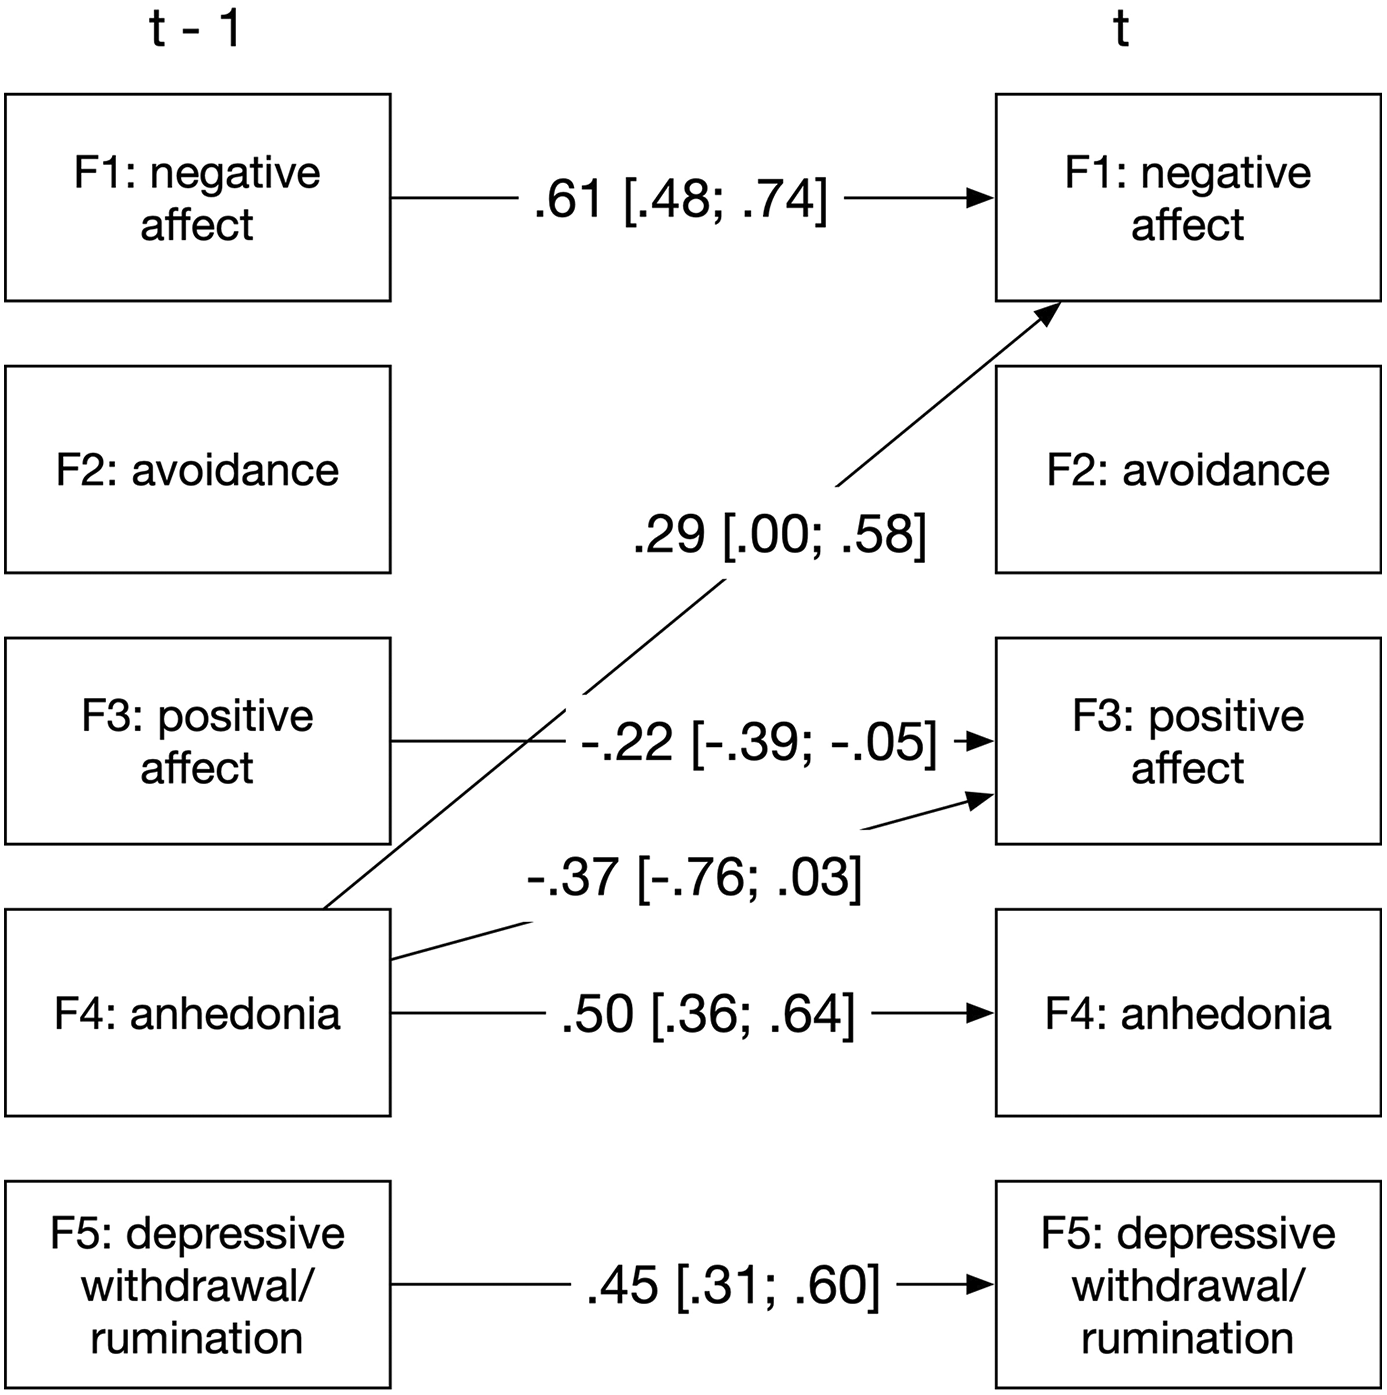
Coefficients with point estimates below .20 are omitted. Values in square brackets represent the 95% equal-tailed interval of the parameter estimate.
Step 6: Determine item-level predictors of idiosyncratic distress. A Bayesian logistic regression is conducted to predict the time-lagged value of the dichotomous item “Are you currently distressed because of the problem that made you undergo psychotherapy?”. Regularization is done by using “Horseshoe priors” (Carvalho et al., 2009) for all parameters except for the intercept. Through this procedure, only items that show strong evidence of preceding distress states related to the patient's problem are retained in the model. Regression parameters of items for which there is no convincing evidence in this regard are reduced to '0'. Items that are more predictive of problem-related distress are given higher priority by the algorithm. For the example patient, the following items were predictive of subsequent disorder-related distress: “Difficulty concentrating” (Regression coefficient: 0.73, 95% ETI: -.30; 2.83), “felt irritable” (0.59, 95% ETI: -.76; 3.56), “felt restless” (0.47, 95% ETI: -0.51; .2.26), “felt hopeless” (0.36, 95% ETI: -0.72; 2.33). One item was a negative predictor, reducing the probability of subsequent distress: “sought reassurance” (-.36; 95% ETI: -2.23; 0.65).
Step 7: Computation of priority scores. In this step, posterior distributions from the statistical models established in the previous steps are combined. First, a factor priority score is calculated by multiplying the sum of squared regression parameters from the VAR model with the percentage of variance explained by this factor. Next, the following parameters are incorporated into an item priority score:
- Item means – items with higher mean scores are prioritized,
- Sum of squared factor loadings multiplied with the factor priority score the items load on – items with a higher sum of squared loadings are prioritized and items loading on factors with higher factor priority scores are prioritized,
- Regression coefficient from the logistic regression model – items that are stronger predictors of subsequent disorder-related distress are prioritized.
Posterior distributions of these three information sources are averaged and rescaled to a value range of 0 to 1. The last column of Table 4 summarizes the item priority scores of the example patient.
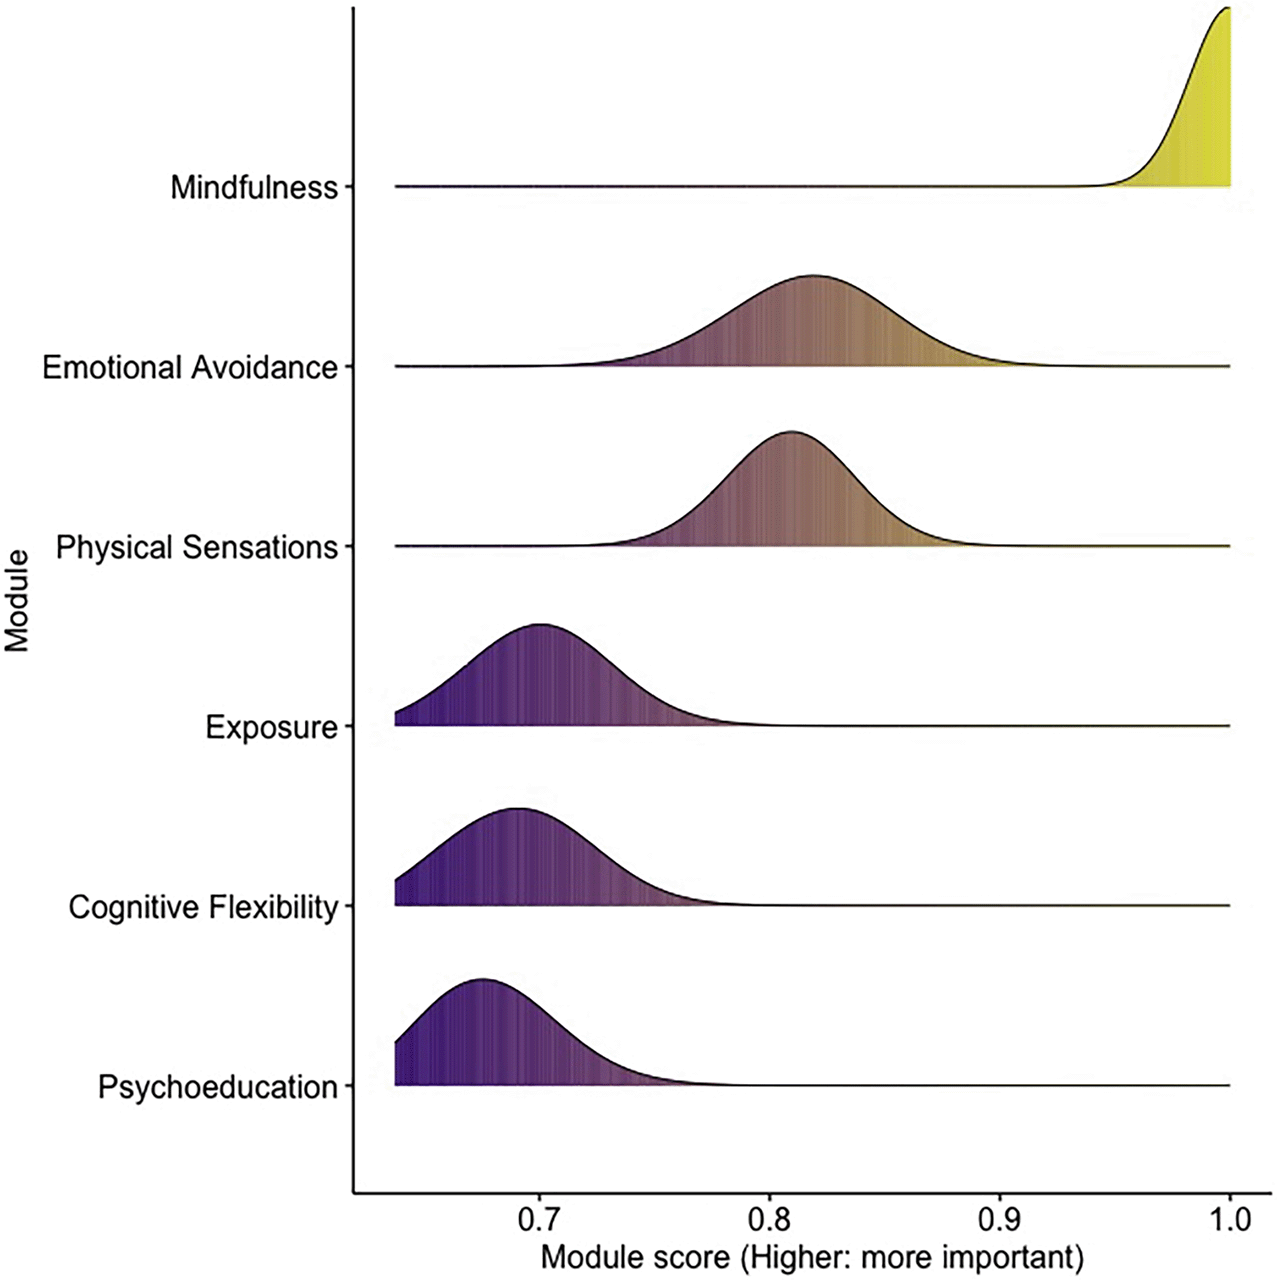
Step 8: Derivation of a treatment plan. The item priority scores are multiplied with an item-module matching matrix resulting from an expert survey including 90 cognitive-behavioral psychotherapists. This matrix matches Unified Protocol treatment modules to items included in the EMA survey based on their clinical experience and knowledge of empirically-supported cognitive-behavioral treatments. The matching matrix is shown in Table 4, along with the example patient’s module scores in the last row. Because the module scores are a result of combining posterior distributions from Bayesian statistical models, a credible value range can now be estimated for these module scores. As mentioned previously, this reflects the uncertainty of module priority and is now used to determine the order of delivery for the treatment modules. The overlap of module score distributions is calculated using a distribution-free approach.37 Module score distributions overlapping by at least 85% are treated as interchangeable. Figure 2 depicts the distributions of module scores for this case.
The raw module scores are normalized by dividing them by the maximum possible module score achievable. This way, module scores can range from 0 to 1, where a value of 1 is assigned to a module achieving the highest priority score possible in this algorithm. By multiplying the distributions of normalized module scores with the maximum number of sessions recommended in the Unified Protocol manual (see Table 1), a range of treatment sessions is obtained. For example, if UP module 4 (maximum number of sessions: 2) is assigned a normalized module score of 0.6, this would result in 1 session. The order of modules is determined by forming ranks of mean priority scores.
The basic idea of the treatment plan is to use data from the statistical model where there is robust evidence that modules need to be prioritized, while leaving the decision to the therapists where the results are less certain. This is realized in two places in the treatment plan. First, if two succeeding modules are deemed interchangeable due to a high overlap of module scores, the order of these modules can be determined by the therapist.
Final treatment plan. The statistical models used in BaSICA all refer to the mechanisms behind an individual’s disorder and do not include data on treatment motivation or the likelihood of relapse. Thus, modules 1 and 8 will be included in every treatment.
Treatment starts with one session of “Setting goals and maintaining motivation” (module 1). As the last row of Table 4 shows, the example patient’s treatment plan then proceeds with two sessions of “Mindful emotion awareness”. Next, one to two sessions of “Countering emotional behaviors” are planned, followed by one session of “Physical sensations”. The module scores of these two modules overlap by almost 90%, so the order of these two modules can be determined by the clinician. Similarly, the module scores of the modules “Exposure” (4-6 sessions), “Cognitive flexibility” (1-2 sessions), and “Psychoeducation” (1-2 sessions) all have scores overlapping by 85% or more, so the clinician can choose the order. The treatment concludes with one session of module 8 (“Recognizing accomplishments and looking into the future”).
One possibility to match interventions to target symptoms would be to accumulate sufficiently robust knowledge about the mechanisms of action of as many psychotherapeutic techniques as possible. These mechanisms would need to be established as a causal influence on treatment outcome. Ideally, its mode of action would have to be established in formal language. By applying these criteria, a recent review of the literature could not identify a single functional working mechanism,38 extending a similar review on “common factors”.39 In addition, psychometric items are plagued by the problem of “fat-handed interventions”40: according to this, it is almost impossible to derive interventions that modify the value of exactly one item while keeping all others constant.
Another option is to systematically capture and aggregate knowledge and experience from clinical practice. The resulting information can then be fed back into the research process. This approach, dubbed “two-way bridge between science and practice” by its main proponents,41 mainly works by conducting systematic therapist surveys on clinical practice. Research in the “two-way bridge” tradition has been conducted for many topics, including the treatment of social anxiety disorder,42 obsessive-compulsive disorder,43 or panic disorder.44 In order to create a database for the assignment of intervention techniques to individual items in BASICA, a survey was conducted among cognitive behavioral therapists.
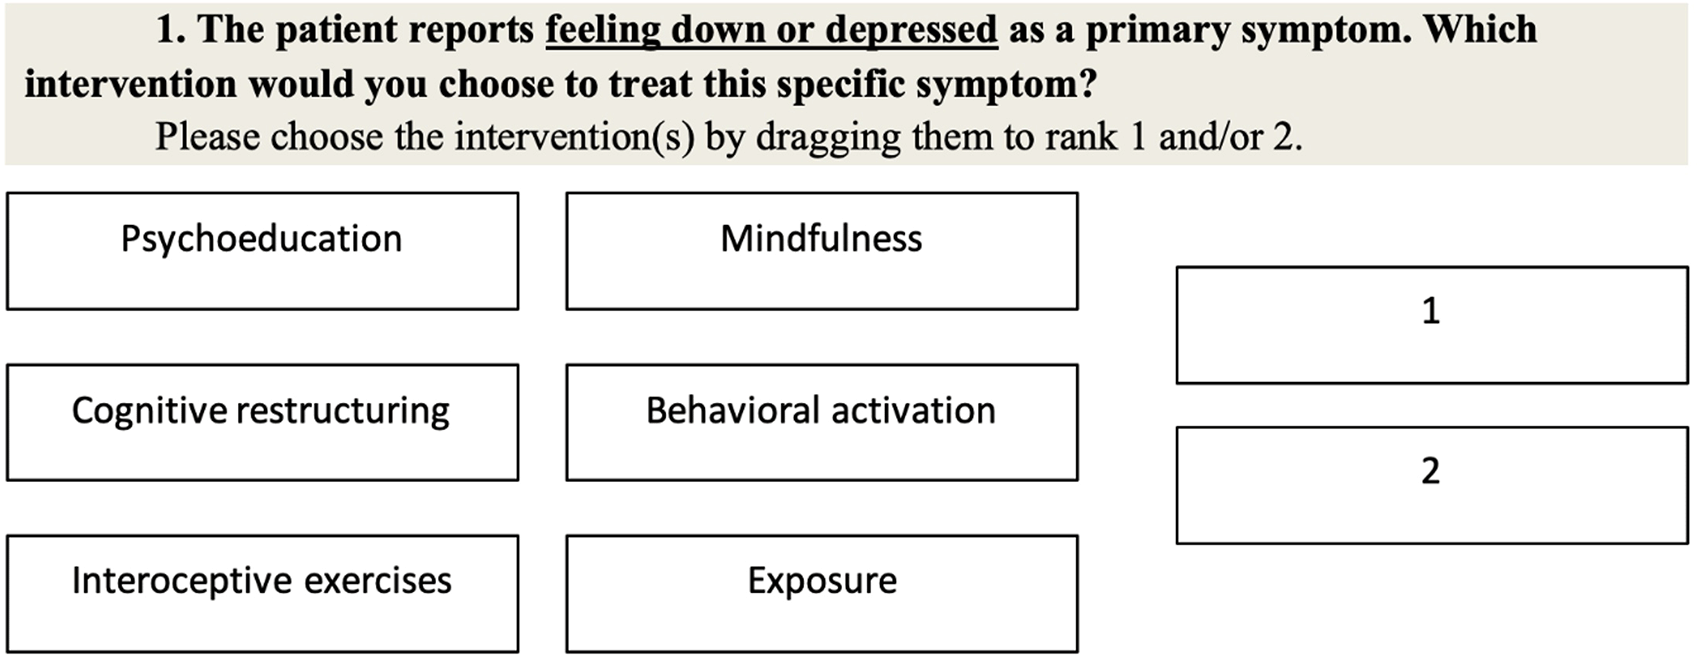
Questionnaire. Using the online survey application “SoSciSurvey”,45 an online questionnaire was constructed. Therapists were asked to assign two out of the six core treatment modules to the 21 items on various symptoms and behaviors used in the EMA survey. Item 22 was excluded from this matching procedure. Both the choice of items and techniques will be described below. In Figure 3, an example item from the online survey is depicted. Therapists were instructed to select the two techniques they found most appropriate. The most appropriate intervention should be ranked 1, the second most appropriate ranked 2. While rank 1 had to be given, rank 2 was optional. Short descriptions of all interventions were displayed above every item.
After finishing the survey, a question “Did you perform all the tasks as asked in the respective instructions?” was included. The subjects could answer either “I completed all tasks as required in the instructions”, “Sometimes I clicked something because I was unmotivated or just didn't understand it.”, or “I often clicked on something so that I could finish quickly”. This question was included to ensure data validity. Only subjects choosing the first option were retained in the data set.
The survey concluded with socio-demographic and training-related questions. Therapists were asked to provide their age in years, their gender (female, male or diverse), and their country of residence (Austria, Germany, Switzerland, other). With regard to their training, therapists were asked whether they were still in training or had completed it. The theoretical orientation (cognitive-behavioral therapy, psychodynamic or psychoanalytic therapy, humanistic-existential, systemic or other) was also assessed, as was the professional experience in years after training.
Participants. Psychotherapists from Austria and Germany were contacted with personalized E-mails. E-mail addresses were obtained from public online directories of psychotherapists. The online survey was conducted from 03-04-2019 to 12-05-2019. It was required that participating therapists were in their second year of training. A total of 1,003 psychotherapists were contacted, 229 of whom opened the survey link.
Data analysis. A score of 2 and 1 was assigned for the modules that were assigned as the first and second choice, respectively. The remaining modules received a score of 0. From this, a data matrix was constructed with the 126 assignments of one therapist in each column. A principal component analysis was conducted to obtain a consensus-based score, extracting one component from the data. Component scores were then transposed to a 6 (modules) by 21 (items) item-module matching matrix. The matrix was Z-transformed and rescaled row by row from 0 (lowest value) to 1 (highest value). This resulted in an assignment scheme containing the most appropriate and the most inappropriate module for each item.
A total of 110 psychotherapists aged between 24 and 70 years (M = 43.01; SD = 10.00) answered the survey. Fifteen subjects had to be excluded because they either did not consent to use their data for research purposes, reported being in the first year of training, or did not answer the data validity question as required. Of the 95 remaining therapists, 73 were female and 21 were male, while one therapist chose “diverse”. The majority (68 therapists) were from Germany, and 27 were from Austria. Most therapists (83, 87.37%) reported having completed their training. The remaining eleven therapists were still in training for an average of 5 years (SD = 4.33). Most therapists (90, 94.74%) reported specializing in cognitive-behavioral therapy, while five (5.26%) specialized in psychodynamic therapy. On average, therapists had 11.32 (SD = 8.79) years of professional experience. Those 90 therapists who reported specializing in cognitive-behavioral therapy, were considered for further analysis. Table 5 shows the percentages of each item-module assignment.
The first principal component explained 33% of the total variance. Principal component scores were transposed to an item-module matching matrix reported in Table 6.
In this article, I laid out the workings of a treatment planning algorithm for modular psychotherapy. The case study shows that the algorithm only makes planning decisions under sufficiently low uncertainty. Uncertainties in session number or module order are resolved by leaving them to clinical decision. Conversely, clinical decisions are subject to certain boundaries imposed by the results of the algorithm.
The uses of the algorithm are manifold. Since mobile devices are ubiquitous, EMA surveys of psychopathology are easily feasible. BASICA is sufficiently well automated that no further action is required to go through the steps from raw data set to a treatment plan. Therefore, its use in internet and mobile-based interventions is also conceivable. In the absence of a therapist, decisions under uncertainty could be left to the user, who can determine the intensity and order of the modules if the algorithm cannot decide with enough certainty.
There are some limitations to mention. First, while presenting a marked improvement over item-module-assignments made by smaller teams or single practitioners, basing this matching on survey data has some pitfalls. Assuming that the assignments adequately represent the clinical experience of the participating therapists, valid information for treatment planning can be extracted. However, the personal preferences of the therapists, the necessarily simplified task in the survey, and the limited choice of possible interventions may have biased the responses. It is not known whether the mechanisms of action behind the modules were entirely clear to the therapists. Since the Unified Protocol is an empirically very well-validated manual, the unique effects of the treatment modules have already been isolated.46
Second, if the selection of possible modules in BASICA is to be expanded, further expert interviews would be necessary. This makes further developments somewhat more protracted but prevents hasty extensions without the necessary expert knowledge.
Third, while initial an important next step is an assessment of the clinical usefulness of the algorithm. Whether BASICA increases the effectiveness of psychotherapy should be tested in a randomized controlled trial. Here it would be conceivable to compare the results of therapies planned with BASICA with those of a treatment carried out according to the manual. It is to be expected that symptom changes occur more quickly in BASICA-planned therapies since the modules that are expected to be most effective are given preference and their doses are more intensive.
Hereby, we confirm that we complied with the guidelines for human studies and that the research was conducted ethically in accordance with the World Medical Association Declaration of Helsinki of 1975, as revised in 2008. The Ethics Committee at Greifswald University Medical Center has approved the project (internal registration no. BB122/20).
Open Science Framework: Using smartphone surveys to personalize interventions: development and piloting of the Bayesian Statistical Individualization Algorithm (BaSICA), https://doi.org/10.17605/OSF.IO/NTF9Y.47
This project contains the following underlying data:
Data are available under the terms of the Creative Commons Zero “No rights reserved” data waiver (CC0 1.0 Public domain dedication).
| Views | Downloads | |
|---|---|---|
| F1000Research | - | - |
|
PubMed Central
Data from PMC are received and updated monthly.
|
- | - |
Provide sufficient details of any financial or non-financial competing interests to enable users to assess whether your comments might lead a reasonable person to question your impartiality. Consider the following examples, but note that this is not an exhaustive list:
Sign up for content alerts and receive a weekly or monthly email with all newly published articles
Already registered? Sign in
The email address should be the one you originally registered with F1000.
You registered with F1000 via Google, so we cannot reset your password.
To sign in, please click here.
If you still need help with your Google account password, please click here.
You registered with F1000 via Facebook, so we cannot reset your password.
To sign in, please click here.
If you still need help with your Facebook account password, please click here.
If your email address is registered with us, we will email you instructions to reset your password.
If you think you should have received this email but it has not arrived, please check your spam filters and/or contact for further assistance.
Comments on this article Comments (0)