Keywords
Disease prediction, Machine Learning, XGBoost, Logistic Regression, Performance measures.
This article is included in the Artificial Intelligence and Machine Learning gateway.
This article is included in the AI in Medicine and Healthcare collection.
This article is included in the Computational Modelling and Numerical Aspects in Engineering collection.
Disease prediction, Machine Learning, XGBoost, Logistic Regression, Performance measures.
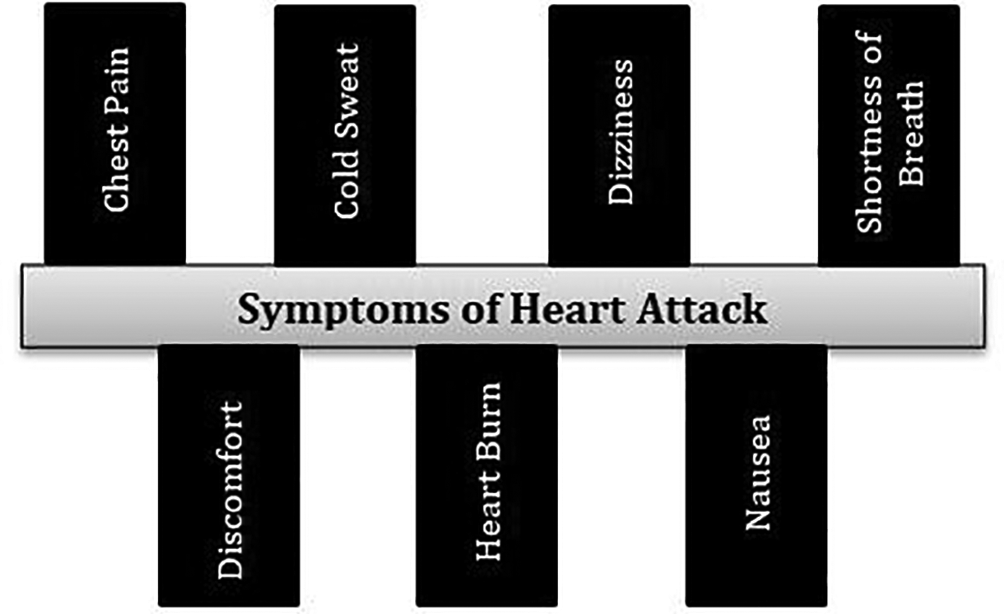
A heart attack which is analogous to acute myocardial infarction (AMI) is one of the most serious diseases in the segment of cardiovascular disease. It occurs due to the interruption of blood circulation to muscle of the heart which damages the heart the muscle. Diagnosing heart disease is also a crucial task. The symptoms, physical examination, and understanding of the different signs of this disease are required to diagnose heart disease. Different factors including cholesterol, genetic heart disease, high blood pressure, low physical activity, obesity, and smoking can be reasons for the occurrence of heart disease. The major reason for heart attacks is the stoppage of blood to the coronary arteries. The red blood cells (RBC) start getting low when blood flow is reduced; due to this the human body stops getting necessary oxygen and loses consciousness. The early diagnosis through symptoms and signs can help prevent patients of heart attacks if the prediction is accurate enough. Figure 1 shows different symptoms of a heart attack. The work presented takes 13 features/attributes as input having number values. It has been stated that little modifications in lifestyle including quitting smoking/alcohol/tobacco, having healthy food habits, and routine exercises can help in the prevention of heart attacks. Any person living a healthy lifestyle with early treatment after diagnosis can greatly increase the positive results. However, it is difficult to identify the high risk of heart disease where different risks like diabetes, high blood pressure, and cholesterol problems are present. In these types of scenarios, ML can help in the early diagnosis of disease.
Previous works have declared that prediction can be improved with the application of feature selection and proper engineering.1 An experiment with different machine learning approaches and models by tuning various hyper-parameters has been performed and improved the performance with optimized accuracy.1 Neural networks performed well when compared to other machine learning classifiers i.e., Naïve Bayes, J48, CART, Grading, and SVM with nearly 79% accuracy.
Other researchers worked on the reduction of cardiovascular features and extracted nonlinear features with discriminant analysis.2 Fisher was utilized for the experiment’s purpose to tackle overfitting problems and to improve the training speed. Results stated that 100% accuracy has been shown for the detection of coronary disease. Table 1 represents the summary of literature survey done for the work.
| Author | Findings |
|---|---|
| Boshra Brahmi et al.20 | Data mining techniques were utilized for the prediction of heart disease and J48 outperformed other models like K-Nearest Neighbor (KNN), Support Vector Machines (SVM), and naïve Bayes. |
| Marjia et al.21 | Weka-based heart disease prediction was done and SMO gave maximum accuracy of 89% as compared to Bayes net with 87% accuracy and J48 with 86%. |
| Zhang et al.5 | Worked on principle component analysis (PCA) using ADABOOST algorithm for prediction of heart disease. |
| Chala Bayen et al.22 | A short time result to improvise the quality of service has been presented with data mining models. |
| Stephen J. Mooney et al.23 | Different big data approaches have been utilized for interpretation and identification of threads. |
| Senthilkumar Mohan et al.24 | Worked on different machine learning classifiers for the defect prediction in which the maximum accuracy achieved was 88.4% |
| Salhi, D.E. et al.25 | Three approaches have been utilized i.e., SVM, KNN, and neural network (NN) on different sized datasets. It found that NN was the most accurate with 93% accuracy. |
| Harshit Jindal et al.26 | A prediction system has been declared in this work where logistic regression and KNN have been utilized. An improved accuracy has been shown by the proposed model. |
Another study has been done on the classification of arrhythmias for variations of heart rate.3 Classification was performed by using a multi-layer perceptron neural network. The results stated that the accuracy achieved was 100% with Gaussian discriminant analysis (GDA). GDA optimization and heart rate variability (HRV) signal feature reduction were done later which then went up to 15 from 13.4
It has been stated in the work by Zhang et al., in 20185 that 100% precision has been achieved with the support vector machines classifier. Many researchers utilized principal component analysis (PCA) to deal with high dimensional data. The Adaboost model was utilized in another study by using PCA for breast cancer detection.5
In this work, the focus is on optimizing the model of ML for the prediction of heart disease and the overfitting problem. It is certainly possible to address overfitting problem while working with Logistic Regression. A random sample can be drawn from the complete dataset to avoid overfitting issues. Also, the work focuses on training the model on samples of data obtained from the UCI Machine Learning repository. So, the aim of this study is to improve the prediction of heart disease.
In this section the description of methods implemented and the techniques used in machine learning research (MLR) are provided. The ML approach and the challenges related to the same are discussed and then selected methods are described.
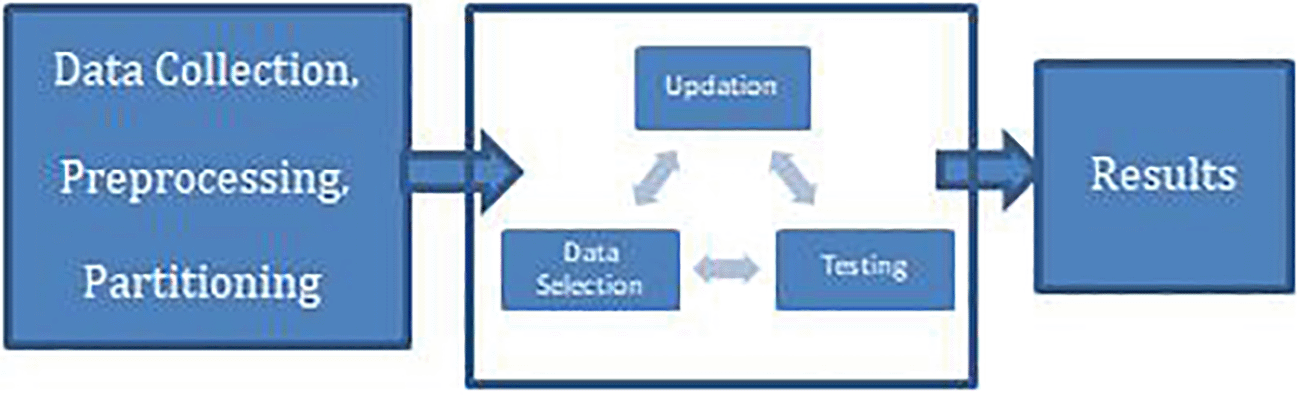
An active learning approach is utilized to implement the model. Figure 2 shows the base framework to the active approach of learning.
In the digital world, electronic health records have taken over to gather health data digitally which made it easier to collect data and allowed for data to become cheaper and more accessible in terms of availability. However, along with the easy availability of the data, there is also the issue of unstructured data which contains a lot of issues including redundancy, noise, heterogeneity, and diversity in scale.
Health care and diseases comprise of different outcomes including binary i.e., 0 or 1 which means 0 as ‘death’ or any other events, and 1 as continuous outcomes i.e., staying duration. Other outcomes include ordinal ones such as tumor grading, life quality, survival outcomes i.e., any clinical trials or survival from cancer, etc.
ML provides versatility in analyzing these data and providing some more precise results.
- ML is an effective way to optimize the prediction of heart disease and the related effects.
- A good understanding of the required parameters for the diagnosis of the disease can be highly helpful in making precise and accurate predictions.
- Cardiovascular (CV) disease research and treatment coupled with some high-performance tools for analysis can improve the knowledge about the domain.
A thorough search has been done of the previous work on the domain of the heart disease using different algorithms. The previous 21 years of work has been considered for study and their shortcomings are noted down to further extend our research. A total of 50 papers from Web of science, Science direct, and Scopus were collected from which 27 were selected for final study after removal of duplicates and same domain-based papers.
The literature survey has been started from January 1, 2021 until December 31, 2021 from Scopus, Web of Science, and Science Direct and thorough analysis has been performed on the collected papers. The analysis is done to understand the challenges in the field of heart disease prediction. Collected papers were studied and pros and cons of the work were being observed on the basis of the evaluation parameters, methodology, and utilization of algorithms.
The inclusion criteria was based on identifying the papers which are of related domain, utilization of latest machine learning algorithms, challenging area in domain of heart disease. Search terms for identifying papers are “machine learning based health disease prediction”, “optimization of Health disease prediction”, “Challenges in identifying health disease”. The exclusion criteria included removing duplicate papers, papers which presented inferior work in terms of evaluation parameter values, and obsolete work.
In one study, an electronic health record (ehr) model based on sequential modeling was designed with the utilization of a neural network.6 The EHR was applied for experiment conduction and predicting of heart disease. Researchers in this work used word vectors and hot encryption for modeling diagnostic situations and predicting cardiac failure. Along with the same approach, an extended memory model based on the network was utilized. The work stated that it is very necessary for taking care of the sequential character of healthcare with the help of results analysis. The sequential character of healthcare includes tracking of a behavior of person like his/her health-based activities, change in healthcare providers during sickness, exercise routine, diet routine etc.
The artificial neural network (ANN), random forest, K-Nearest Neighbor (KNN), and support vector machine techniques were used in another work.7 It stated that ANN produced the highest accuracy for heart disease predictions compared to the earlier classification algorithms. The work presented highly efficient results in terms of accuracy and other evaluation measures included in the study.
Another work stated that PCA as a dimensionality reduction technique can be utilized to deal with data having high dimensions and variance. More information can be stored utilizing this approach in new components.8 When working with data with high dimensionality, many researchers choose to employ PCA. Five unsupervised (linear and nonlinear) dimensionality reduction techniques were utilized, as well as NN as a classifier, to classify cardiac arrhythmia.9 With a minimum of 10 components, an F1 score of 99.83% was achieved with fast independent component analysis (FastICA) which was used for the ICA for breast cancer diagnosis.
Another researcher employed the AdaBoost algorithm, based on PCA.10 A combination of uncorrelated discriminant analysis and PCA was applied to select the optimal features for controlling upper limb motions.11
Using PCA approaches to time-frequency representations, another researcher attempted to minimize heart sounds to improve performance.12 A scale-invariant feature, Principle Component Analysis-K-Nearest Neighbor (PCA-KNN), was used in medical pictures for scaling to develop a new approach for diverse medical images that achieved an 83.6% accuracy with 200 images used for training the machine.13 A gray-level threshold of 150 was utilized as a result of PCA and Return on Investment (ROI), all of which were used to reduce X-ray picture characteristics.14
Diabetics are more likely to suffer from cardiovascular (CV)disease. In determining CV risk-assessment methods, both fasting glucose levels and glycosylated hemoglobin have been used. The evidence that these components are being used is inconclusive. According to the cardiovascular heart study,15 the relationship between fasting blood glucose and CV risk is relatively weakly associated. Similarly, multiple studies were done by other researchers15,16 which have shown a correlation between glycosylated hemoglobin and CV risk, as well as postprandial glucose levels.
Because of our genetic diversity, cultures, dietary habits, and social and behavioral features, available risk-assessment measures are not universal. In a review of the worldwide burden of CV illness, researchers discovered that various populations have varied disease burdens as well as different main Rheumatic fever (RFs) that contribute to this burden. The Asia Pacific Cohort studies sought to compare the Asian and Framingham cohorts in terms of risk factors and illness incidence and discovered that the Framingham group had greater systolic blood pressure, total cholesterol, and CV events, whereas the Asian cohort had higher smoking rates.17,18 There has been no consensus on the risk-assessment tools to employ in Asian populations for risk stratification. As a result, clinicians are perplexed and are unable to use risk stratification to prioritize individuals for primary prevention strategies. So, it has been stated that it will be beneficial to develop a predictive equation from the population-based on gathered data on a contemporary and representative basis. The current mixture of known and unknown RF based on genetic traits has been considered.19 As a result, we must be aware of the limits of each of these risk-assessment techniques and interpret the results with caution.20
Another work presented on different ML classifiers on which later comparative analysis is also performed.21 This work was performed on data mining approaches like Sequential minimal optimization (SMO), naïve Bayes, and J48 decision trees.
The maximum accuracy has been achieved with SMO with 89%. The J48 decision tree experiment provided an accuracy of 86% and naïve bayes classifier gave an accuracy of 87%.
Each step of this study is outlined below. Exploratory data analysis (EDA) is used for mistake detection, finding appropriate data, and checking the relationship between variables of exploratory analysis. In this work the heart disease-based risk factors are taken into consideration and ultimately the prediction of the heart attack. The ML classifiers utilized for the work are logistic regression, support vector machines, naïve Bayes, and XGBoost. A detailed literature survey has been performed considering the previous experiments conducted to predict the heart disease and the classifiers SVM, Logistic Regression, Naïve Bayes, and XGBoost are taken into consideration on the basis of their performance attributes. The experiment is carried out on a Cleveland dataset which contains 294 tuples having 14 attributes. A flowchart of the process is presented in Figure 3.
1. The first step is gathering data which is represented as ‘acquisition’. This included evaluating physical conditions and considering the numeric data by converting the samples which will be utilized by the computer to manipulate.
a. The data collected is taken from the UCI ML repository28 as outlined in the data collection section, having multiple attributes to study the risk factors for heart disease.
b. All experiments in this study are performed on Python 3.8.3.
2. The second step is ‘pre-processing’ where we tackled issues in the data such as missing values, outlier detection, and redundancy removal to clean the dataset. Predictive analysis has been performed for the uniform environment which also takes the application towards EDA.
a. The collected data has been cleaned using pre-processing techniques including missing values replacement, outlier detection, and duplicacy removal.
b. Missing values (if any) are being replaced with Mean values.
c. Outliers in the data has been detected using Boxplots by understanding minimum, maximum, and interquartile ranges of data.
d. Duplicacy removal in the data was performed by using a function dict() for generating dictionary to remove the duplicates.
3. The third step is ‘integration’ where libraries and different subsets were combined by importing independent modules in python and merging them to perform necessary experiments.
4. The fourth step is ‘analysis’ where EDA was done to understand the relationship between different attributes of data (Table 2).28
a. Analysis works on the concept of learning from data, pattern identification and making decisions with least intervention of human beings.
b. EDA is being utilized to understand the relationship between attributes.
c. Variable were compared to understand the correlation and the same variables were analyzed using boxplots and heatmaps.
5. The fifth step was ‘intervention’ to get into the decision-making policies i.e., search strategy for understanding previous experimental studies to determine when it becomes efficient to utilize models for real-world problems effectively.
a. A detailed literature survey was done to know the utilization of ML models for the same domain and to understand which are the most promising ones to optimize our results. The most promising papers were selected on the basis of their performance in previously implemented work in the similar domains for heart disease.
6. The sixth step was’application’ of ML algorithms in making the predictions. In this work, four machine learning models were utilized i.e., SVM, Naïve Bayes, Logistic Regression, and XGBoost.
a. SVM was applied on the data utilizing scikit learn with svm extension of python.
b. Naïve Bayes classifier is being applied by using Scikit learn library of neighbors in python.
c. Logistic regression was utilized with linear model class of sklearn in python.
d. XGBoost is a boosting algorithm which utilizes weak classifications and provide optimized results.
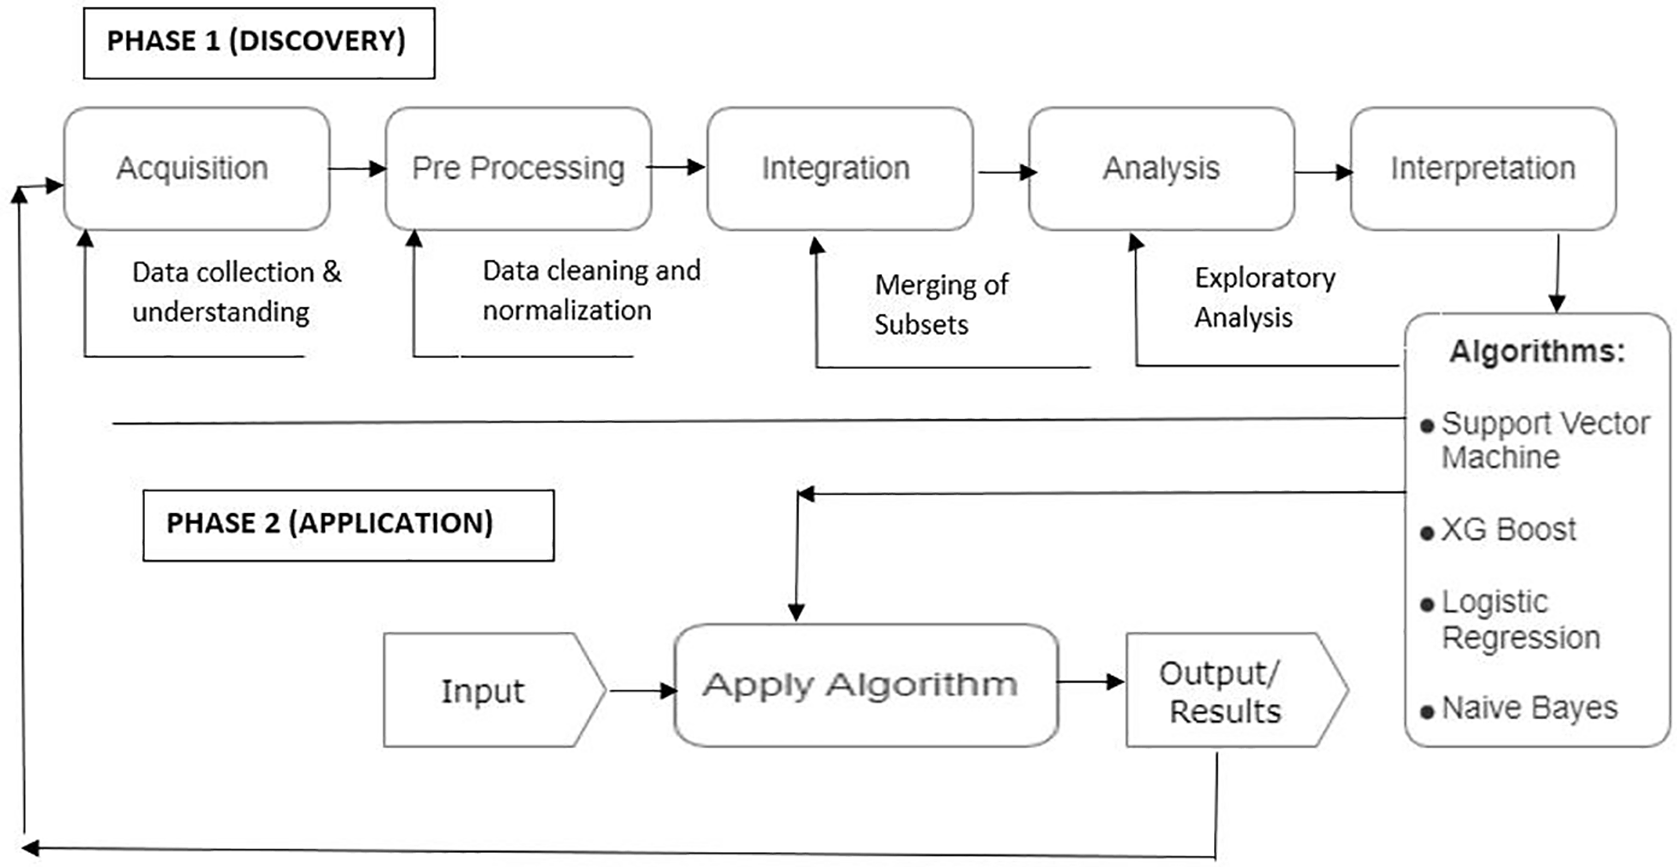
The work is conducted step wise starting from gathering the data. Pre-processing has been done on the data to clean it including duplicacy removal, detection of Outliers, and filling up missing values with mean. Then the four machine learning classifiers has been applied i.e., Support Vector machines, Naïve Bayes, Logistic Regression and XGBoost to further classify the outputs.
The dataset utilized is composed of four parts or sub-databases i.e., Hungary, Switzerland, Cleveland, and Long Beach which has 76 different attributes. In this work a subset of 14 attributes is utilized because all the published experiments in the literature review referred to these selected 14 attributes which helps to understand the major risk factors of heart disease. This dataset is available online in UCI repository to be availed freely for experimental purpose.28 The last column i.e., target value represents absence or presence of disease in the patient represented by binary of O or 1 respectively.
The prediction is being performed on whole dataset and to present the attributes and behavior of dataset, the sample of the data set is shown in Table 2 (whole dataset is not presented because of the size).27,28
The dataset contains attributes and integer values which are distributed in a file (heart.csv)29 whose link is provides at the end of the paper in the section of data availability.27 The behavioral and attributes information of the complete dataset is given in Table 3. The attributes of the dataset utilized (risk factors of heart attack)28 are discussed below:
1. Age (age): This is a highly crucial risk factor for the occurrence of heart attacks because the risk of getting heart attacks can double as age increases. In adults, the fatty streaks indicative of coronary artery disease starts to develop and it is proven that more than 80% cases of heart attacks due to coronary heart disease are in patients aged 65 or above.16
2. Sex (sex): It has been proven that there is a higher risk of heart attack in men compared to women aged 50 or less.17 After the menopause in women, there is a debate of equal risk of heart attack in both men and women. The disease of diabetes in women increases the risk of a heart attack.
3. Chest pain (cp): This happens when the muscle of the heart doesn’t get enough blood with oxygen and is called angina. The feeling of squeezing or high pressure builds up in the chest and an uncomfortable feeling in shoulder, jaw, back, or neck can also develop along with the feeling of indigestion in angina. The pain can be felt in the hands. Different types of Angina include stable angina, pectoris, unstable angina, prinzmetal angina, and microvascular angina.
4. Blood pressure (trtbps): Arteries can be affected by high blood pressure. This can occur because of different reasons like imbalanced cholesterol, high sugar, obesity etc. which can enhance the risks.
5. Cholesterol (chol): Arteries again can get affected due to imbalanced or bad cholesterol. It narrows the arteries especially the low-density lipo-protein cholesterol. Another cause is the blood fat i.e., triglycerides with high levels of cholesterol which can also enhance the risk of heart attacks. So, it is advisable to maintain good cholesterol to lower the risk of a heart attack.
6. Fasting blood sugar (fbs): High blood sugar can become a cause of a heart attack. It may happen due to lower hormone production by the pancreas or no response to insulin in the body.
7. Resting Electrocardiographic (restecg): For medium to high risk of heart attack, the present scenario is not sufficient to understand the screening disadvantages. For those having less risk of disease, the screening harmful effects including a rash or irritation on skin can balance up with exercise.
8. Heart rate (thalach): The increase in the heart rate with the enhanced risk of heart disease is being parallelized with risk increment with blood pressure enhancement.23It is proven in research25that if the heart rate increases by 10 bpm, then the chances of cardiac death increase by 20%. This is also the same with the enhancement in the blood pressure of 10 mm Hg.
9. Angina (exng): The discomfort from Angina which is an Exercise-induced makes the person feel gripped, squeezed and tight which can carry from mild to serious. The pain is usually felt in the chest’s center and it can spread up in the shoulders, back, jaw, arm or neck. Angina plays a crucial role in identifying coronary disease which makes it worthwhile to consider it a separate category for analysis.
10. Thalium Stress Test (thall): Duration of the segment is very important because it needs to be checked that after peak stress, the recovery is happening constantly or not with a positive treadmill test. The abnormal values come under the downslope of depression with less than or equal to 1 mm with 60 to 80 ms. The equivocal tests i.e., with up-sloping segments are also there in the exercise.
Rest 4 attributes, oldpeak, slope, number of major vessels, and output are the numeric values related to heart disease in the dataset and were not included in the 10 variables of this study.
The study was completed with four ML models: XGBoost, support vector machines, naïve Bayes, and logistic regression.
1. Logistic regression: One of the very popular algorithms is considered as logistic regression which is a supervised learning model. It performs categorical predictions which can be ‘true’ or ‘false’. This model provides probabilistic values instead of exact ones. This algorithm works on both continuous and discrete values. A simple S-Shaped curve can elaborate the logistic regression very precisely.
2. Naïve Bayes: A bayes theorem based algorithm, Naïve Bayes is a supervised learning model which works for fast predictions. It is a probabilistic classifier and works very accurately on high dimensional data.
3. Support vector machines (SVM): It is a supervised learning model which works on the concept of decision boundary or hyper plane. The aim of the algorithm is to maximize the margin of the hyper planes which helps in minimizing the misclassification problem. Model chooses extreme points to create the decision boundary which are called as support vectors.
4. XGBoost: It is a decision tree classifier which has been implemented on gradient boosting framework. This model works on the principle that weak learners should be combined to produce best predictions. Ensembling is performed in sequential manner.
In this work, the evaluation of the performance metrices are being done with four machine learning classifiers i.e., SVM, Naïve Bayes, XGBoost, and logistic regression.
XGBoost classifier provided best training and test scores of.91 and.89 along with the 92% accuracy. The results achieved are discussed below. Figures 4 and 5 represents the interface for taking input from users and predicting using machine learning.
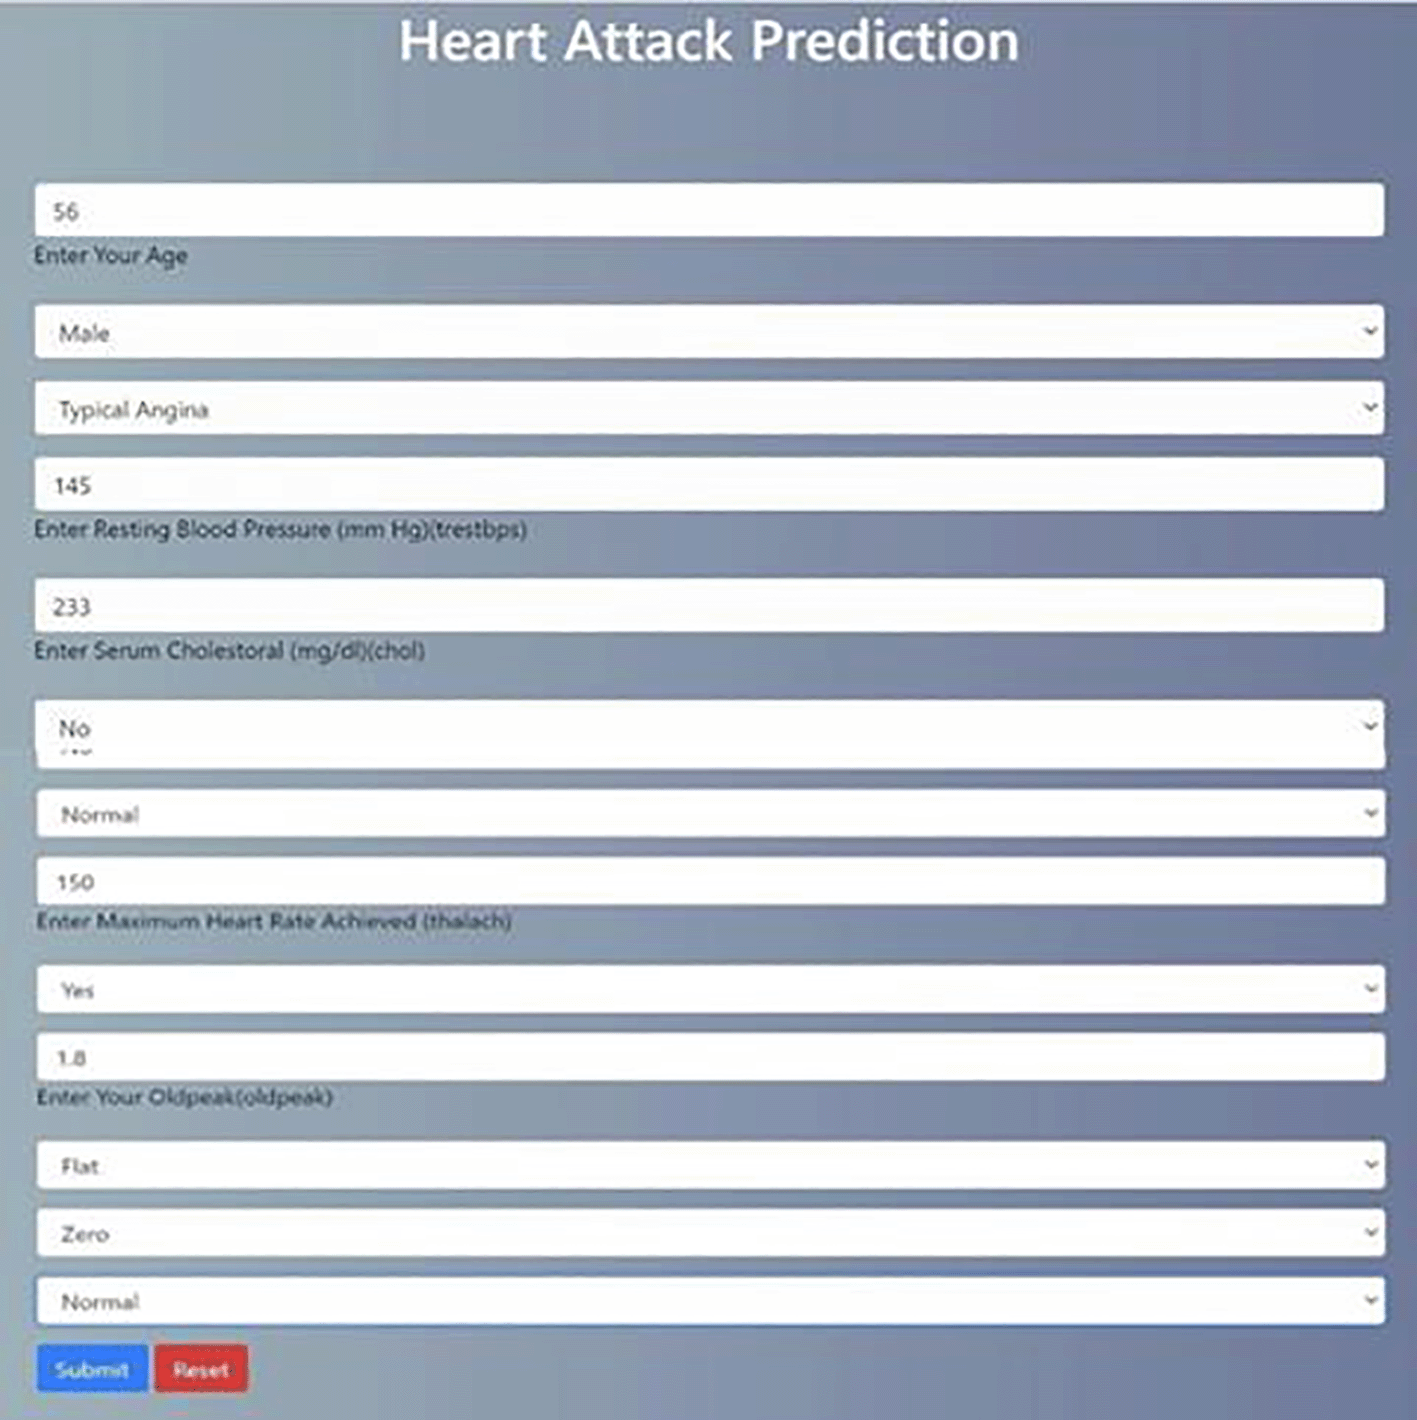

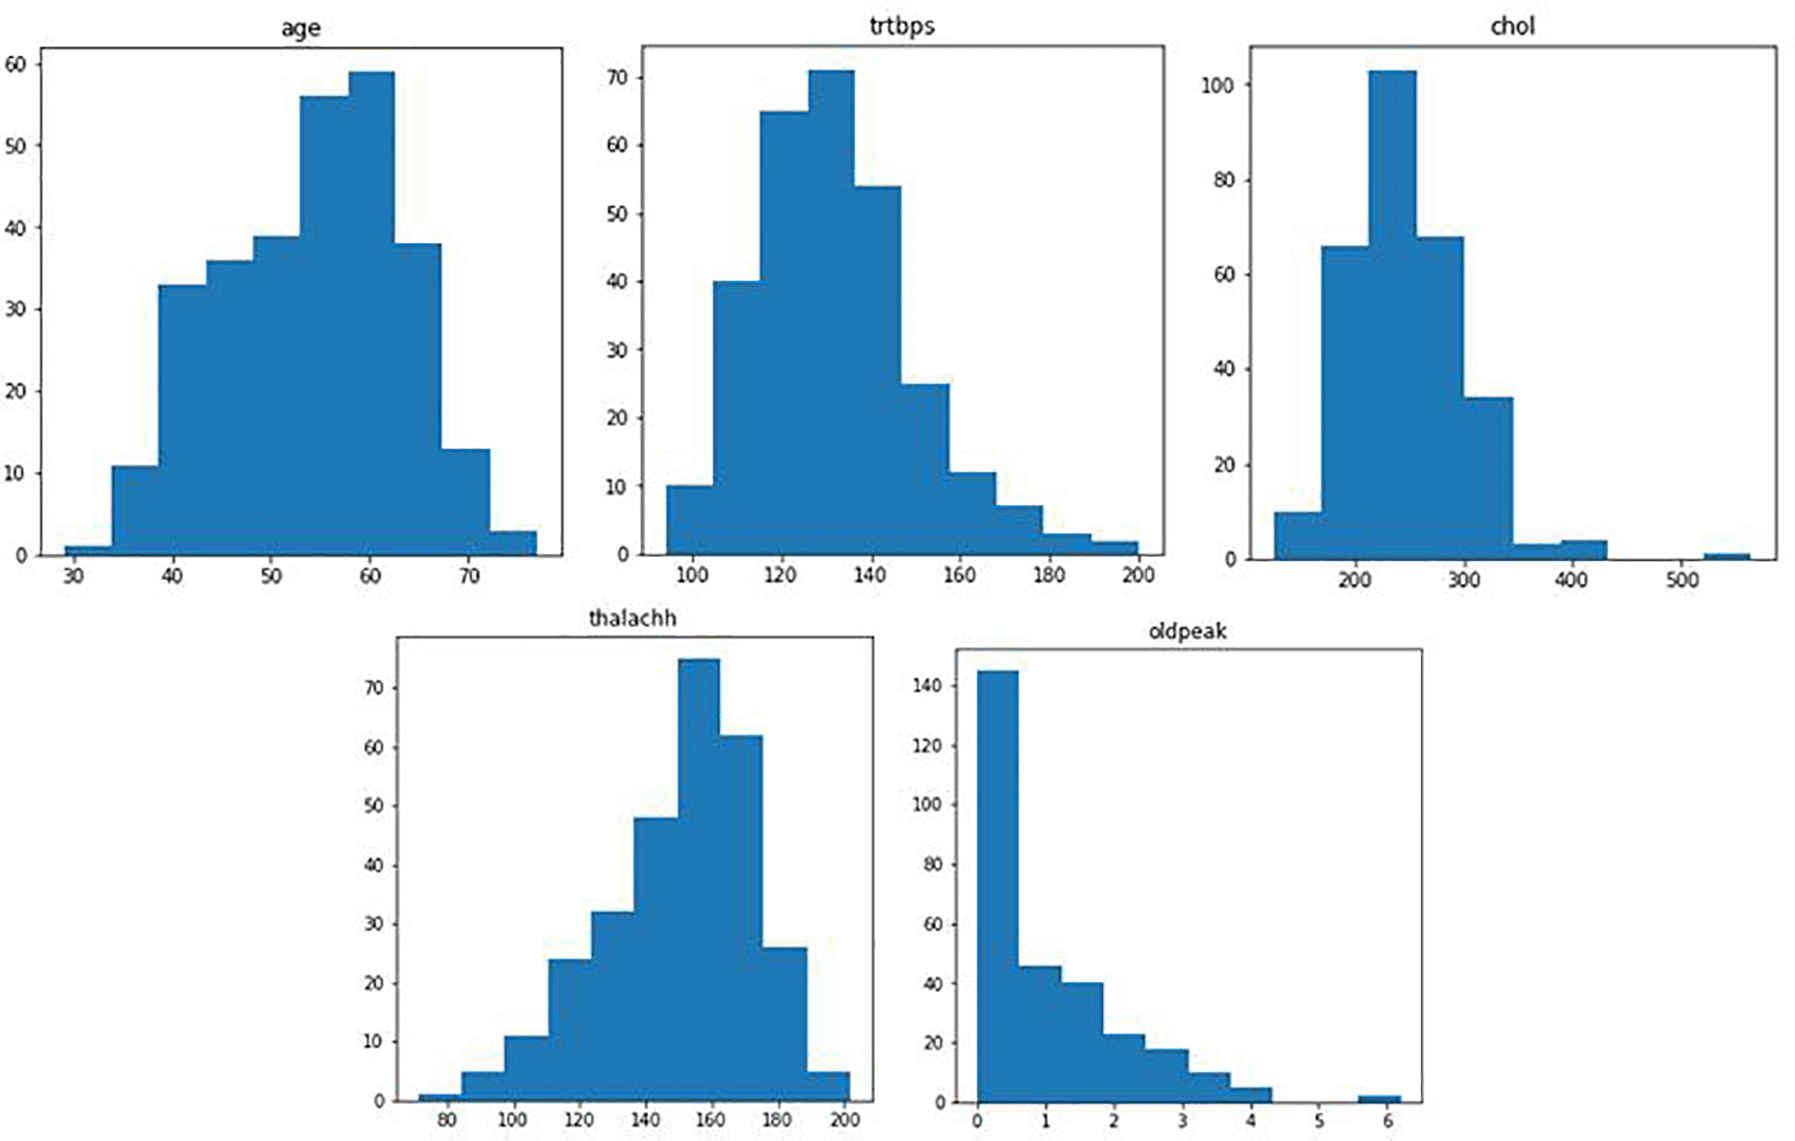
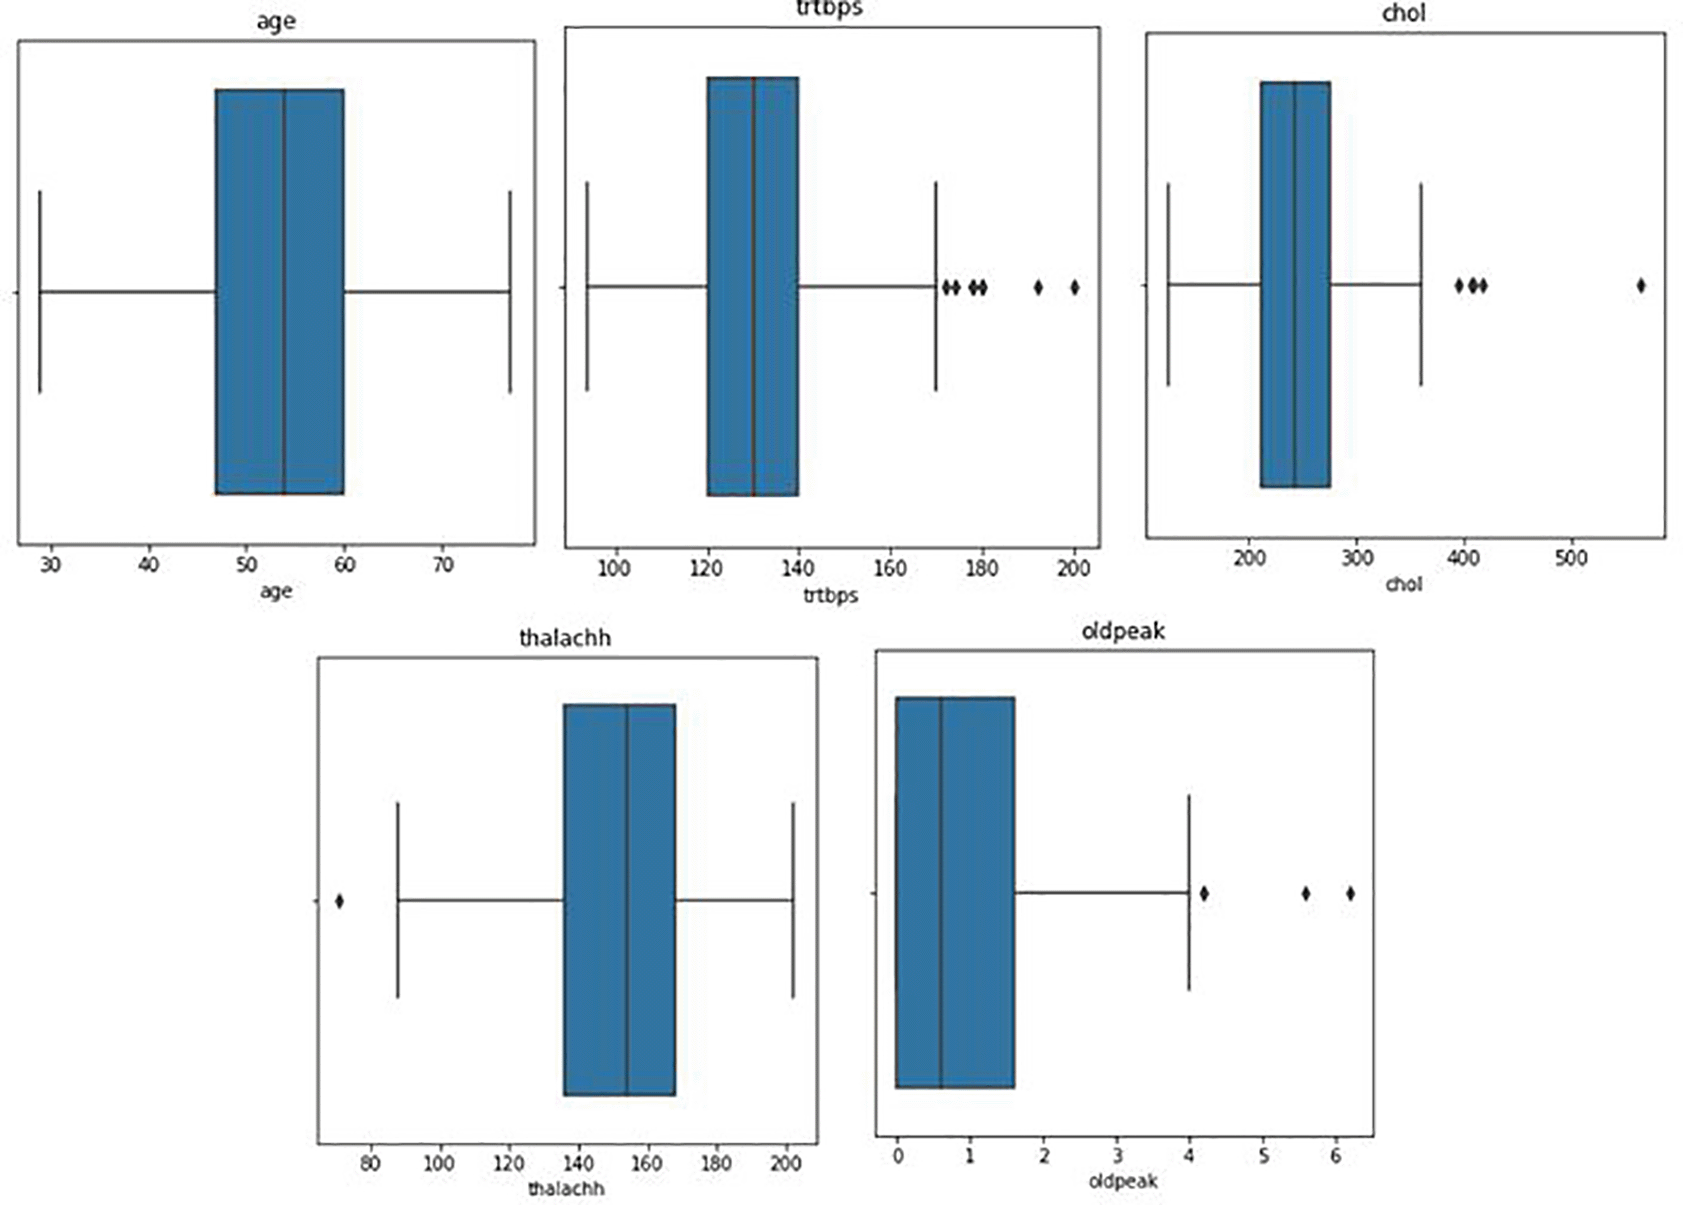
Figure 6 represents distribution of attribute values. Figure 7 shows the box plots to understand the median values of data.
The training and testing was evaluated for each machine learning classifier and results achieved are shown in Figure 8. The training score came up maximum with XGBoost as 91% and Test score also came maximum with XGBoost as 89%.
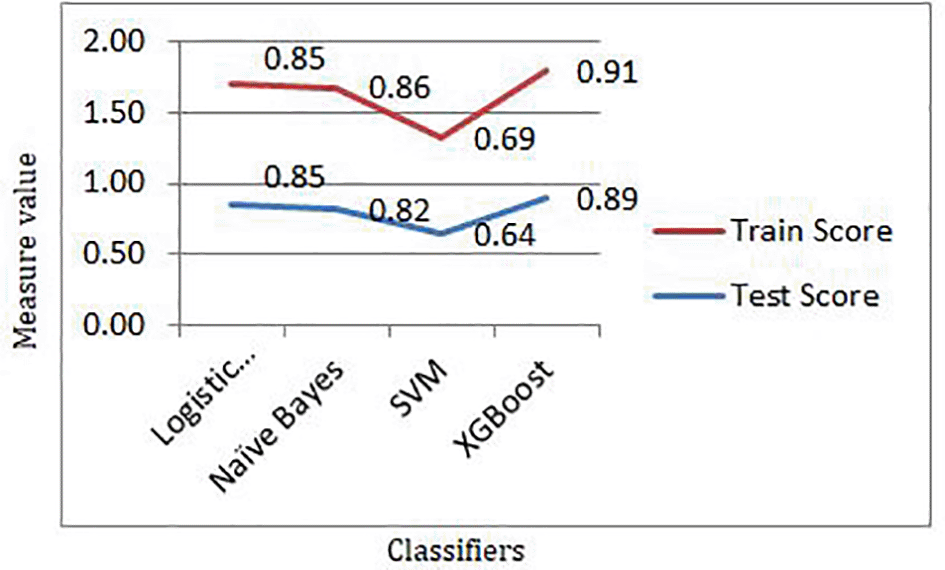
Figure 9 shows the results for different evaluation metrics and Table 4 provides the evaluated values for different machine learning classifiers.
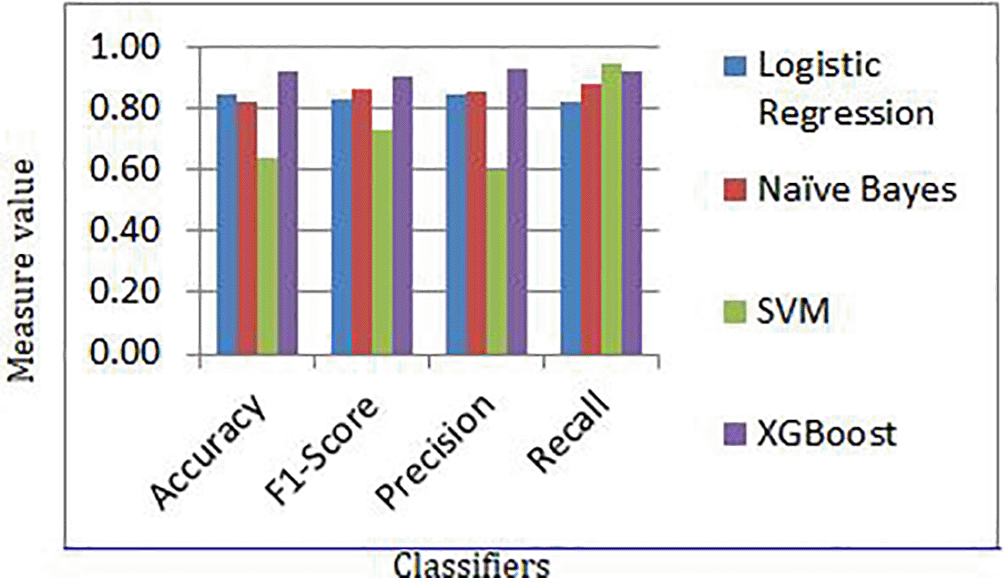
| Accuracy | F1-Score | Precision | Recall | |
|---|---|---|---|---|
| Logistic Regression | 0.85 | 0.83 | 0.85 | 0.82 |
| Naïve Bayes | 0.82 | 0.87 | 0.86 | 0.88 |
| SVM | 0.64 | 0.73 | 0.60 | 0.95 |
| XGBoost | 0.92 | 0.91 | 0.93 | 0.92 |
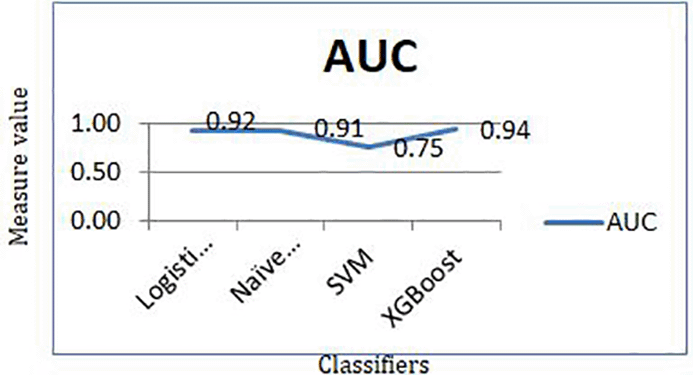
On the basis of the evaluation, the area under the curve has been generated for the work which is shown in Figure 10 and Figure 11. Figure 10 compares True Positive Rate (TPR) and False Positive Rate (FPR). Figure 11 shows area under the curve for all machine learning classifiers.
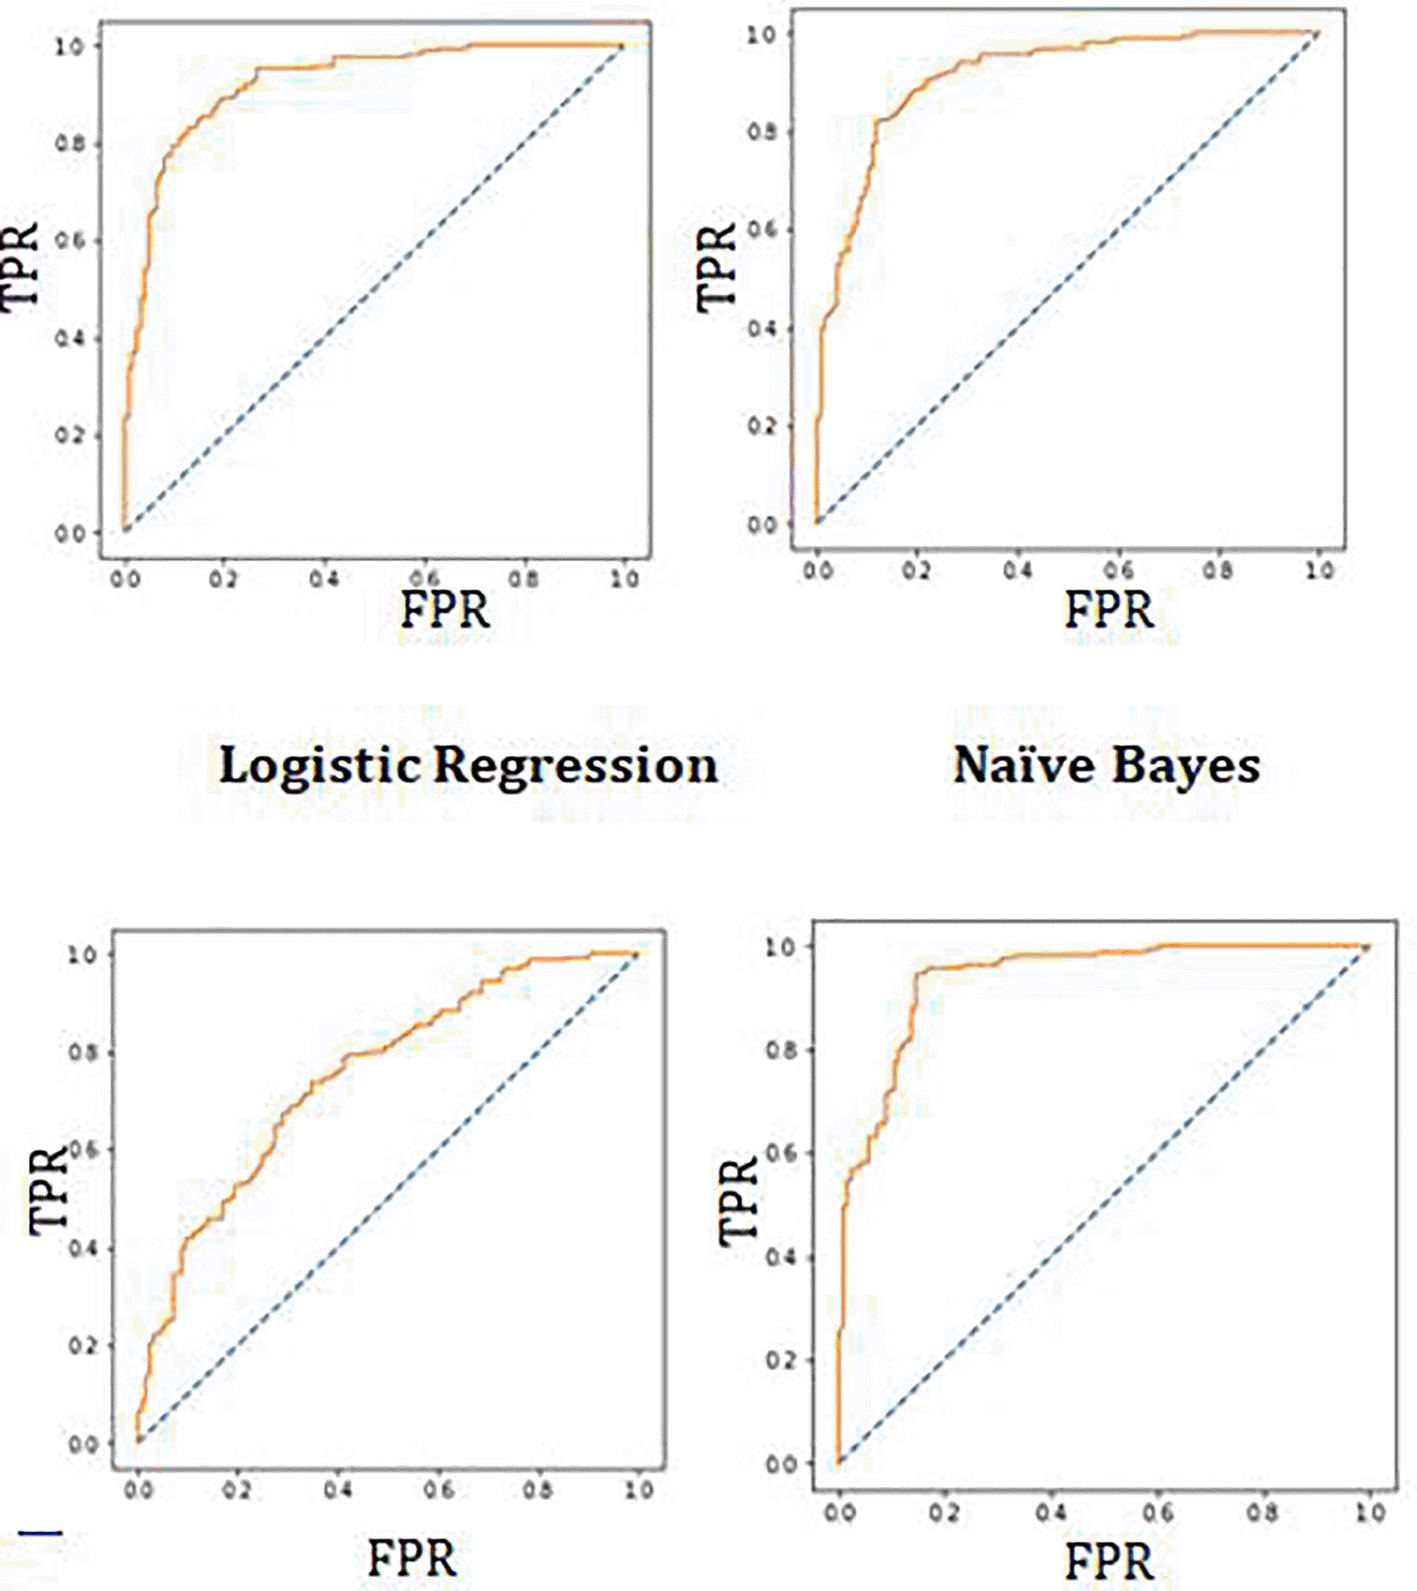
In the work, maximum accuracy was achieved through XGBoost algorithm. Area under the curve, precision, and recall are also evaluated to understand the performance of algorithms.
Some previous researchers proposed that the datasets should be small to deploy ML classifiers, which has been proved in this work. Additionally, the computation time was reduced, which is significant when the model has been deployed. The requirement for the normalization of the dataset has also been felt during the work and the overfitting can be there while training the model. Minimal accuracy has been achieved during evaluation of the real world problem based data. The data can be normalized in a range of methods, and the results can be compared. More techniques to connect heart-disease trained ML models with specific multimedia for the convenience of patients and clinicians could be discovered. The optimized results have been achieved in the presented work and XGBoost provided best results when it came on to accuracy as 92 % and Area under the curve as 94%. Future work will be on optimizing the performance of algorithms with hybrid approach for the prediction of heart disease.
The comparative evaluation of four machine learning algorithms for the heart disease prediction was carried out in this study, with promising outcomes. In this investigation, the performance of ML approaches has been better. When data pre-processing was used, XGBoost performed better in the ML technique for the 13 features in the dataset. The training and test score achieved for the XGBoost was highest with the values 91% and 89% respectively. Similar results of 92% accuracy and AUC score of 0.94 was achieved with XGBoost.
In the future, this research will be expanded by identifying and integrating new features from total of 76 features of heart disease. It also intends to employ other classification methods, such as deep learning to optimize the prediction. The goal is to study and merge more datasets in order to create a more relevant dataset that encompasses a broad range of population types. The feature selection can be used to generate more relevant features and effective results for the prediction of heart disease.
Figshare: heart.csv. https://doi.org/10.6084/m9.figshare.20236848.v1.27
The project contains the following underlying data:
Data are available under the terms of the Creative Commons Attribution 4.0 International license (CC-BY 4.0).
Software available from: https://ipython.org/notebook.html
Source code available from: https://github.com/nandalneha/heart_disease
Archived source code at time of publication: https://doi.org/10.5281/zenodo.6934185.
License: GNU General Public License 3
| Views | Downloads | |
|---|---|---|
| F1000Research | - | - |
|
PubMed Central
Data from PMC are received and updated monthly.
|
- | - |
Provide sufficient details of any financial or non-financial competing interests to enable users to assess whether your comments might lead a reasonable person to question your impartiality. Consider the following examples, but note that this is not an exhaustive list:
Sign up for content alerts and receive a weekly or monthly email with all newly published articles
Already registered? Sign in
The email address should be the one you originally registered with F1000.
You registered with F1000 via Google, so we cannot reset your password.
To sign in, please click here.
If you still need help with your Google account password, please click here.
You registered with F1000 via Facebook, so we cannot reset your password.
To sign in, please click here.
If you still need help with your Facebook account password, please click here.
If your email address is registered with us, we will email you instructions to reset your password.
If you think you should have received this email but it has not arrived, please check your spam filters and/or contact for further assistance.
Comments on this article Comments (0)