Keywords
Press perturbation, sensitivity, loop analysis, uncertainty quantification
Press perturbation, sensitivity, loop analysis, uncertainty quantification
Networks have become a routine tool for representing the complex systems that pervade biology, technology and society. While the development of methods for inferring network topology remains a dominant focus,18,19,21-24 numerous methods are now also being advanced for quantifying the weights (fluxes and interaction strengths) of the edges between pairs of nodes (genes, metabolites, species) in different network types.1,5,7,9,10 Motivating advances is the desire to predict how systems respond to perturbations wherein the concentration or process rates of a subset of nodes is chronically altered by external forces.2,28 Examples of such perturbations include gene knock-downs, fisheries harvest, and the administering of antibiotics.17,20,25,27
Predictive insight into perturbation effects nevertheless remains hard to obtain. This is true even when a network’s topology is fixed and precisely specified because edge weights are always subject to estimation error and empirical variation. Because of the many, often counteracting pathways through which perturbations travel, these uncertainties rapidly compound.16,26 In many cases, therefore, predicting even just the qualitative sign pattern by which nodes respond to perturbations (i.e. whether concentrations increase, decrease, or remain unchanged) is of desirable interest.6,14,17
Here we introduce PressPurt – a collection of computational tools designed to shed light on the qualitative and quantitative response of a network to press perturbations when there is uncertainty in the magnitude of edge weights. The PressPurt package is written to implement in a usable form the theoretical results established in Ref. 11. PressPurt is designed to identify the most sensitive interactions within the network which must be estimated most accurately to produce robust predictions of press perturbation responses.
PressPurt is designed to analyze networks whose dynamics may be described by a system of differential equations of the form for variables. Here, is a function describing the interactions between node and a vector of other nodes, is node ’s concentration, and is a scalar representing a constant rate of external input to (or removal from) node (a so-called press perturbation, sensu Ref. 2). Other forms of press perturbation may be represented in a similar manner.17
For input, PressPurt requires only a single CSV file representing the so-called Community Matrix12: the Jacobian of the system evaluated at a stable equilibrium point, . PressPurt begins by determining how a press perturbation on each node is predicted to alter the equilibrium concentration of each node by calculating the Net Effects matrix without interaction strength uncertainty, .6,17,26 Uncertainties in the elements of that alter the sign structure of are the cause of qualitative mispredictions.26
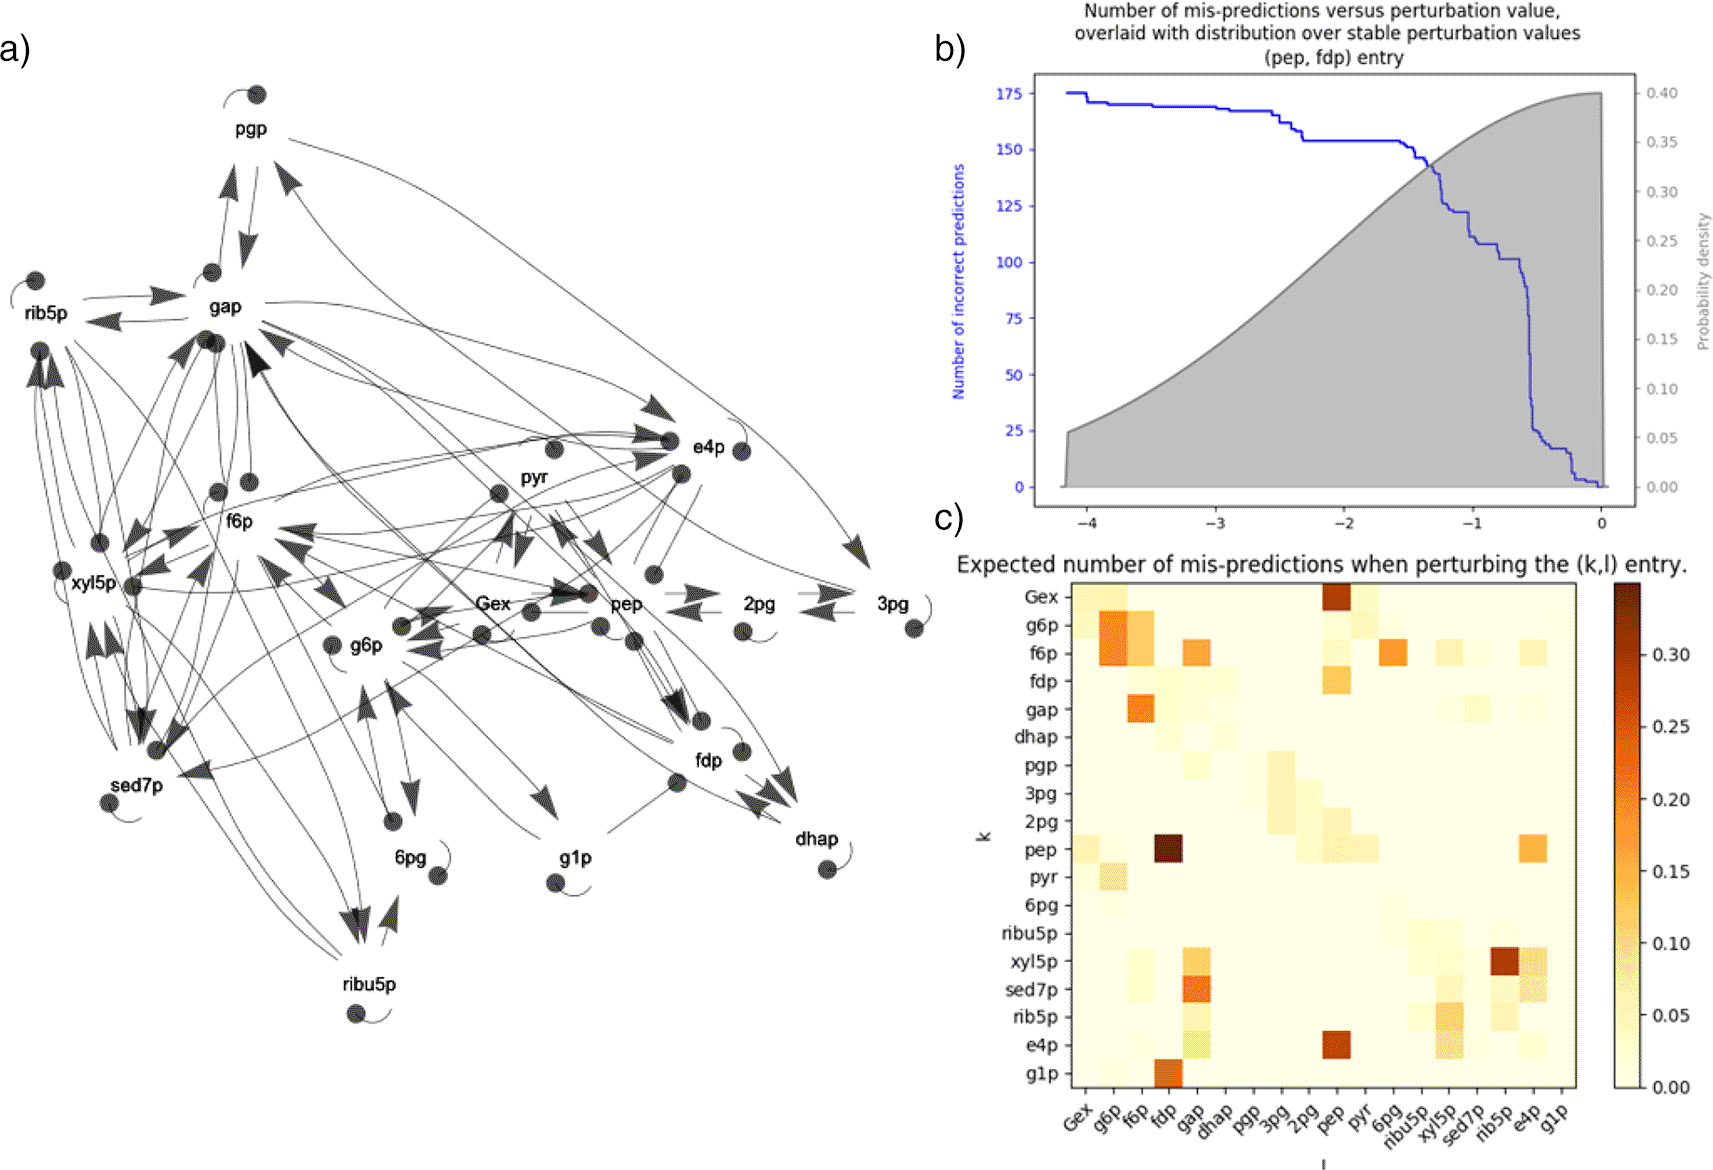
PressPurt can quantify the effects of interaction strength uncertainty in a single edge, independent of uncertainty in all other edges. To do so, the user specifies the kind of distribution and parameterization that describes interaction strength uncertainties. Currently, options include the uniform, truncated normal, truncated log normal, and beta distributions. Within the specified distribution, PressPurt finds the range of uncertainty values that permits the system to remain asymptotically stable, then returns a matrix in CSV format whose entry gives the expected (average) fraction of qualitative/sign changes in the net effects matrix resulting from the interaction uncertainty associated with edge . PressPurt can produce a visualization of the exact number of sign switches that are incurred as a function of uncertainty magnitude for a given edge (Figure 1b), as well as a heat map visualization of all edges depicting the fraction of possible sign switches that are incurred by uncertainty in each edge (Figure 1c). The overall sensitivity of the network when interaction uncertainty is considered one edge at a time is also returned as a percent of all possible mispredictions.

Panel a) shows the network with positive and negative interactions depicted with arrowheads and balls respectively. Panel b) shows how uncertainty in the magnitude of the (pep, fdp) interaction (assuming a truncated normal uncertainty distribution, shown in gray) affects the number of qualitative mispredictions (sign changes in the net effects matrix, shown in blue) that are made regarding how the concentrations of the network’s metabolites will respond to press perturbations. Panel c) shows a heat map of the expected (average) fraction of mispredictions that are incurred by uncertainty in each (k, l) edge (i.e. for the (pep, fdp) edge, the integration of the blue line with respect to the gray distribution in panel b). It demonstrates that uncertainty in the direct effect of fructose-1,6-bisphosphate (fdp) on phosphoenolpyruvate (pep) will result, on average, in the most mispredictions in the net effects of a unit perturbation to any of the metabolites in the network).
Similar computation and visualization functions are provided to measure the quantitative response of the network when interaction strength uncertainties are at their stability-limited values. In this context the actual magnitude change in the net effects matrix is computed, as opposed to just quantifying sign-changes in the net effects matrix.
PressPurt can also quantify the effects of interaction strength uncertainty when it is associated with multiple edges simultaneously. This is achieved via Monte Carlo sampling where uncertainties are presumed to follow a uniform distribution of a user-specified length. The fraction of samples that contain a qualitative misprediction in the net effects matrix is then reported.
PressPurt is available as both a Python package and an R package hosted at https://github.com/dkoslicki/PressPurt and on the CRAN repository https://CRAN.R-project.org/package=PressPurt. These provide complete documentation of all functions, as well as detailed installation instructions, quick start and use tutorials with example data (i.e. Jacobian matrices).
The PressPurt Python package is dependent on the Python packages numpy, scipy, matplotlib, sympy, pathos and pandas. The PressPurt R package is dependent on Python for its symbolic toolbox and uses the R package reticulate to communicate with Python. Thus Python, as well as its dependent packages, must be installed. It also depends on the R packages data.table, ggplot2, grid, gridExtra and utils, primarily for the convenience of their efficient data manipulation and visualization functions.
For input, PressPurt requires only a single CSV file representing either a quantitative or qualitatively-specified Jacobian matrix and the specification of a desired error distribution for the edge weight uncertainties. The three steps of an analysis entail: (1) preprocessing the Jacobian matrix, (2) computing the entry-wise or multi-entry perturbation expectations for either qualitative or quantitative sensitivities, and (3) visualizing the results. In R, for example, determining and visualizing the qualitative entry-wise sensitivities of a four-species intraguild predation module (whose Jacobian matrix11
is provided in PressPurt as IGP.csv) involves three commands. First,
infile <- system.file("extdata", "Modules", "IGP.csv",
              package = "PressPurt")
PreProsMatrix <- PreprocessMatrix (input_file = infile
                     max_bound = 10,
                     zero_perturb = FALSE,
                     threads = 2)
which returns information that includes, for each non-zero edge, their asymptotic stability intervals and values that would lead to a sign switch in the net effects matrix. Second,
Entrywise <- ComputeEntryWisePerturbationExpectation (
               PreProsMatrix = PreProsMatrix,
               distribution_type = "truncnorm",
               input_a = 0, input_b = -2, threads = 1)
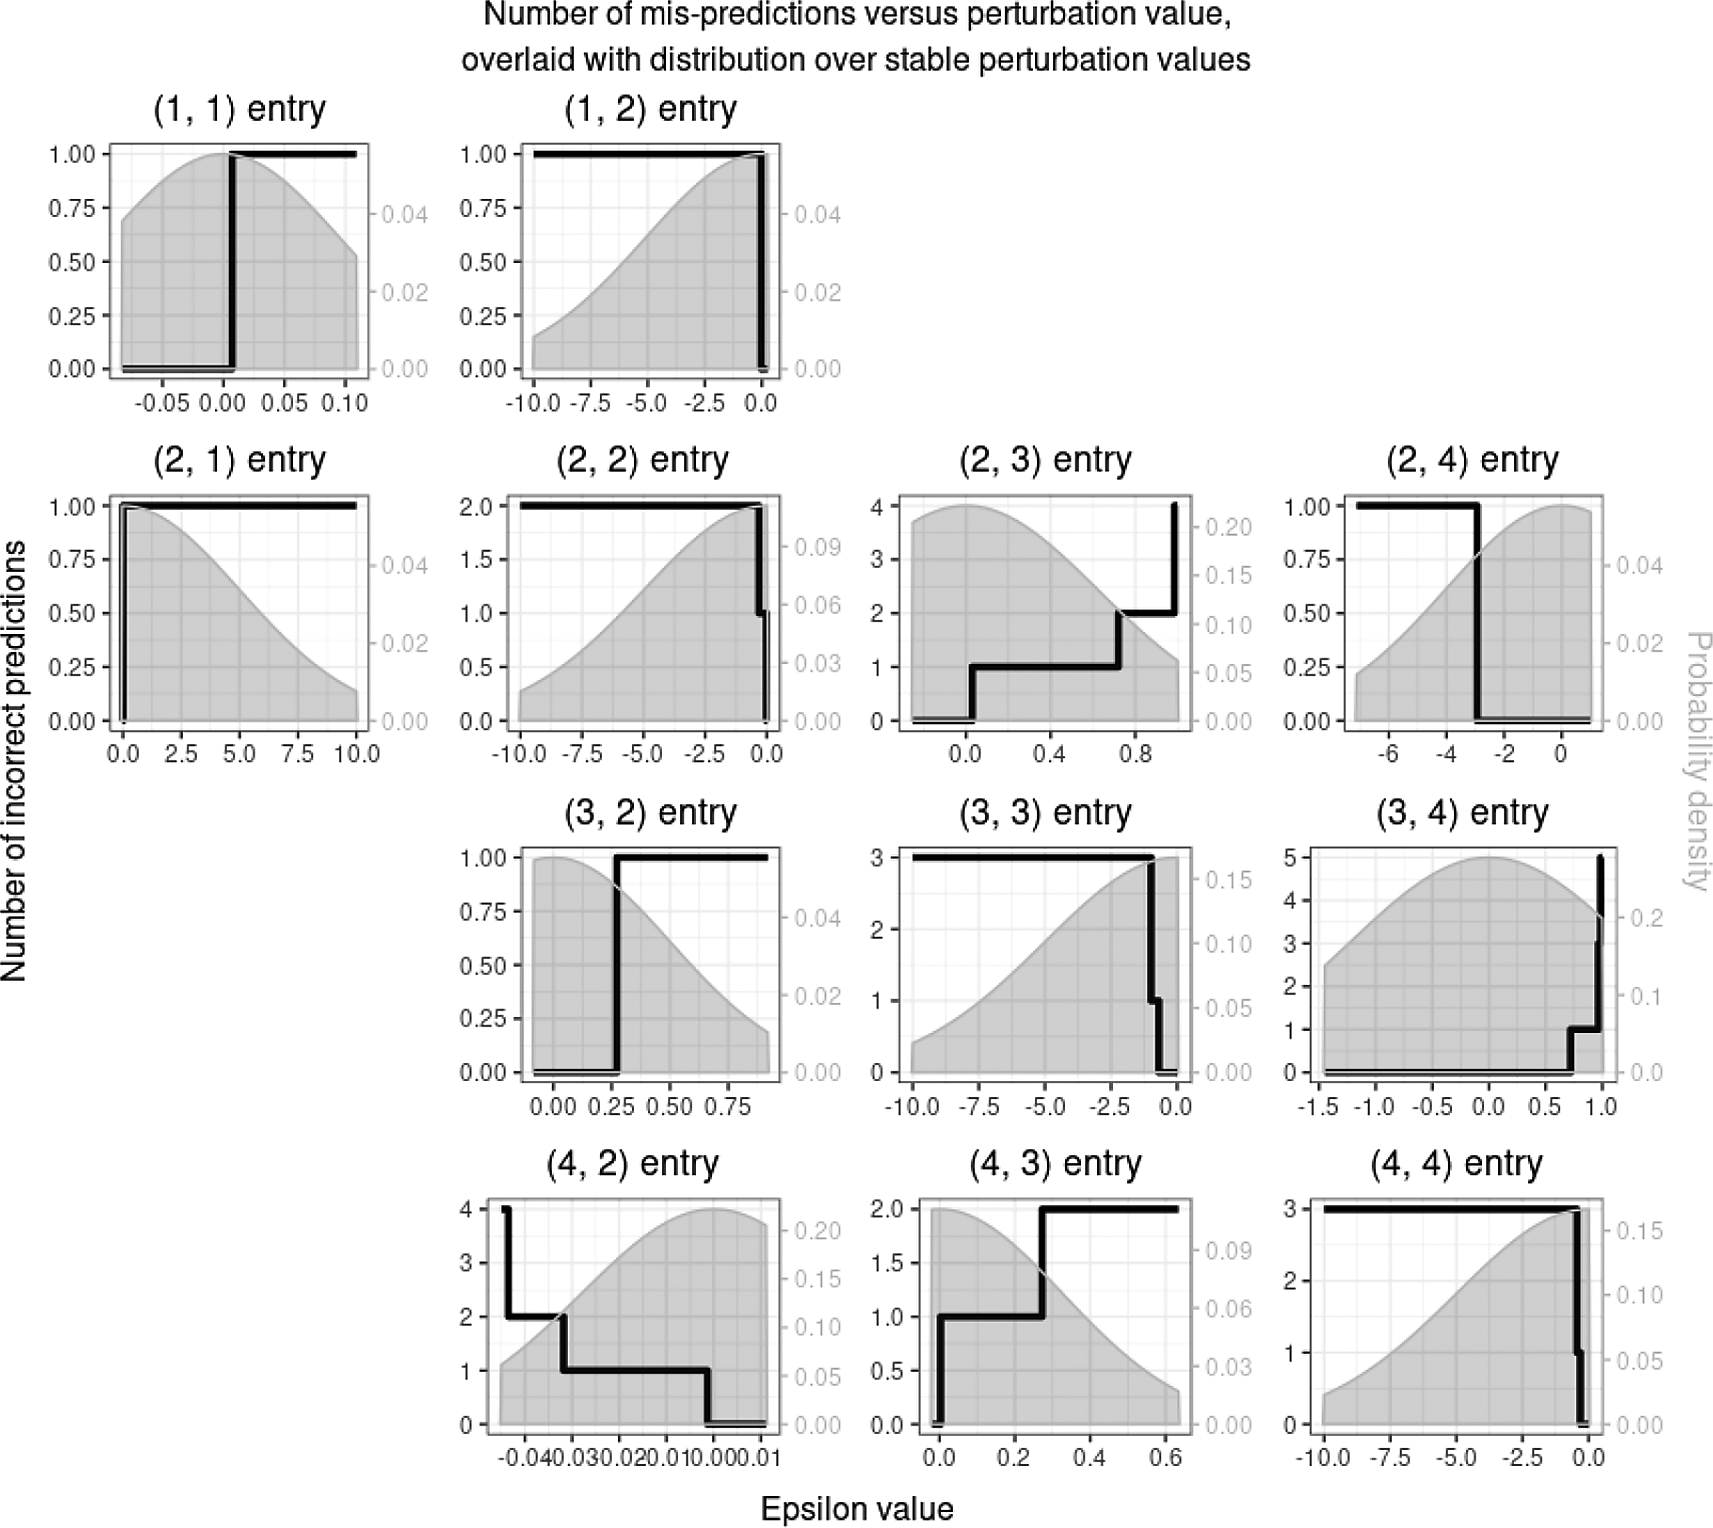
which specifies a truncated normal distribution of edge weight uncertainties with mean 0 and variance 2 (a negative value indicates that the standard deviation is to be the scaled to each edge weight) and whose output includes a matrix containing the consequent expected number of sign switches in the net effects matrix expressed as a percentage of all 16 possible mis-predictions,
Third,
GenerateEntryWiseFigures (EntryWise = Entrywise,
                all_numswitch_plots = TRUE)
which produces Figure 2 that overlays visualizations of the assumed uncertainty distribution associated with each edge weight and the consequent number of qualitative mispredictions (sign switches) that a given magnitude of edge weight uncertainty will incur in the net effects matrix as a whole.

The measures of sensitivity that PressPurt implements are exact and may be computed with relative ease and computational efficiency. PressPurt thereby obviates the need for what are typically computationally expensive simulations whose results can be difficult to interpret when assessing the sources of mispredictions in complex networks. Underlying these advances is the separation of uncertainty magnitudes from their frequency distributions (Figure 1b). Moreover, the theorems of Ref. 11 show that the analysis of qualitative models via Loop Analysis13 – the most commonly applied tool in context of fisheries management and conservation science wherein the values of are specified as either −1, 0, or 1 – are a special case of the methods implemented in PressPurt. In this regard, PressPurt complements the functionality of other network-based packages such as Refs. 4, 8, 15.
Future extensions of PressPurt may include reformulating the code to: (1) compute which predictions in the net effects matrix are most sensitive to errors in focal (or multiple) entries of the Jacobian, (2) determine which interactions are most sensitive with respect to a specific net effects prediction, and (3) allow for different kinds of distributions or parameterizations to be specified for each interaction strength uncertainty in both the single and multiple edge computations. Lastly, other theorems contained in Ref. 11, including those relating to the characterization of quantitative mispredictions, may also be implemented.
All data underlying the results are available as part of the article and no additional source data are required.
PressPurt is available from: https://cran.r-project.org/web/packages/PressPurt/
Source code available from: https://github.com/dkoslicki/PressPurt
Archived source code as at time of publication: https://doi.org/10.5281/zenodo.566117329
License: MIT
| Views | Downloads | |
|---|---|---|
| F1000Research | - | - |
|
PubMed Central
Data from PMC are received and updated monthly.
|
- | - |
Provide sufficient details of any financial or non-financial competing interests to enable users to assess whether your comments might lead a reasonable person to question your impartiality. Consider the following examples, but note that this is not an exhaustive list:
Sign up for content alerts and receive a weekly or monthly email with all newly published articles
Already registered? Sign in
The email address should be the one you originally registered with F1000.
You registered with F1000 via Google, so we cannot reset your password.
To sign in, please click here.
If you still need help with your Google account password, please click here.
You registered with F1000 via Facebook, so we cannot reset your password.
To sign in, please click here.
If you still need help with your Facebook account password, please click here.
If your email address is registered with us, we will email you instructions to reset your password.
If you think you should have received this email but it has not arrived, please check your spam filters and/or contact for further assistance.
Comments on this article Comments (0)