Keywords
Eye-tracking, Methodology, Neurodevelopment, Cognition, pre-verbal
This article is included in the Developmental Psychology and Cognition gateway.
Eye-tracking, Methodology, Neurodevelopment, Cognition, pre-verbal
It is often difficult to accurately identify infants at risk of later developmental problems in early childhood. Neurodevelopmental assessments (such as Griffiths Neurodevelopmental scales, Bayley scales of Infant Development, etc.) focus on the achievement of developmental milestones, particularly in language, fine and gross motor skills. These may underestimate abnormal development and overestimate cognitive performance.1–4 A meta-analysis conducted to examine the effectiveness of early developmental assessments (Bayley Scales of Infant Development, Griffiths Mental Developmental Scales, Stanford-Binet Intelligence Test, and Brunet-Lezine Scale) in predicting school-age cognitive function showed that almost half of the children who had cognitive deficits at school age were classified as having normal neurodevelopmental function between the ages of one and three years.3 This inability to detect abnormal development reliably and accurately at an early age or to reliably predict outcome at school age highlights the limitations of current assessment tools.1–4 It also makes it difficult for clinicians to diagnose some cognitive disorders early, resulting in a delay in early interventions. Hence, there is a need for an easy to use assessment tool that can be used at an early age to detect abnormal cognitive development and allow for early intervention and appropriate follow-up.
Computerised eye-tracking (ET) is a promising technology for the early identification of atypical learning and behaviour in infants.5–7 It is based on the assessment of gaze behaviours (also known as oculomotor orienting) which are an effective way to investigate cognitive processes such as visual attention, number sense, memory, and processing speed.5,8 ET allows for the observation and measurement of gaze behaviours and to help address an array of research questions concerning cognition across various cohorts.8,9
Corneal reflection, a non-invasive method of capturing eye movements is the most common ET method used.8 This technique involves shining near-infrared light at the eyes and recording the reflection from the cornea.9,10 Advances in computerised ET technology has allowed companies such as Tobii (Tobii, Sweden), iMotions (iMotions, Denmark), SR Research (SR Research, Canada), and Smart eye (Smart eye, Sweden) to develop user-friendly systems, incorporating hardware and software components which facilitate the collection and analysis of ET data —making ET an accessible method for research in various populations.
ET has become an increasingly popular tool for studying early cognitive development.11 ET is frequently used in autism spectrum disorder (ASD) research for early detection and diagnosis.8 It has been used to understand the mechanisms underlying atypical development of social cognition in ASD,12 prematurity13 and specific language impairment.14 One of the advantages that ET has over standard neurodevelopmental assessments is that it can be used in preverbal and non-verbal populations.9
While there has been an increase in the use of ET in research, limitations and challenges remain. Reported methodologies often contain insufficient detail, making it difficult to replicate studies and compare results.7,15–17 Fiedler et al. (preprint, 2020) identified aspects of ET that must be reported for the study to be reproducible. They applied what they considered minimum requirements for reproducibility to 215 papers that used ET, but none reported enough information to be reproducible.17 Numerous ET measures exist, with multiple definitions and names, making it difficult to compare studies18–20 or choose which measures are best suited for an individual study. Examples of this include fixation duration, also known as dwell time21; and area of interest (AOI), also known as region of interest; LookZones and Interest Areas .21
The most-reported measures used in ET studies are fixations and saccades. The definition of fixation varies between studies, and some groups use the oculomotor definition (a period of time when the eye is maintaining gaze on a single location). Others use the processing definition (adding visual intake as criteria for fixations).21 Saccades are the swift movement of the eye from one fixation to another fixation.21 Fixations can vary in length, and there can be multiple fixations on a visual target.9,19,21,22 Another variation in the definition of fixations occurs with the use of fixation identification algorithms. These algorithms are often poorly described and hence it is difficult to compare them. In addition, they are often programmed with a predefined fixation duration threshold which can vary between studies. Fixation duration thresholds range from 100 ms – 300 ms, and this can result in fixations being cut-off or longer saccades being classified as fixations.20,23 Unfortunately, a clear and universal definition of fixation duration in an infant cohort is not currently available.18
There are no standardised recommendations for the positioning of the eye-tracker or the child during ET assessments. Some studies placed the child in a car seat, on a caregiver’s lap, seated by themselves or allowing the child to stand.7,11,24,25 Others have not reported how the child or eye-tracker was positioned.26 In one study, an argument was made that a car seat should be the default seating position as it provides the infant with less opportunity for movement and hence better quality data.11 However, the authors did acknowledge that for the car seat to work, a custom made mount for the monitor and eye-tracker was needed to ensure an optimal position in relation to the eye-tracker which may not be practical for all studies. They also noted that infants might not tolerate a car seat, and in these cases, should be allowed to sit in the caregiver’s lap.11
There are no agreed standards for ET equipment calibration, with the number of displayed calibration points varying between studies and no agreed definition for acceptable calibration.18 These details are often missing from the methodological section of papers. Hence, to compare studies, replicate findings, and expand the use of ET, there is a need for the standardisation of definitions terminology, procedures and reporting guidelines before it can become an accepted and scalable clinical tool.
This paper aims to share a methodology and analysis of ET assessments that strives to be reproducible and to help standardise these assessments for eventual clinical rollout. The set-up of an ET lab and ET methodology which was used in a study of 210 term- and preterm-born infants at 18 months corrected age is described.
Ethical approval for this study was granted from the Clinical Research Ethics Committee of the Cork Teaching Hospital (ECM 08/2021 PUB) on the 9th of October 2018. Explicit written informed consent was obtained from the caregivers for this ET study as per the protocol.
Eye-trackers are now widely available and are marketed as user-friendly, affordable, and easy to use in all populations.27 There are several factors that need to be considered when purchasing an eye-tracker for use in a preverbal cohort: available budget; necessity of a chin-rest, suitability for use in an infant cohort; if software and data processing is included; compatibility with study objectives; accuracy, precision, and sample rate of the eye-tracker.19,28 Another factor that needs careful consideration is the type of eye-tracker (screen-based or head-mounted). Screen-based eye-trackers, often called remote eye-trackers, are mounted below a screen, allowing the participant to sit, free of attachments, in front of the screen displaying the visual stimuli. Head-mounted eye-trackers are usually mounted onto glasses and allow the participant to walk around freely and to participate in physical tasks.19,28
We chose the Tobii© (Tobii, Sweden) X2-60 eye-tracker provided by iMotions (iMotions, Denmark). The Tobii X2-60 system tracks both eyes of the subject with a sample rate of 60 Hz and a rated accuracy of 0.3°.29 The eye-tracker can be used in various experimental designs, and the track box allows for freedom of head movement during the recordings within a 50 × 36 cm (Width × Height) area, which makes it more suitable for use in infants.
ET measures should be chosen and defined during the study design phase. Selecting the appropriate ET measures affects the type of questions that can be asked. Different ET measures are required for specific tasks and these tasks assess different aspects of cognitive function. The most common ET measures used in ET tasks are based on fixations or saccades, with examples of these listed below30–32:
• Fixations and gaze points
• Time to first fixation
• Time spent (dwell time)
• Fixation sequences
• Revisits
• First fixation duration
• Average fixation duration
• Smooth pursuit
Each measure provides different information, and hence it is essential to have research questions planned prior to the study so that the correct measures can be selected. Six tasks were used in our study assessing visual attention, working memory, and social cognition. The measures collected during these tasks were: time to first fixation, mean duration of fixations, the percentage number of fixations, and the percentage duration of fixations within a selected area of interest.
Commercially available software may not be suitable for acquisition or analysis in the study of young children, as age-appropriate methodologies are required.9,18 While the use of ET has increased, the software is generally designed for use in marketing or research with adolescents or adults and may not be suitable for use in preverbal children with variable receptive language. Many commercially available software packages do not allow for child-controlled tasks (i.e., tasks that are dependent on child behaviour)18 nor allow for tasks to be paused, which is essential when the child is unsettled or needs a break during the assessment, to help prevent data loss. Calibration routines are also usually not child friendly; they are long, have too many calibration points, and often require the assessor to try and direct the infant to each of the points. The results of the calibration are often not provided. Commercial manufacturers do not include “attention-grabbers”. These are usually colourful images that are played on the screen accompanied by a sound such as a horn and are helpful in redirecting children back to the tasks on the screen.
We identified the ET tasks package from the British Autism Study of Infant Siblings (BASIS) in Birkbeck College at University of London as suitable for our purposes.33,34 The tasks included in this package have been used in studies with both typically and atypically developing infants24–26,33 and assess visual attention, working memory, and social cognition. This task package is designed to run within the Matlab (MathWorks, USA) programming environment. This allows for the programming of attention grabbers that can be played throughout the tasks to direct the child’s attention back to the monitor if they become distracted. The calibration provided is infant friendly, the tasks package can be paused when necessary, and some of the tasks are controlled by the infant (e.g., the working memory task). The Birkbeck tasks package was installed on an Apple Mac desktop PC using the macOS Sierra 10.12.6 operating system. Psychtoolbox (V3.0.14, a Matlab toolbox) with GStreamer (v1.0 runtime35) was also installed on the desktop. This program presents the tasks on a secondary monitor and runs the experiment by communicating with the eye-tracker, sequencing the tasks, and recording the ET data. The Birkbeck tasks package is not open-source code but can be reprogrammed using the freely available and open-source psychtoolbox and therefore the structure and arrangement of the tasks detailed in this report are easily reproducible.
Data quality is paramount and optimising this from the outset is crucial. There are many factors that can affect data quality, including the position of the eye-tracker, the monitor, how the infant is positioned, the accuracy and precision of the eye-tracker, the experience of the assessor conducting the experiment, the calibration, the behaviour of the infant,11,19 and the physiology of the infant's eye (e.g. infants with blue eyes have more data loss than infants with brown eyes).36,37 The accuracy and precision are dependent on the ET device and should be provided by the manufacturers. However, it is important to keep in mind that these figures are often acquired under optimal experimental conditions, usually with adult participants and with the use of chin rests to limit movement.19 Chin rests will not be acceptable to a young preverbal child.
Data loss can affect the quality of data and can occur for many reasons, including blinking, turning the head away from the eye-tracker, or technical issues with the eye-tracker. This is especially problematic in a cohort of preverbal children who may find it hard to stay still for the duration of an ET assessment. The correct positioning of the participant with respect to the eye-tracker is imperative to reduce data loss and, in turn, maintain the quality of the data. Manufacturers often provide instructions regarding the optimal position and orientation of the participant. However, positioning an infant can be difficult, as they will move freely, resulting in data loss.18
Data quality for the Birkbeck task package was validated in an international assessment.38 The task package is used by the Eurosibs consortium and is a nine-site European study of neurocognitive development in infants with an older sibling with ASD. As part of the Eurosibs consortium, Jones et al. reported the data quality from the Birkbeck task package across the nine sites involved in the consortium. The data used was from a subset of infants tested at 5, 10 and 14 months of age. The infants were seated in their caregiver’s lap throughout the assessment. Data quality was assessed using one-way analysis of variance with the site as the independent factor. Overall, the quality of the ET data was consistently high across the sites.38
The layout of the ET lab and the set-up of equipment is critical. Noise, lighting, the position of the eye-tracker, and the position of the infant can all influence the quality of data collected.21 External distractions such as noise can impact data acquisition, incorrect lighting can make it difficult for the eye-tracker to capture good quality data, and incorrect positioning of the eye-tracker with respect to the child can also lead to the collection of poor quality data and data loss.
We positioned our eye-tracker according to the instructions from the manufacturer, i.e., at the bottom of the monitor presenting the stimuli. The ET lab should be set up in a soundproof room, or in a quiet area, with no natural light. In our lab, the room is soundproofed and had one window with a blackout blind. The room also has a dimmer light to control level of lighting and ensures consistency in lighting across the assessments. We set up our lab to study children in the 1-2 years range, who are very mobile. Caregiver support is therefore crucial in order to keep children focused during testing. In our lab, we allowed children to sit on their caregiver’s lap, 60 cm from the monitor. A comfortable armchair was provided for the caregiver. A computer monitor with the eye-tracker attached was placed on a table that could be raised or lowered to a height appropriate for the child (see Figure 1). Both the table and chair had wheels and brakes; wheels were necessary in order to get the eye-tracker lined up to the child’s position, and the brakes were used to hold the position of the table and chair once established. Caregivers were asked to close their eyes or to look away from the monitor to prevent the eye-tracker measuring their data (see Figure 2).
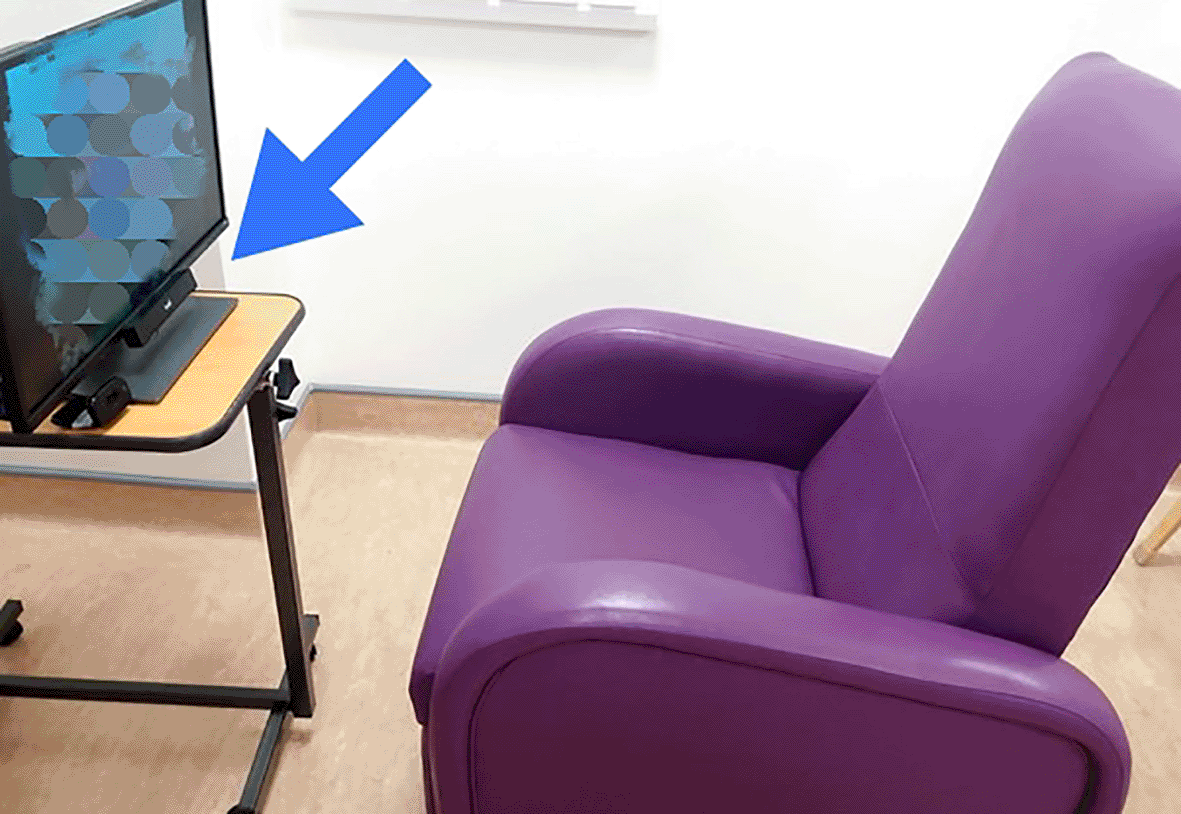
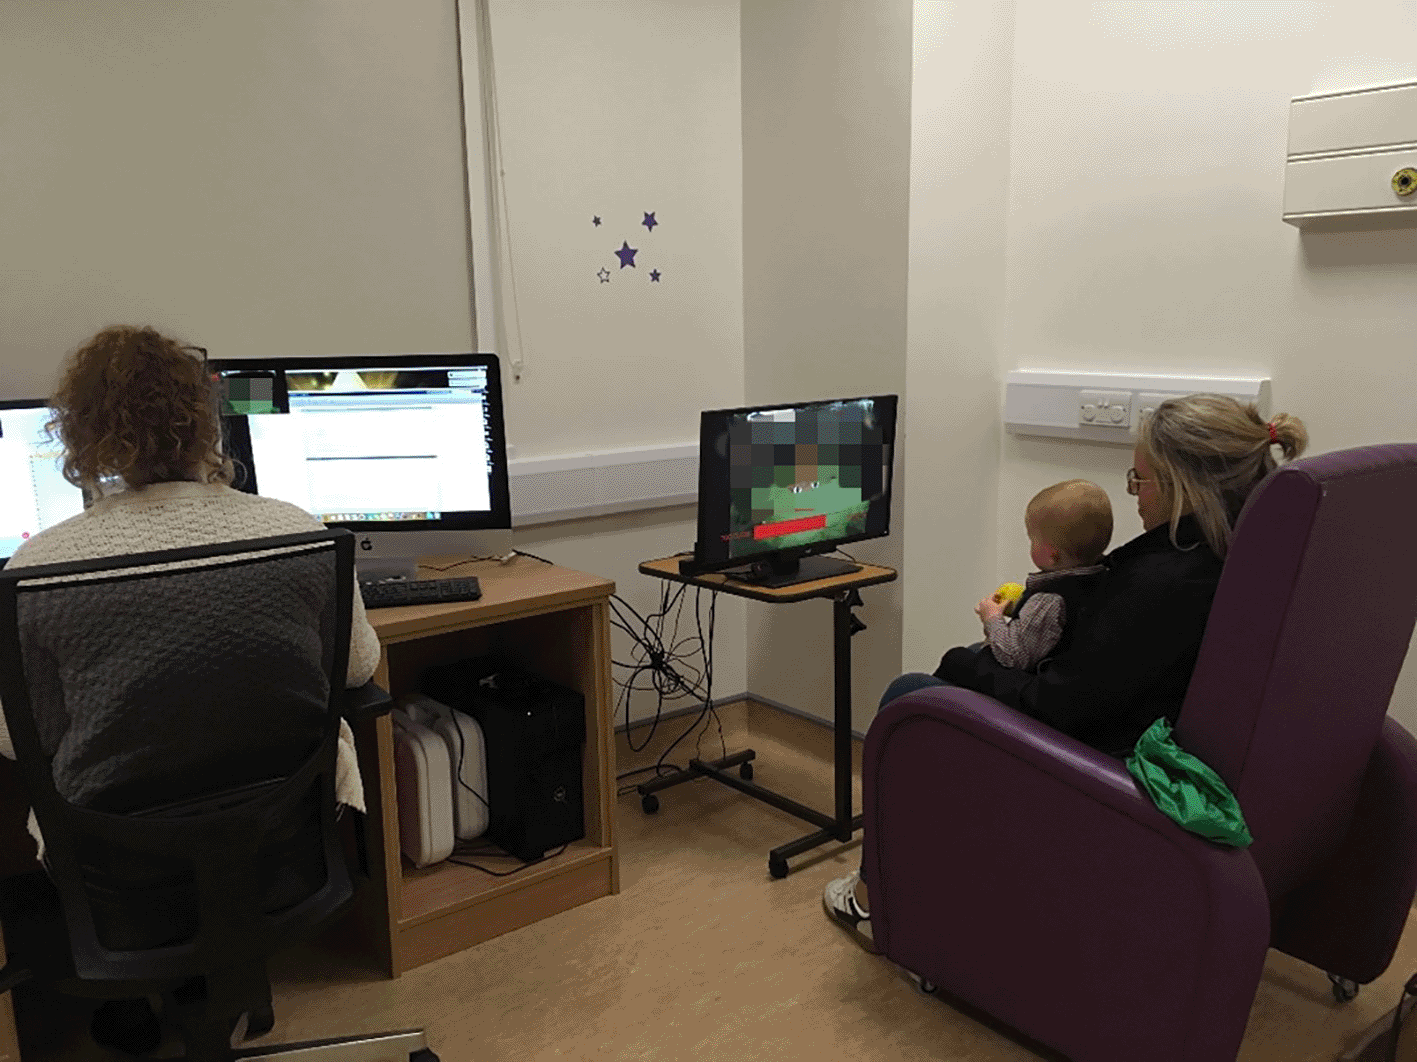
The researcher is sat to the left, monitoring the ET data. Children’ eyes were picked up on the screen. Written consent from the caregiver was obtained for the use of this specific image.
Implementation of a standard operating procedure (SOP) for testing ensures a consistent approach for all study participants. The SOP can be found in the Extended data.
To ensure the SOP and the set-up was appropriate, and to become familiar with the procedure and tasks, we first completed a pilot study. The pilot study (n=5) allowed for the identification of any issues which might affect data acquisition or quality. As a result of this, we identified the need to develop an observation sheet to capture rich qualitative information pertinent to the study objectives.44 This observation sheet allowed us to track when obvious data loss occurred (head turned away, crying, needing a break, eye-tracker capturing caregivers’ eyes etc.) and to track important information about social cognition. We observed, for example, that data loss could occur not only when the child was distracted or had lost interest but also when they were interacting with their caregiver.
A visual acuity test should be completed before the ET assessment to assess visual acuity. This ensures that participants can see the stimuli presented that will be presented during testing. Visual acuity tests in children are quick and easy to perform. In our study, we used the Keeler Visual Acuity Test. Examples of the cards used can be seen in Figure 3. The cards are presented to the child. The side where the child looks first is recorded. This is not a clinical assessment of visual acuity and is only used to ensure sufficient acuity for the ET assessment (acuity card number 5 needed to be completed). If children are unable to complete the acuity test, the ET assessment began, and the acuity test was presented to the child again. If the child was still unable to complete the test, the data collected from this child was excluded from the analysis.
Calibration of the eye-tracker is necessary before data collection for each assessment. Calibration before the start of the assessment allows the eye-tracker to measure the characteristics of the eye and ensures accurate data collection.21,39 There are no standards for calibration in a preverbal cohort which makes it difficult to put protocols in place for evaluating the calibration output and deciding when recalibration is necessary.18 A successful calibration is important as it is a necessary assumption for all ET measures. Good calibration results in good quality data; poor calibration can result in poor quality or unusable data.19 Although standards are lacking, a five-point calibration is most commonly used.9 However, variations in the type of visual stimulus to display and the sequence in which the visual stimuli is displayed can differ between studies. Some ET manufacturers provide a calibration process that is suitable for use in young children, and which provides a pictorial representation of the calibration results for visual inspection. Some manufacturers simply provide a yes/no answer to alert the user as to whether the calibration was successful. If calibration results are not available in pictorial form, then it is difficult to adjust the infant for recalibration, and so these products are not optimal for use with infants and children. The calibration from the Birkbeck ET package was used in our study.
The Birkbeck ET package uses the Tobii Pro SDK to link to the Tobii ET. This is a free software development kit for research applications. Before calibration, the Birkbeck ET program displays a cartoon that allows the assessor to locate the children’s eyes. At the bottom of the screen, a red bar appears with ‘Too far’ and ‘Too close’ written at either end. The infant and the table are adjusted until the bar is half-full and the eyes are in the centre of the screen.
Once satisfied with the position of the infant, the 5-point calibration can begin. Children are shown a moving stimulus in the top-right hand corner, the top-left hand corner, the centre, the bottom-right hand corner, and the bottom-left hand corner of the screen. The stimuli are presented in random order for each calibration. Once the calibration is complete, the programme displays the results. A calibration of 4/5 is deemed acceptable if a 5/5 calibration was not possible to achieve after four attempts.40,41 Figures 4-6 show calibration examples. The calibration process will repeat until accurate ET data can be captured.38 If possible, we recommend running a recalibration throughout the tasks to avoid drift due to movement of child and to ensure high data quality.19
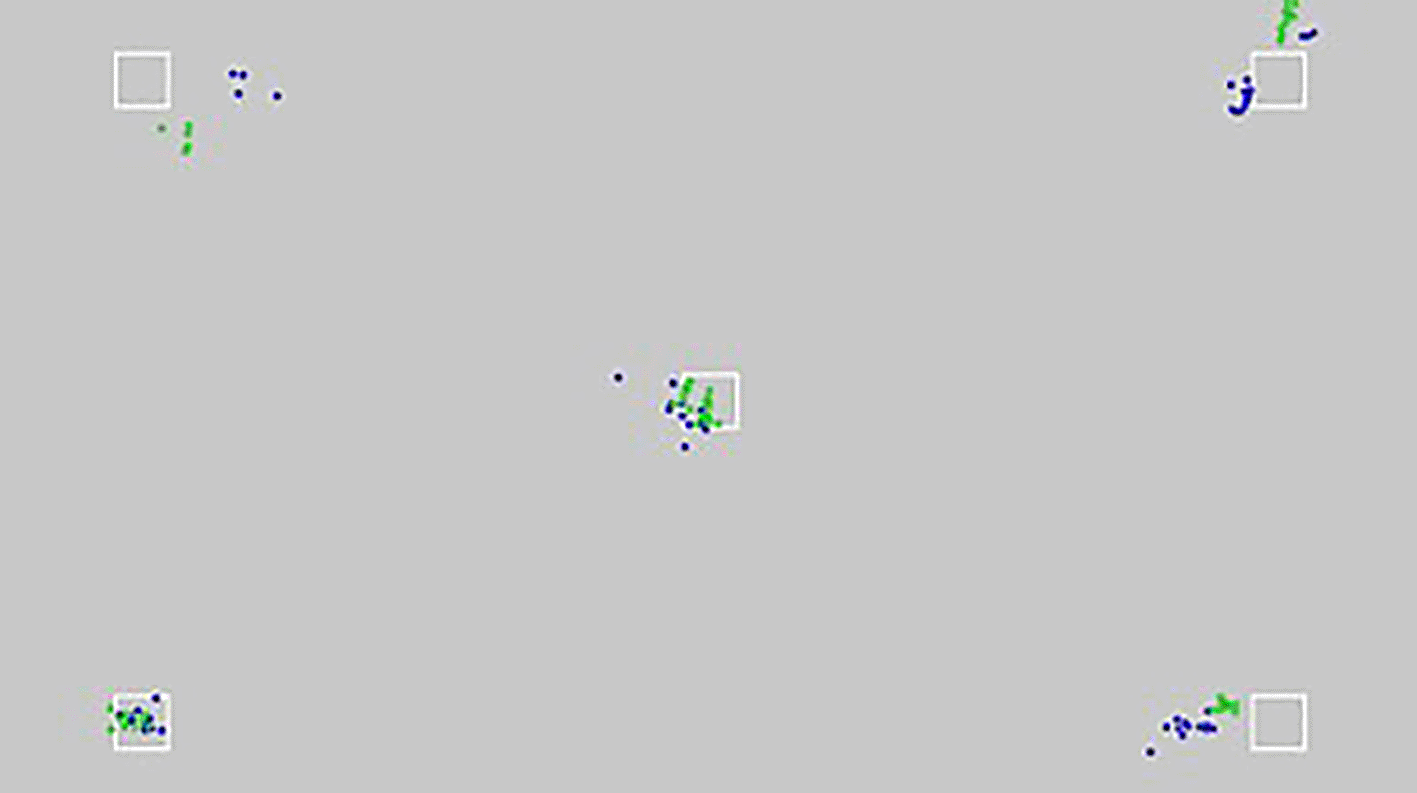
Green points represent the left eye gaze and blue points the right eye.
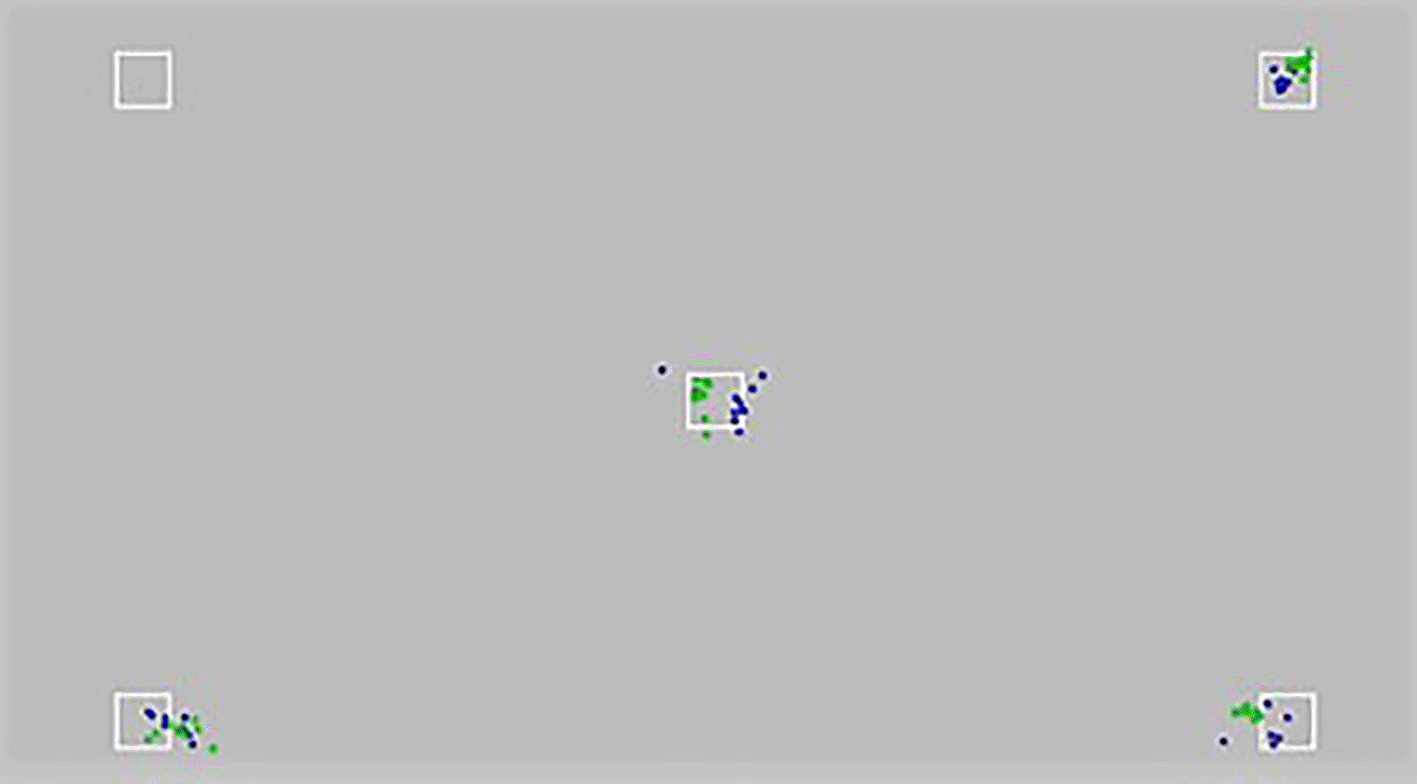
4/5 of the calibration points (white squares) have gaze points within them. Excellent calibration would be when all of the white squares have gaze points inside them.
Data collection can be monitored during the assessment by watching a preview window that appears on the top-left hand corner of the operator’s monitor. If the eye-tracker loses detection of the eyes, the operator pauses tasks and adjusts the position of the child. See Figure 7 for an example of this preview window.
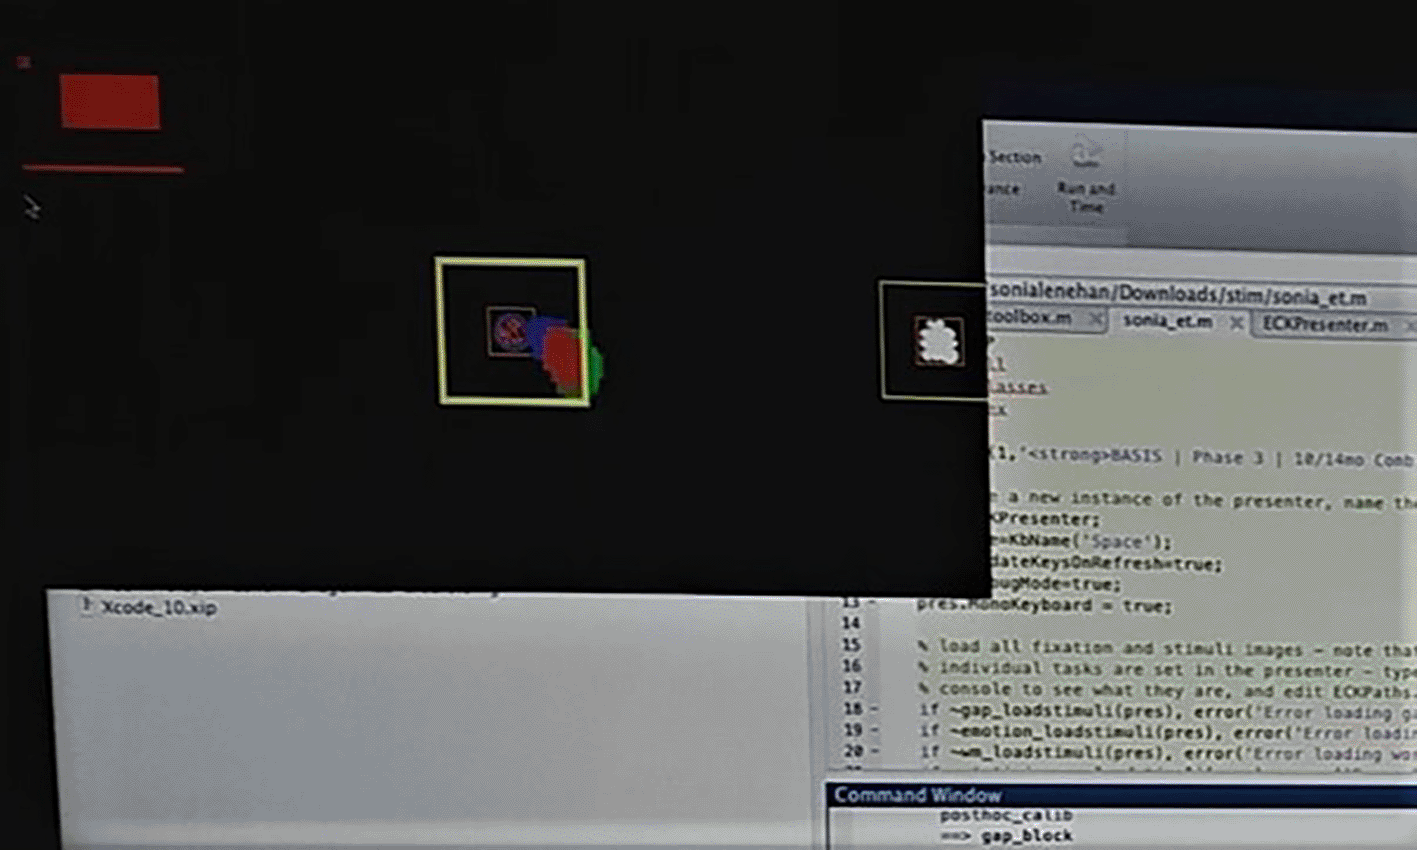
The red, green, and blue dots indicate where the infant is looking. The red rectangle in the top left-hand corner indicates where the infant’s head is in relation to the track box.
This preview window displays the task that is currently being shown, as well as the location of the child’s eyes in relation to the task (see the green, red, and blue dots in Figure 7). When the eye-tracker is unable to pick up the location of the eyes, these dots are no longer visible on the preview window, and the background changes from black to red. In the top-left hand corner of the preview window itself, there is a red rectangle that indicated where the infants head is in relation to the eye-trackers track box. The information gathered from the preview window allows for adjustment of the infant or eye-tracker in real-time to maintain the quality of the ET data.
If a break in the recording is necessary, the tasks can be paused. If the child is distracted or losing attention, an attention-grabbing sound can be played. If the child is unable to complete the ET assessment, the program can be stopped without losing data already collected. Once the assessment is finished, the data will be saved and stored securely. The duration for completion of all tasks should be noted.
To analyse ET data, some data processing of the raw gaze data is necessary.18–20 Multiple steps may be necessary when processing the data to identify fixations, saccades, blinks, and lost data.19,20 Caution is required when processing data, as each step may require decisions that could adjust the definition of the measures and therefore introduce bias into the results. For example, different studies use different fixation duration thresholds ranging from 100 ms–300 ms.20 Hence, it is important that each step is considered carefully and the rationale behind the decision is clear, transparent, and consistent for all participants to allow for reproducibility. The software which will complete the data processing automatically may be provided by the manufacturers. However, it is often not clear how the data is being processed, and decisions such as fixation duration threshold cannot be altered.20 Often, the ET measures generated by the manufacturer’s software are limited and may not be suitable for research. Data can be exported and processed independently, and while it may be more time consuming, it allows for complete control over how the raw gaze data is treated, including the fixation duration threshold and the ET measures generated. Access to expertise in programming is beneficial for data analysis.
We manually remove data of insufficient quality and time points where the eyes were not detected by the eye-tracker. The ET uses validity codes (0-4) to define how certain it is that it has found an eye. The lower the value, the more certain it is. A validity code ≤2 was discarded as per the Tobii Pro knowledge article.42 Gaze data was then split according to the ET tasks used. For a subset of tasks, fixations were calculated using a dispersion-threshold identification algorithm previously used by Krassanakis, Filippakopoula and Nakos43 which is available on the repository GitHub. This algorithm works on the basis that fixation points tend to cluster together due to their low velocity. For our pilot study, the duration threshold was set at 150ms, and a normalised distance measure (t1) of 0.1 was used as the maximum separation distance between points to define a fixation. A t2 (tolerance)23 was estimated from the standard deviation of the cluster of points, which removed outliers from a fixation.
Caregivers who were returning to the INFANT centre for follow-up assessments for their children at 18 months of age were asked if they would like to take part in a pilot study. Five children were recruited. ET data could only be collected from three children as two of the children refused to sit and participate in the assessment. The SOP was followed for each participant and changes were made to the SOP in order to streamline the process and ensure good quality data collection. The data collected included time to first fixation on an AOI, mean duration of fixations in an AOI, percentage number of fixations in an AOI, percentage duration of fixations in an AOI, and saccadic reaction times (SRT). This data was anonymised. The pilot testing was carried out to ensure that the eye-tracker was collecting gaze data and that the methodology proposed worked for an infant cohort. One child completed one block of two tasks and two completed the complete ET assessment. Figure 8 gives a visual representation of the data captured in one of the tasks.
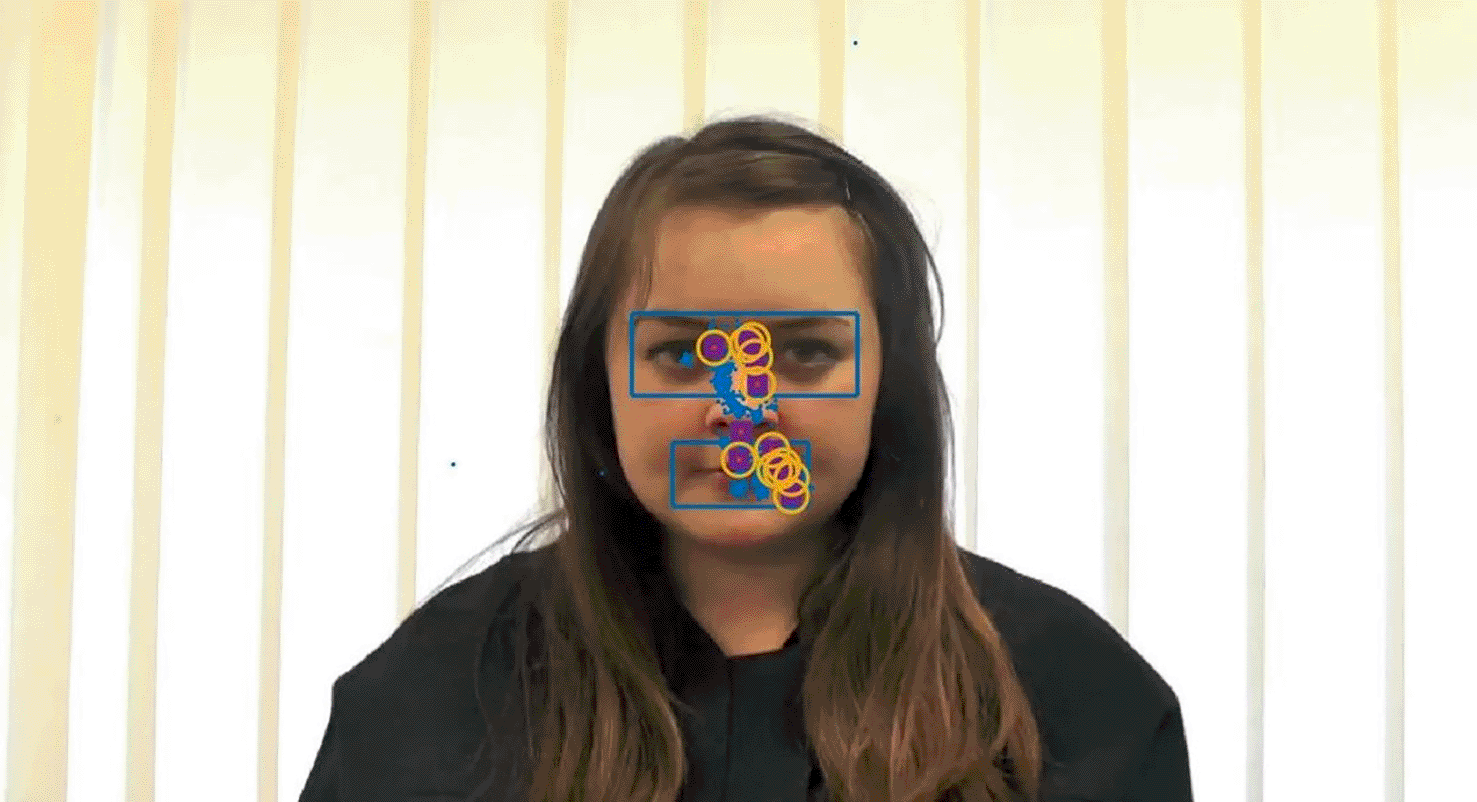
The blue rectangle around the eyes and the mouth indicate that they are areas of interest (AOI). The blue dots indicate gaze data, the purple squares indicate a fixation, and the purple squares that have a yellow circle around them indicate that the fixation is with an AOI.
Table 1 shows the results from two of the tasks that the three children in the pilot study attempted. Two completed these tasks and one completed one out of the two working memory sets, and one out of the five visual attention sets.
While only two out of five children completed ET assessments, our ability to collect the gaze data improved over time. Pilot test IDs 1 and 2 were the first children to participate in the pilot study. While we did not collect data from them, they helped us to improve our methodology considerably and our SOP was updated accordingly. In infant studies, preparation is critical. It is essential to have the ET assessment equipment turned on and ready to go before the participant arrives. Allowing the child to explore the room and have their caregiver sit in the chair facing the eye-tracker improves compliance. If the child was not interested in sitting down, we played the start-up screen for a few minutes to gain the child’s attention. Playing attention grabbers during the assessment helped to redirect the child back to the monitor, playing the stimuli, during assessment. Adapting to the child’s pace proved essential. We saw improvement in the collection of gaze data with pilot test ID 3 while pilot test ID 4 and 5 completed the assessment.
This paper describes the set-up of a new ET lab and outlines the ET methodology used. We have described the challenges of ET assessment in young children and provided a transparent methodology for reproducible results. This paper reports on the eye-tracker, the lab space, the software, and the data processing routine that is necessary for ET studies. We have also clearly described the decision-making process behind each step of the ET set-up and design of the study,17 and provided a detailed methodology, information that is often missing from other studies using ET leading to results that are not reproducible. We hope that this will support reproducible ET data in the future.
Our pilot test provided us with a lot of practical information about our methodology. Small changes such as having the ET assessment equipment turned on and playing, and having the caregiver sit and watch the monitor first meant we went from collecting no data to having the full ET assessment completed. This shows the importance of pilot tests in study design. During pilot testing it also became apparent that in order to ensure good quality data collection, distractions had to be minimal. If at all possible, the child should have no books, toys etc. in their hands. Caregivers should also continue to talk and respond to their child throughout the assessment to limit head turning to seek a response. The necessity of being able to play attention grabbers became apparent during pilot testing, helping to redirect the child’s attention back to the monitor.
To ensure data quality and reproducibility, standard definitions of ET measures need to be established. Standardisation of protocols for calibration and the position of both the infant and the eye-tracker need to be agreed. This will allow for reproducible results, transparent methodology and will ensure data quality between studies. We believe that the establishment of a consortium for infant ET assessment with a view to standardising the definition of ET measures, calibration protocols, and for the sharing of protocols and software is critical for the future of ET research and for the integration of this promising assessment tool into clinical practice.
The strengths of this paper are the identification of software that has been validated in preverbal cohorts. The data quality captured with this software has also been investigated and has been shown to be high across multiple sites.38 This gives researchers an option to use software for research that is beyond that available in commercial eye-trackers. We have recently successfully used our ET methodology to assess a large cohort of healthy 18-month-old children who were born term and moderate-to-late preterm (unpublished data).
We have also identified limitations in our approach, for example, the need for Matlab programming expertise in order to pre-process the ET data. This requires expertise which some labs may not have readily available.
In conclusion, this paper has clearly laid out the ET methods that we have developed and used to explore cognitive development in children. ET is a quick, easy to use, accessible method of assessing cognition in infants and young children. Standardising ET measures and calibration protocols, as well as methods for analysing the data, will allow ET to become a more mainstream assessment tool, allowing for replication of findings and comparison between studies.
UCC endeavours to adhere to the FAIR Data principles and is very keen and willing to make this data open and accessible. To do this, ethical approval will be required in order to make the raw gaze data collected for the cohort available in an open repository. The ethics application process necessitates completing a Data Protection Impact Statement which requires review by the data controller’s data protection officer which may take time. The process of acquiring this approval to allow other researchers access to the data has commenced but in the meantime, we are happy for anyone interested in the raw gaze data to contact the author sonia.lenehan@ucc.ie and we will work with them to fulfil their request. We hope that this process will not take longer than 12 months.
Zenodo: Supplementary materials for: Computerised Eye-tracking as a Tool for Early Neurodevelopmental Assessment in the Pre-Verbal Child, https://doi.org/10.5281/zenodo.5896774.45
This project contains the following extended data:
We would like to thank the research staff at the INFANT research centre who supported this work and all the families who participate in research at the INFANT centre.
| Views | Downloads | |
|---|---|---|
| F1000Research | - | - |
|
PubMed Central
Data from PMC are received and updated monthly.
|
- | - |
Is the rationale for developing the new method (or application) clearly explained?
Yes
Is the description of the method technically sound?
Yes
Are sufficient details provided to allow replication of the method development and its use by others?
Partly
If any results are presented, are all the source data underlying the results available to ensure full reproducibility?
Partly
Are the conclusions about the method and its performance adequately supported by the findings presented in the article?
Yes
Competing Interests: No competing interests were disclosed.
Reviewer Expertise: Psychological methodology, cognition, visual perception
Alongside their report, reviewers assign a status to the article:
| Invited Reviewers | |
|---|---|
| 1 | |
|
Version 1 23 Mar 22 |
read |
Provide sufficient details of any financial or non-financial competing interests to enable users to assess whether your comments might lead a reasonable person to question your impartiality. Consider the following examples, but note that this is not an exhaustive list:
Sign up for content alerts and receive a weekly or monthly email with all newly published articles
Already registered? Sign in
The email address should be the one you originally registered with F1000.
You registered with F1000 via Google, so we cannot reset your password.
To sign in, please click here.
If you still need help with your Google account password, please click here.
You registered with F1000 via Facebook, so we cannot reset your password.
To sign in, please click here.
If you still need help with your Facebook account password, please click here.
If your email address is registered with us, we will email you instructions to reset your password.
If you think you should have received this email but it has not arrived, please check your spam filters and/or contact for further assistance.
Comments on this article Comments (0)