Keywords
Q fever, Q fever vaccine, Bibliometric analysis, Web of Science, Visualization mapping
Q fever, Q fever vaccine, Bibliometric analysis, Web of Science, Visualization mapping
Query fever (Q fever) is a highly infectious zoonotic infection to humans and livestock caused by the etiological agent Coxiella burnetii, an intracellular gram-negative bacterium widespread throughout the world.1,2 Domestic ruminants are believed to be the primary source of Q fever in humans.3,4 In humans, the infection is primarily transmitted via inhalation of aerosols from contaminated soil and animal excrement, most notably parturient fluids.4–9 Consumption, particularly raw milk, is also likely a route of C. burnetii transmission. Although C. burnetii has been isolated from arthropods, primarily ticks, it is unlikely that arthropod-borne transmission of Q fever is significant in humans.5,10 However, C. burnetii can infect other animal species, including pets and birds and cause human cases of Q fever.3,6,8,11 The majority of animal species infected with C. burnetii exhibit no symptoms.4,6 However, in goats and sheep, Q fever's most common clinical manifestations are abortion and stillbirth. Q fever has been linked to sporadic abortion, infertility, and metritis in cattle.6,12 Abortion epidemics in livestock have been reported in endemic regions, resulting in severe economic consequences.1,13,14 Abortion can result in the excretion of up to 1 billion C. burnetii per gram of placenta.15
In humans, the disease presents as an acute flu-like illness with a debilitating headache and cyclic fever as its hallmark symptoms.1,5 The typical signs and symptoms of symptomatic infection include headache, pyrexia, and respiratory tract infection, including atypical pneumonia; hepatitis is also a possibility.16 Chronic infection is well-known, most commonly manifesting as Q fever endocarditis.5,16–18 Correlations between C. burnetii infections and the onset of atherosclerosis, chronic fatigue syndrome, and other cerebrovascular events also have been suggested.1,5,18,19 Despite extensive efforts to develop an effective vaccine against human Q fever, only Q-Vax® is commercially available, and its licensed use is limited to Australia.20–22 Thus, the current study was conducted to explore the global research outputs, research areas, and frontiers, and to establish the visualization mapping of research in the Q fever vaccine.
A bibliometric review followed by a visualized study was conducted (See underlying data).23 The review is reported following the Preferred Reporting Items for Systematic Reviews and Meta-Analyses extension for scoping review (PRISMA-ScR) guidelines.23 The Science Citation Index Expanded (SCI-E) Edition of Web of Science Core Collection (WoSCC) was used to search for relevant publication on the Q fever vaccine as of October 16, 2021. The Web of Science (WoS) is the world's oldest database belonging to the commercial provider.24,25 Currently, the WoS is hosted by Clarivate Analytics.26 The WoSCC database is a selective citation index of scholarly and scientific publishing covering books, data compilations, proceedings, and journals.25 The WoSCC is a commonly used database for bibliometric studies.27–33 Previously published bibliometric studies conducted in medical and health sciences and other areas used SCI-E Edition of the WoSCC.34–37 Therefore, in the current study, SCI-E Edition was utilized.
The following keywords were used: “Q fever” OR “Query fever” OR “Coxiella burnetii” OR “Coxiella-burnetii” OR “C. burnetii” (Topic) AND “Vaccine*” OR “Immunize*” OR “Immunis*” (Topic). The searches were performed without any limitation in the topic field. The Topic field searches title, abstract, author keywords, and keywords plus.
We extracted many attributes such as author name, year of publication, journal, document type, institution, and country. The data were downloaded both in Comma-separated value and Tab delimited files. The collected information was entered into a Microsoft Excel spreadsheet, and the values were presented in frequencies and percentages.
The data were exported in Tab delimited file into VOSviewer software version 1.17.1 for macOS for network visualization mapping. VOSviewer is a widely available tool for network visualization, overlay visualization, and density visualization mapping.38 The retrieved data were plotted for co-authorship countries, co-occurrence keywords plus, and bibliographic coupling sources network visualization mapping. After plotting the data, clusters were formed, and each color designates a different cluster. The minimum cluster size for co-authorship countries was fixed at 10. The countries with zero total link strength (TLS) were excluded from the plotting. The thicker line between the countries represents the stronger collaboration, while the larger node or label represents the higher the weight vice versa.39 The co-occurrence of a keyword plus was selected at 5. The keywords plus terms are generated from the titles of articles/documents cited by the author of the article being indexed. The articles/documents whose references are not linked to source items will not have keywords plus.40 The data were further plotted for bibliographic coupling sources based on the cited references. The minimum number of items of a source was selected at 5. Alongside network visualization, the density visualization mapping was generated. In density visualization, same as network and overlay visualization, the items are represented by their label. In density visualization, each point has a color that represents the density of items at that point. In the neighborhood of a point in density visualization, the larger the number of items, and the weights of the neighboring items, the closer the color of the point is to yellow color.39
The initial search retrieved a total of 478 documents, and all the documents were included in the final bibliometric analysis and visualization mapping. The documents were published in nine languages: English (n=436), German (n=20), French (n=11), Czech (n=3), Dutch (n=3), Russian (n=2), Italian (n=1), Polish (n=1), and Slovak (n=1).
The included publications were cited 12,434 times (26.01 average citations per item) and 9,378 times without self-citations (19.62 average citations per item). The overall H-index value was 51 in the published documents. The most productive year of publications was 2014 (n=33, 884 citations), while the most cited year was 2020 (n=20, 1,026 citations), as shown in Figure 1. The documents published in 2021 (n=20) were cited 817 times.

The majority of the documents were published as original/research articles (n=391), followed by review articles (n=51), and proceeding papers (n=24) (Figure 2A). The most studied research areas were immunology, veterinary sciences, and infectious diseases (Figure 2B). The most prolific author was Kazar J (n=17) (Figure 2C) and most of the article published in Acta Virologica (n=23) (Figure 2D).
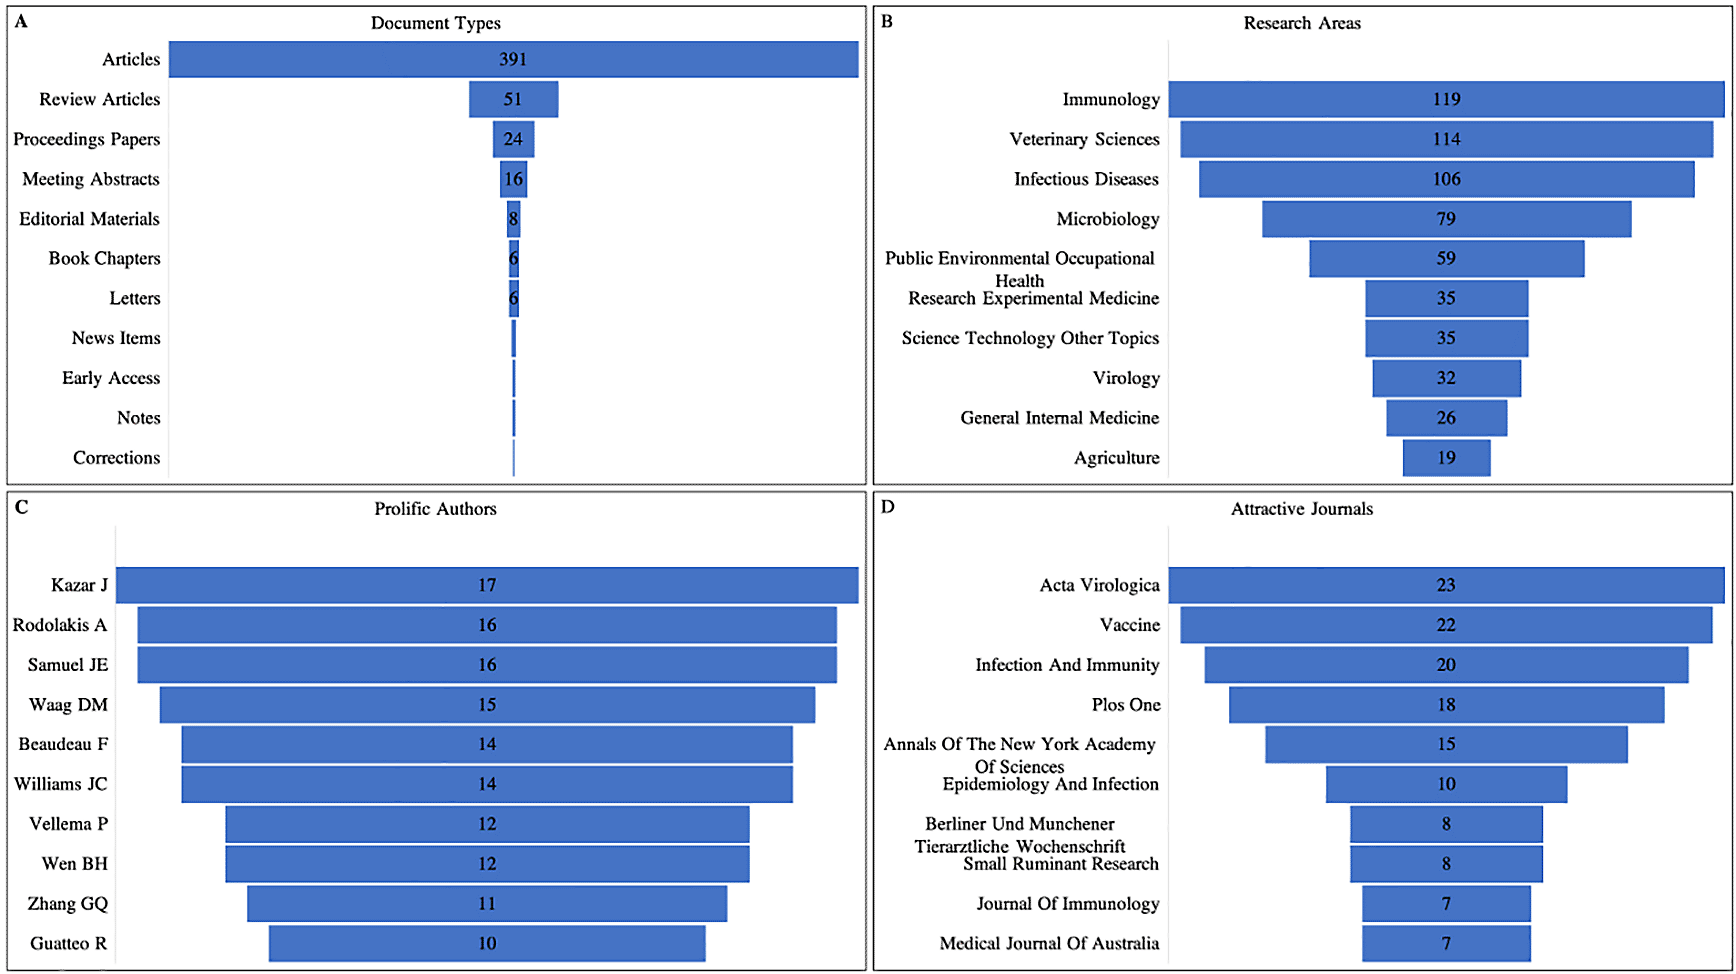
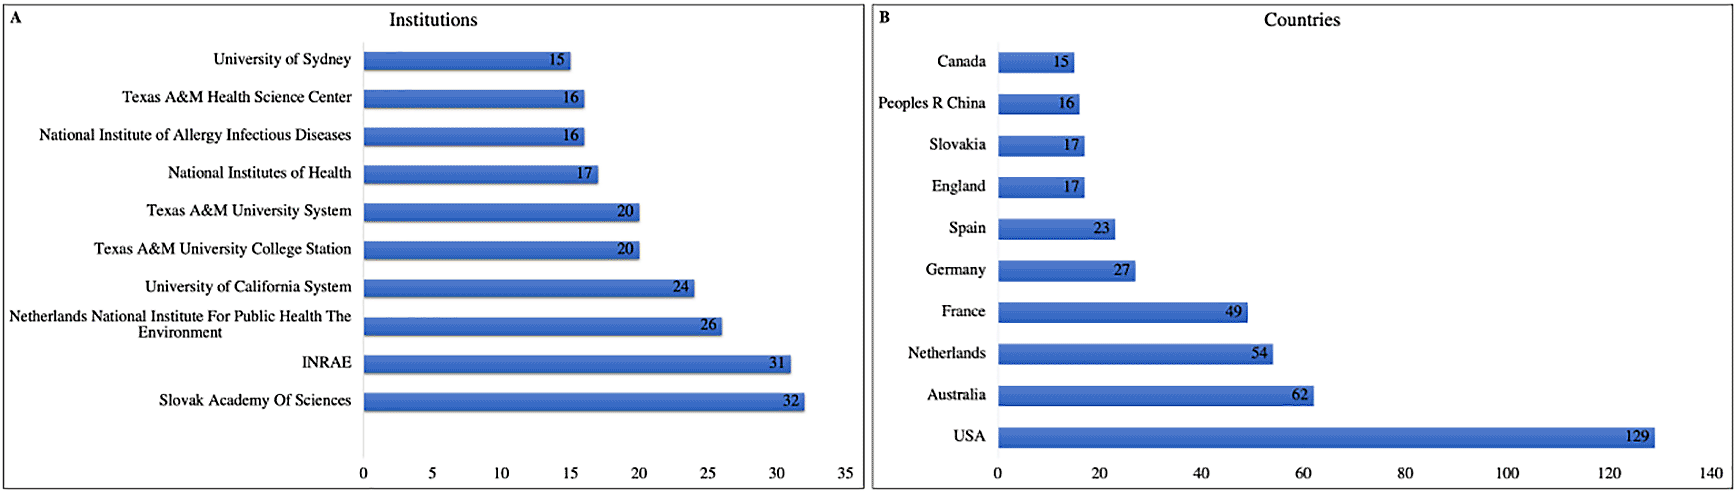
In total, 60 records did not contain institution names, while 34 records did not contain country names. The institution with the most publications (n=32) was the Slovak Academy of Sciences (Figure 3A). The top three leading countries in Q fever vaccine research were the USA (n=129), Australia (n=62), and the Netherlands (n=54), as shown in Figure 3B.
Of the total countries, 18 countries with TLS zero were excluded from the mapping. For the rest of the countries, the TLS ranged from 1 to 36. USA was the leading country with the highest TLS with other countries (n=36), followed by Netherlands (n=28), Switzerland (n=27), France (n=21), and England (n=21). A total of two clusters were formed; cluster 1 consists of 23 countries, while cluster 2 had 16 countries (Figure 4).

Of the total keywords plus, only 105 met the criteria. At the same time, the cluster size was fixed at 10. A total of four clusters were formed; cluster 1 consists of 45 keywords plus, followed by cluster 2 (n=23), cluster 3 (n=20), and cluster 4 (n=17) (Figure 5). The widely used keywords plus based on occurrence and TLS was Q-fever (n=110, TLS=402), followed by Coxiella-burnetii (n=77, TLS=266), infection (n=67, TLS=338), vaccination (n=64, TLS=287), and an outbreak (n=57, TLS=275).

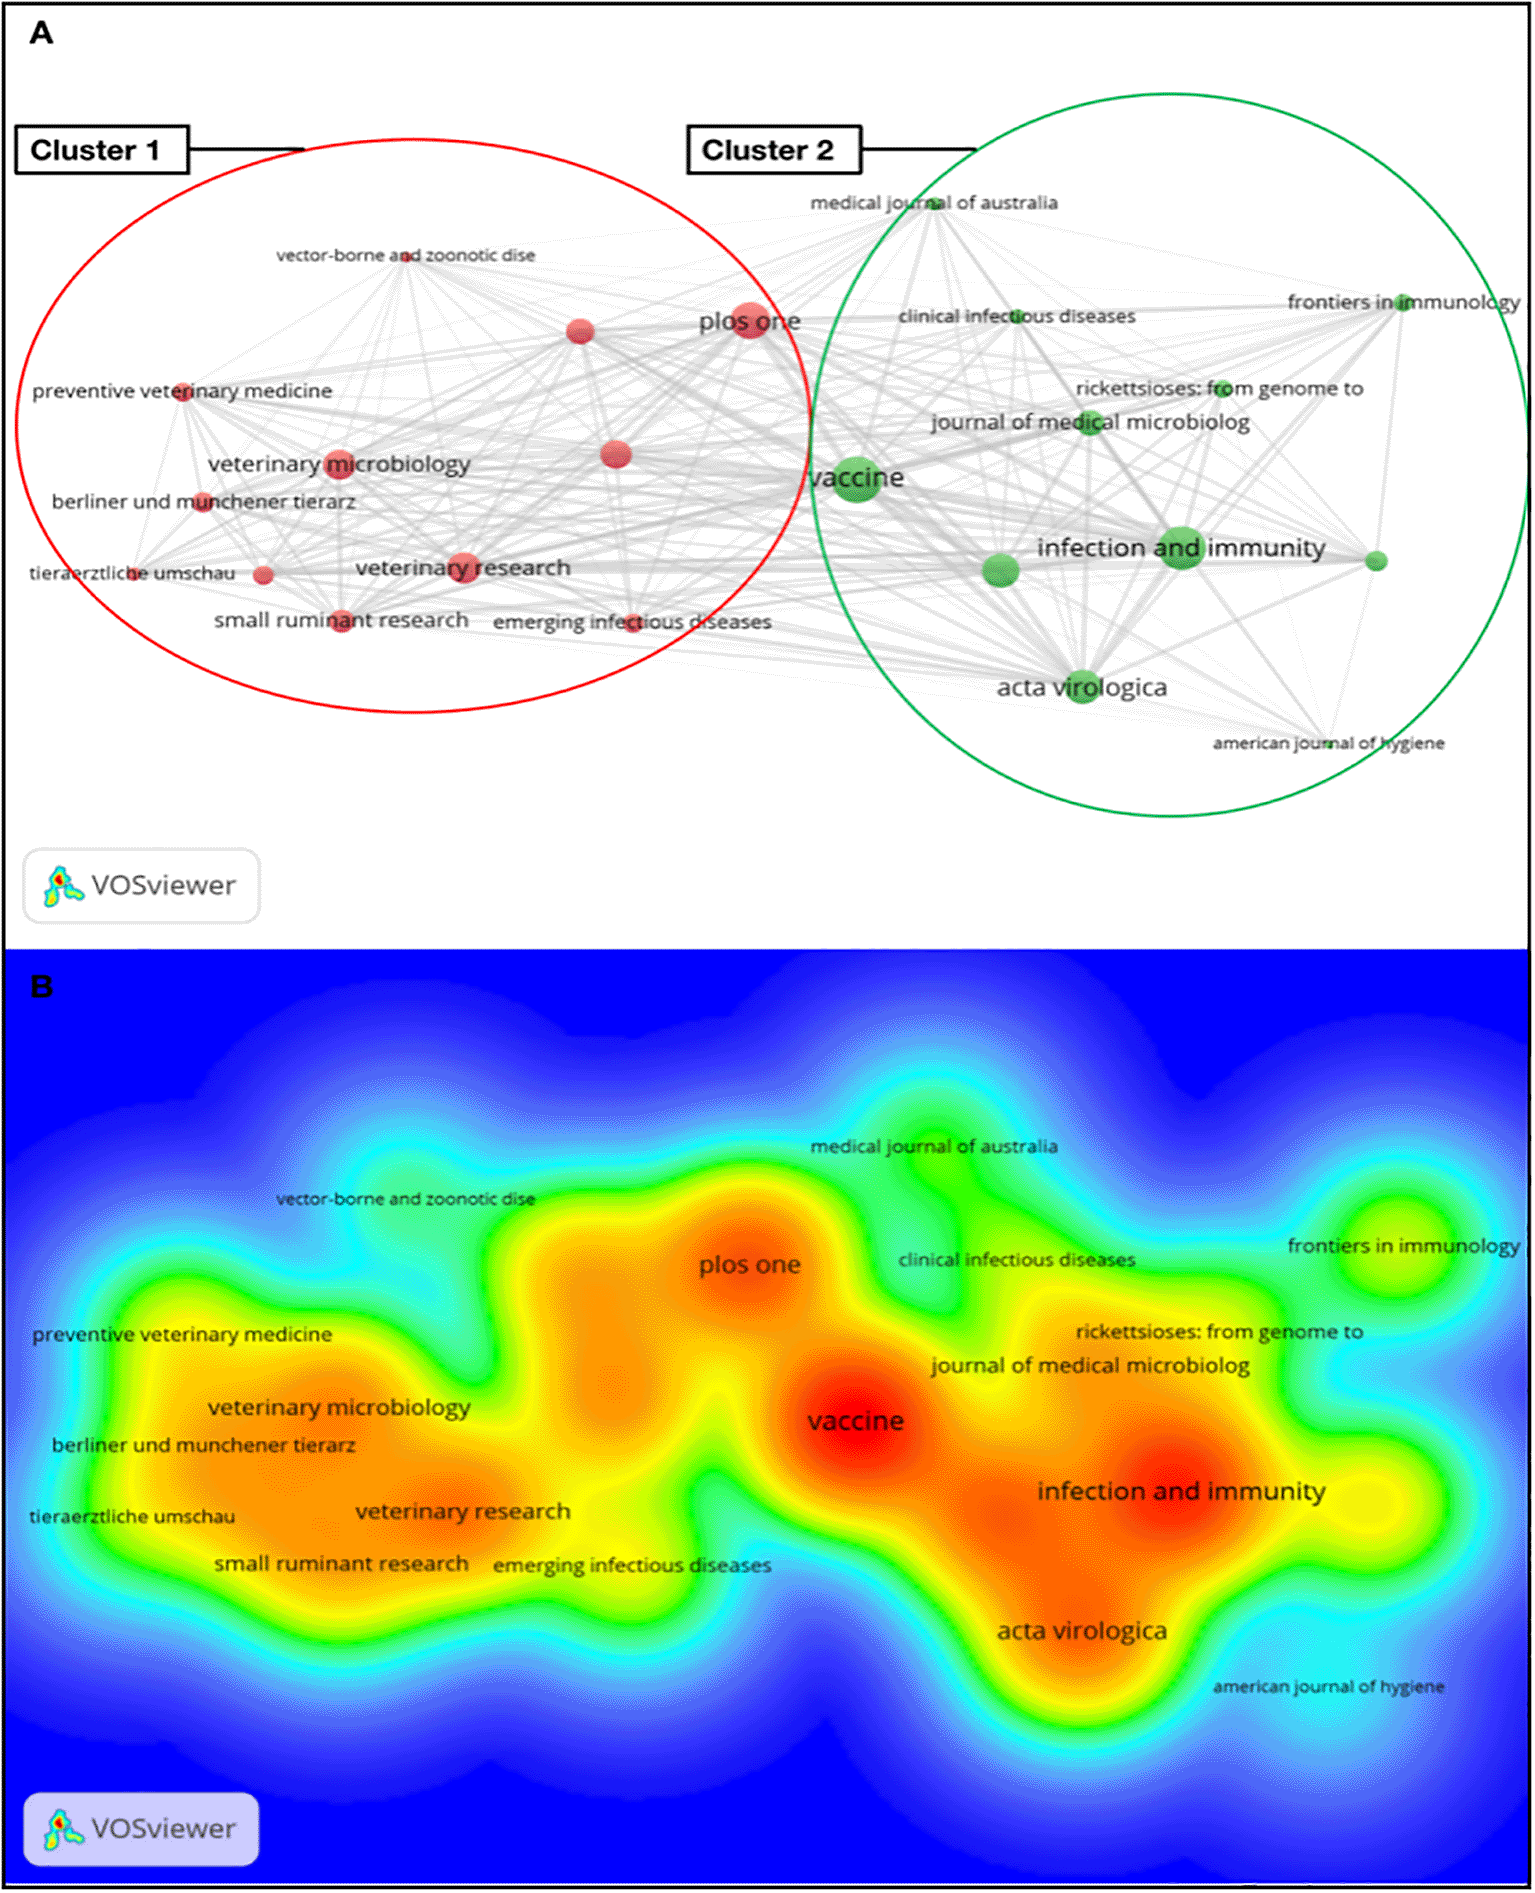
Of the total publication sources, only 23 met the criteria and were plotted. Two clusters were formed; cluster 1 consisted of 12 items, while cluster 2 had 11 items. Based on TLS value, Vaccine, Infection and Immunity, and PLOS One were the leading sources of publication (Figure 6).
This study has analyzed Q fever vaccine research trends and characteristics from 1941 to 2021. The key topics and research type in Q fever vaccine, main contributors and generators of knowledge in this field, and collaborations among researchers were presented. This study has shown an increase in publications and citations on Q fever vaccine research, especially for the last 20 years. This mirrors the trend of increasing vaccine-related publications throughout the years.41 However, publications on Q fever vaccinations are lagging other infectious diseases such as Ebola and HIV.42,43 This might be due to the status of Q fever as a neglected and understudied disease.44
The top research areas on Q fever vaccination include immunology, infectious disease, and microbiology. Furthermore, keyword analysis revealed that research areas include epidemiological surveys and pathophysiologic and genetic studies. This signifies the importance of fully understanding the disease entity to generate knowledge for vaccine production.22 Also included in the top research areas are veterinary sciences, public environmental, occupational health, and agriculture. This relates to the importance of Q fever not only for human health but also for the industry, particularly agriculture and animal husbandry.45
The USA is the leading country in terms of the number of publications in Q fever vaccination. Furthermore, 8 out of the top 10 leading institutions in the field are from the USA. This is consistent with the high scientific productivity of the USA across different fields.46 The USA is currently the country with the highest research expenditure and highest gross domestic product, which might explain its high productivity on research.47,48 Moreover, we have shown that USA authors had the highest TLS with other countries, signifying its rich collaborations. Cooperation and collaboration have been shown to correlate well with increased research productivity.49
Notably, some countries with a high disease burden, including Morocco, Zimbabwe, and Nigeria, are not the countries with the highest research production.44 This indicates an imbalance can be seen between research production and the burden of disease. Therefore, there is a need to increase research activities among these countries to provide more evidence on Q fever.
Most of the top 10 journals in the Q fever vaccine field are international journals. Furthermore, 6 out of the top 10 journals have an impact factor greater than 3.0. Journal selection is influenced by different factors including journal ranking system, reliability of reviewing, university and national policies, usefulness of reviewers’ feedback, and research funding bodies.50
This is the first bibliometric study to summarize the global research output and trends in the Q fever vaccine indexed in WoSCC. The key bibliometric indices and visualization mapping were generated. This study used a single database WoSCC which may bias the results. Therefore, further studies are recommended to utilize multiple databases to evaluate the publication frequency and citation analysis.
This study used bibliometric analysis to provide an insight on the Q fever vaccine research, worldwide. In the past two decades, a rapid increase has been observed in Q fever vaccine publications and citations. USA was the leading country, and immunology was the most studied research in this field. The current study will provide standard bibliographic information and keystone parameters in Q fever vaccine research.
Figshare: Bibliometric analysis and network visualization mapping of global research in Q fever vaccine.
DOI: https://doi.org/10.6084/m9.figshare.18316595.23
This project contains the following underlying data:
Q-fever data.text: (Data of the publications downloaded from the Web of Science that were used in this bibliometric analysis study)
Figshare: PRISMA-Scoping review checklist for “Bibliometric analysis and network visualization mapping of global research in Q fever vaccine”
DOI: https://doi.org/10.6084/m9.figshare.18316595.23
Data are available under the terms of the Creative Commons Attribution 4.0 International license (CC-BY 4.0).
| Views | Downloads | |
|---|---|---|
| F1000Research | - | - |
|
PubMed Central
Data from PMC are received and updated monthly.
|
- | - |
Provide sufficient details of any financial or non-financial competing interests to enable users to assess whether your comments might lead a reasonable person to question your impartiality. Consider the following examples, but note that this is not an exhaustive list:
Sign up for content alerts and receive a weekly or monthly email with all newly published articles
Already registered? Sign in
The email address should be the one you originally registered with F1000.
You registered with F1000 via Google, so we cannot reset your password.
To sign in, please click here.
If you still need help with your Google account password, please click here.
You registered with F1000 via Facebook, so we cannot reset your password.
To sign in, please click here.
If you still need help with your Facebook account password, please click here.
If your email address is registered with us, we will email you instructions to reset your password.
If you think you should have received this email but it has not arrived, please check your spam filters and/or contact for further assistance.
Comments on this article Comments (0)