Keywords
Bioindicators, habitat quality, Lake Wanchi, physiochemical parameters, water quality
This article is included in the Ecology and Global Change gateway.
Bioindicators, habitat quality, Lake Wanchi, physiochemical parameters, water quality
Lakes provide important ecosystem services to lakeside communities including water for domestic use, irrigation, etc. (Naiman and Décamps, 1997; Hood and Naiman, 2000; Raburu et al., 2009). However, most Ethiopian lakes are being threatened by anthropogenic activities such as deforestation, agriculture, urban runoff, and discharge of untreated waters from point sources (Zhang et al., 2015).
Physico-chemical analysis has been used as a water quality monitoring and ecological assessment tool for many years in many countries including Ethiopia. However, the use of biological quality elements (BQE) or indicators in monitoring and assessment studies is capturing attention as the traditional methods are quite expensive and demand well-trained expertise (Valentine et al, 2011). Biological indicators are increasingly used to assess the effect of anthropogenic activities on aquatic ecosystems. Particularly macroinvertebrates are a good indicator of several anthropogenic pressures in the aquatic ecosystem (Armitage et al., 1983; Armitage et al., 1990) as they reflect not only the quality of the water but also the ecological healthiness of the ecosystem (Rosenberg and Resh, 1993).
Several types of research have been done so far on Ethiopian rivers concerning the use of macroinvertebrates in water quality and ecological assessment. For instance, Beneberu (2013) developed a macroinvertebrates-based multimetric index in some selected rivers of Ethiopia as indicators of environmental stress. Lakew (2015) assessed anthropogenic impacts using benthic macroinvertebrates as bio-indicators in Central Highland Streams of Ethiopia. Sitotaw (2006) used various macroinvertebrate metrics and habitat scores in the assessment of environmental degradation in some rivers of Ethiopia. However, little research has been done so far on the use of benthic macroinvertebrates in the assessment and monitoring of Ethiopian lakes (e.g. Gashaw and Mengistu, 2012).
Lake Wanchai is one of the Ethiopian lakes that have huge ecological, socio-economic and aesthetic value. Although pollution and environmental degradation in the lake is increasing over time, no monitoring study and management action has been undertaken in the lake. Therefore, this study was conducted to investigate the impact of several stressors on the ecology of the lake using a macroinvertebrate community structure-based index.
This study was conducted in Lake Wanchi (Figure 1), which is found in the Oromia region, Southwest Shewa (Degefu et al., 2014). The lake is located at 8°47′N and 37°53′E at an altitude of 2887 m a. l. and 150 km Southwest of Addis Ababa, the capital city of Ethiopia. It has a surface area of 5.6 km2. The lake has a closed basin with no surface inlet (Degefu et al., 2014). Walia and Jalewan rivers are the only two outlets of the lake (Shube, 2011). The littoral zone of the lake is characterized by submerged aquatic macrophytes, mainly Potamogeton sp. (Degefu et al., 2014) and Typha latifolia (emergent aquatic plant) (Singanan et al., 2008). The lake receives water primarily from rainfall and subterranean cold and hot springs. Generally, the lake region is characterized by a sub-humid climate with an annual rainfall of 1200 mm (Degefu et al., 2014).
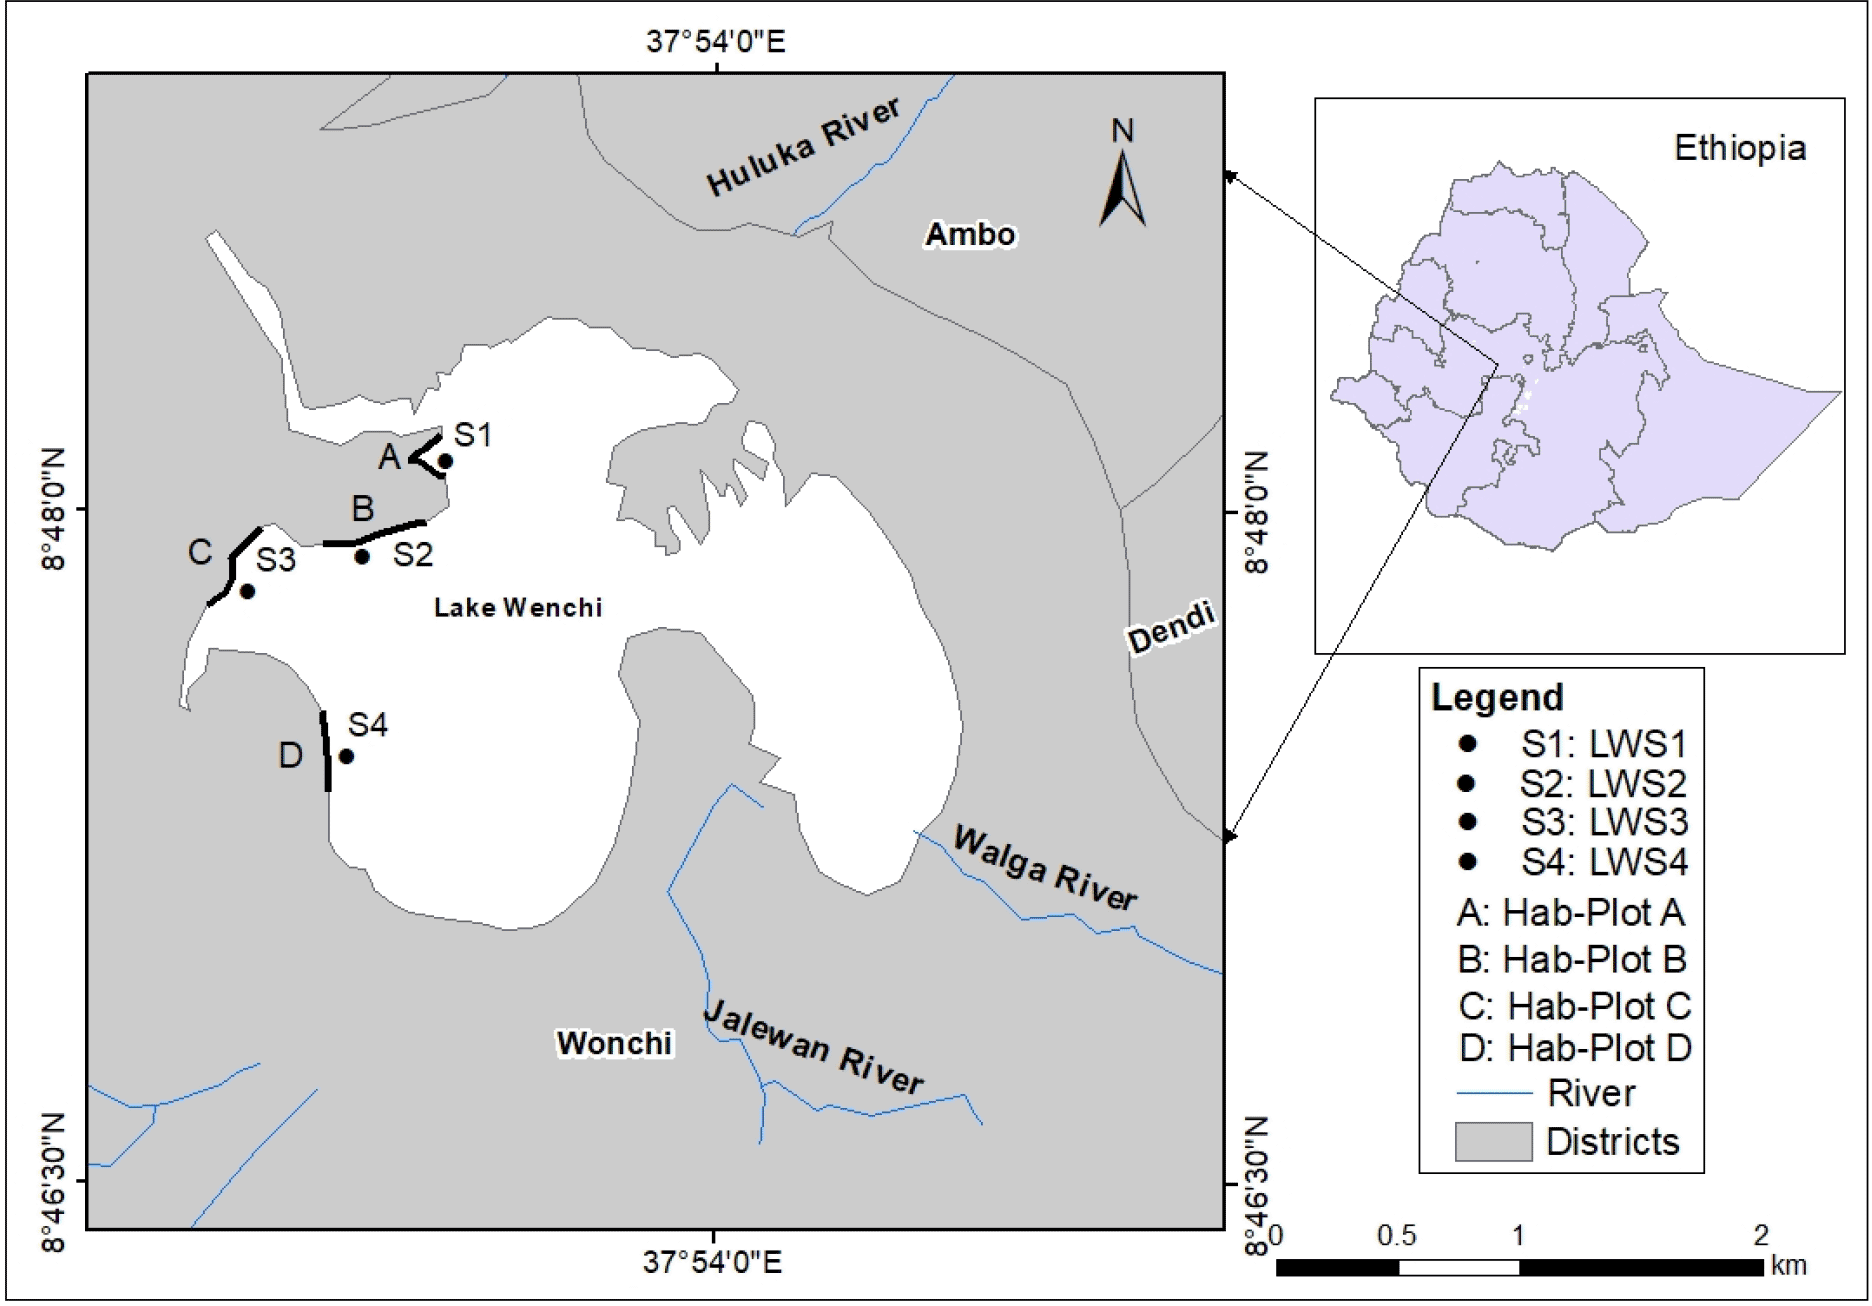
A preliminary survey was conducted in September 2016 to gather general information on the physical characteristics of the study area such as lake features, watershed features, littoral vegetation, and human pressures. Accordingly, sites for habitat quality assessment were selected purposely based on the stressor types (distance from human settlement and anthropogenic effects) and accessibility for a quantitative study. For habitat quality assessment, four habitat plots: hab-plot “A”, hab-plot “B” hab-plot “C” and hab-plot “D”were selected following Lake Habitat Survey (LHS) (Table 4) procedure as outlined in SNIFFER (2004) and McGoff and Irvine (2009). The selected four hab-plots cover approximately 1000 m: about thirteenth of the total shoreline length of 13 km. Each hab plot covers 250 m of shoreline length. The assessment was done visually and scored through observation. The assessment was done by boat to manage the work and time. The four habitat plots are:
Hab-Plot”A”: This plot is located the Northwest of Lake Wanchi. It is mainly exposed to agricultural associated impacts. The site lacks vegetation coverage because of intensive deforestation.
Hab-Plot”B”: This site is a free grazing area and is dominated by domestic animals. Typha latifolia was the dominant macrophyte in littoral part. Little riparian vegetation existed on this site.
Hab-Plot”C”: This hab-plot is found in the valley parts of Lake Wanchi at which untreated wastes (improper waste dumping) from Wanchi Village flow into the lake both via runoff and a small stream that joins the lake. Densely populated submerged aquatic macrophytes (Potamogeton) and riparian vegetations cover this site.
Hab-Plot“D”: This hab-plot is located in the Southwest parts of Lake Wanchi. Human interference was minimum compared to the other sites. Potamogeton and Typha latifolia are common aquatic macrophytes and the riparian vegetations are also well developed.
For physicochemical and macroinvertebrates, the sampling sites were selected based on distance from human settlements, anthropogenic effect, and accessibility for a quantitative study. For macroinvertebrate sampling, four sampling sites were purposely selected following USEPA rapid bioassessment protocol criteria (Barbour et al., 1999). Sites were coded as LWS1, LWS2, LWS3, and LWS4 where, “LWS” represents Lake Wanchi Site, 1, 2, 3, and 4 respectively. The posterior classification approach (based on measured/recorded abiotic and biotic variables) was used for the selection of reference and impaired sites following the procedure outlined in Barbour et al. (1996). This approach is widely utilized as it allows the comparison of metrics response to various levels of impairments.
Water samples were collected with a 1L plastic bottle from each site, labeled with a collection point, stored in an icebox before analysis, and transported to Addis Ababa University, Limnology Laboratory. Water samples were filtered through 0.45 μm glass fiber filters (GF/F) except for total phosphorous (TP). Then the concentration of Nitrate (mg-1) and phosphate (μgL-1) were measured using cadmium reduction and ascorbic acid methods respectively as outlined in APHA (1999). Dissolved oxygen, electrical conductivity, and water temperature were measured on-site using a pre-calibrated HACH multimeter hand-held probe (Model: HQ40D). The pH of the water was also measured on-site using a pre-calibrated portable pH meter (Model: HI96107).
Water transparency was determined using a standard Secchi disc of 20 cm diameter with black and white quarters. The turbidity of water in all sampling sites was determined using a turbidity meter (Model: 2100P, Hach Company, USA).
The study focused d the shallow part of the lake; hence D-frame net of mesh size 500μm was used to sample macroinvertebrates. Sampling was done at monthly intervals between December 2016 to February 2017. The net was moved vigorously on the target sampling area for about five minutes to dislodge the macroinvertebrate attached to the macrophyte or sediment (Baldwin et al., 2005). Macroinvertebrates were sorted out from other debris preserved in 70% ethanol and transported to the Zoological Sciences Laboratory of Debre Berhan University (DBU), Department of Biology for identification and enumeration. Macroinvertebrates were identified at the family level using a combination of available keys (Gerber and Gabriel, 2002; Bouchard, 2012).
In the present study metrics representing richness, composition, tolerance/intolerance, functional feeding group, and diversity measures (Shannon Weiner diversity index (SDI) were screened and examined for index development of Lake Wanchai. The metric selection was performed using a stepwise process involving assessment of their variation, redundancy, and sensitivity (Chihart, 2003; Tasew, 2007). Metrics with strong correlation (r>0.80) are considered as redundant metrics and hence only one metric was retained for further assessment in the index development procedure as in Burton and Gerritsen (2003). Box-and-whisker plots, which enabled visualization of variations in the metric ranges were used to estimate the ability of metrics to discriminate between reference and impaired sites. The discriminatory power of each remaining metric was determined according to the degree of overlap of medians and interquartile ranges (Barbour et al., 1996). Metrics that displayed no overlap of interquartile ranges were considered to have good discriminatory power. Metrics with a moderate overlap of interquartile range but at least one median outside the interquartile range over was were considered to have moderate discriminatory power while metrics with an extensive overlap of interquartile range or both medians within the overlap were considered to have no discriminatory power to distinguish between reference and test sites (Barbour et al., 1996). Metrics with good and moderate discriminatory power were considered in the final index development while those with extensive quartile overlap were rejected.
Metric scoring was based on a continuous scoring method (Buchanan et al., 2011). Each metric’s raw value at each sampling site was individually scored on a continuous scale (0-100) reference gradient scoring approach as outlined in Buchanan et al. (2011). Likewise, the reference gradient scoring approach uses the 5th and 95th percentile of each metric’s raw value in the reference community samples in a given region to create a linear scale. For metrics that decrease in value with disturbance, the 5th percentile of the reference was assigned a score of 0 and the 95thpercentile of the reference was assigned a score of 100. Metric values less than or equal to the 5th percentile and greater than or equal to the 95th percentile were scored 0 and 100, respectively. Metric values between the 5th percentile and 95th percentile were scored proportionally from 0 to 100 according to the equation:
re = recorded value; ref = reference valueWhere X is the metric value (the observed metric’s raw value: could beat impaired or reference site), X95 is the 95th percentile value, and X5 is the 5thpercentile value. The reverse was done for metrics that increase with disturbance. Metric values less than or equal to the 5th percentile of the reference are given a score of 100, values greater than or equal to the 95th percentile of the reference was scored 0, and values between the 5th percentile and 95th percentiles are scored proportionally according to the equation:
ref = reference valueFinally, the sum of all core metrics scores at each sample site was averaged by the number of total metrics used for index development to obtain a final index or B-IBI score of Lake Wanchi. Recall! 95th percentile or in the numerator was calculated from the metric value (the observed metric’s raw value) of each site for the metrics that decrease in value with disturbance, but the 95th percentile or in the numerator was calculated from the metric’s raw value of the recorded at reference site for the metrics that increase in value with disturbance. 95th percentile or and 5th percentile or in the denominator part was calculated from the observed metric’s raw value of the reference site; it was calculated using the observed metric’s raw value of LWS 4 in this case. Although there was no ideal health ecosystem, the reference site has better robustness and was given a score of 1000 relatively for comparison purposes. He is an example of how to calculate BIBI for LWS 1.
Habitat features guided by photographs and descriptions were scored according to Lake Habitat Survey (LHS) score per hab-plot for lake Wanchi (SNIFFER, 2004; McGoff and Irvine, 2009) (Table 4). This assessment was done for validation of the response of the macroinvertebrate-based index of biotic integrity.
The habitat features were quantitatively assessed and explained numerically in percentage as in SNIFFER (2004) and McGoff and Irvine (2009). The diversity index, evenness was assessed using Shannon and Wiener (1949) and Pielou (1966), respectively. Redundancy analysis (RDA) was used to investigate the relationship between macroinvertebrates and environmental variables. The response of metrics to water quality parameters was analyzed using the Mann-Whitney U test. The sensitivity of the multimetric index was determined by assessing whether there was clear discrimination among the classified site group using box-and-whisker plots. Pearson’s correlation analysis was also used to identify relationships between the index scores and environmental variables. Descriptive statistics were used to analyze biological data. The statistical software (SPSS version 20) was used for the statistical analysis.
In most cases, there was variation in the concentration of measured environmental variables between impacted and less impacted sites (Table 1). The value ranged between 4.74×10⁻²-13.8(±0.1) × 10-2mg L-1 for ammonia (NH3-), 0.136-0.141mg L-1for nitrates (NO3-) and 1.62×10⁻²-1.65 × 10⁻² mg L-1 for ammonia (NH3-). The mean value for soluble reactive phosphorous (PO43-) and total phosphorous (TP) varied from 2.25 × 10⁻³-2.38 × 10⁻³ μgL-1 and 1.91 × 10⁻³-3.55 × 10⁻³ μgL-1, respectively. The minimum and maximum mean values were 54(±13) cm and 84(±10) cm for Secchi depth reading, respectively. 1.07 NTU and 2.37 NTU for turbidity, 22.5(±0.3)°C and 23.5(±0.5)°C for temperature, 7.20 and 8.70(±0.09) for pH, 6.95(±0.03) and 7.95(±0.02) mgL-1 for dissolved oxygen (DO), 54.40(±0.205) μS/cm and 55.40(±0.3) μS/cm for conductivity. The mean value varied among sites although there was no significant difference (p < 0.05) (Table 1).
A total of 1249 macroinvertebrate individuals representing 15 families were identified in the present study. Three taxa comprised the non-insect group (Hydrobiidae, Physidae, and Planorbidae), and the rest 12 taxa represented insect families. The reference site was rich in taxa (15), while the most impaired site was represented by only 5 taxa. Low Shannon diversity index was recorded at LWS3 (H′=1.08) (Table 2).
Among the candidate, metrics tested five metrics (number of Ephemeroptera taxa, number of Trichoptera taxa, % Ephemeroptera, % Trichoptera and SDI) were excluded mainly because they had comparatively low values. The metrics that were eliminated for failing to distinguish between reference site and impaired sites were: Odonata individual taxa, % Tolerant taxa, and % Scraper taxa. The % ETO was retained because this metric was frequently used in index development. The % Hemiptera taxa and % to taxa were redundant with each other and hence only percent of Hemiptera taxa were retained. The % Scrapers taxa were redundant with no, families. The number of families was retained as it is frequently used in index development.
We also included % of Scraper as the metric distinguished very well reference sites from that of moderate. Metrics such as no. families, % Scraper, and % Gatherers displayed no overlap of interquartile ranges and hence considered to have good discriminatory power for identifying reference sites from impaired. ETO individual and % Hemipera showed moderate overlap of interquartile range but had at least one median outside the interquartile range overlap and hence were considered to have moderate discriminatory power. The following metrics (No. Families, ETO individuals, % Hemiptera, % Scraper, s and % Gatherers.) were considered as core metrics and used for final BIBI development. The line between good and fair was taken from the quartile section of the 75th percentile of the reference site (LWS 4) (3/4 × 100 = 75). The 25th percentile of the reference site (1/4 × 100 = 25). The BIBI scores ranging from 25 to 75 were classified as good whereas, scores that are greater or equal to75.55 were categorized as very good. Scores less than the 25th percentile of the reference site (1/4 × 100 = 25) were classified as fair (Table 3).
The first axis of PCA expressed 97.8% of the faunal variation whereas the second axis explained 92.5% of the variation. The result of RDA indicated a strong relationship between macroinvertebrate metrics and environmental variables. The first axis of RDA is positively correlated with turbidity, phosphorous, and total phosphorous. However, the following taxa (Baetidae, Corixidae, Scirtidae, Pyralidae, and Hydrobiidae) were negatively correlated with turbidity and phosphorous. The Notonectidae and Physidae taxa were positively correlated with turbidity and phosphorous (Figure 2).
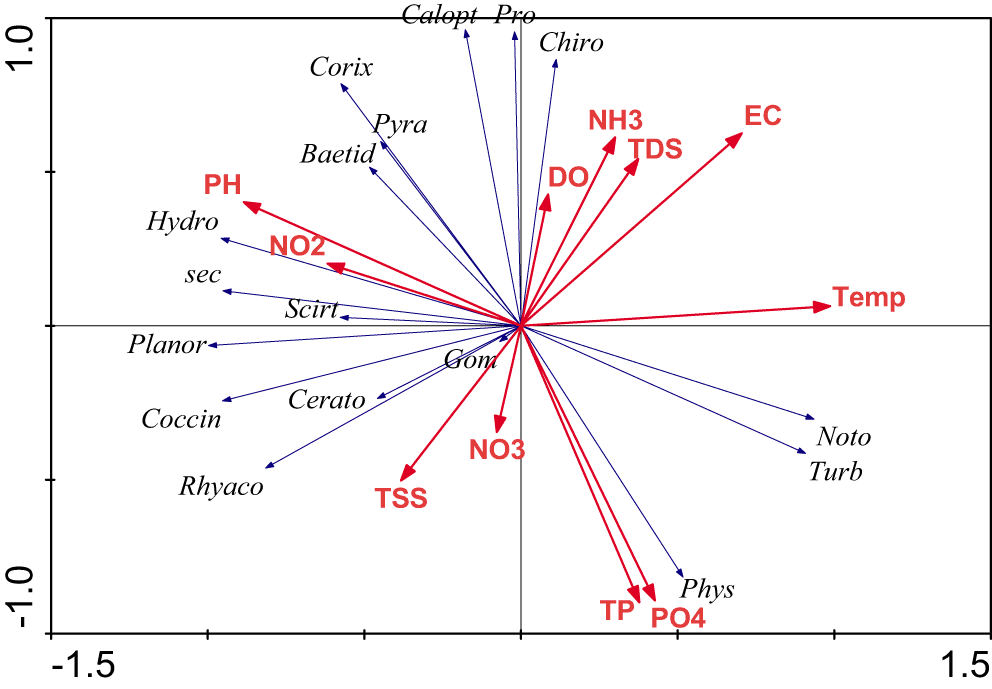
Abbreviations: Gom = Gomphidae, Pro = Protoneuridae, Noto = Notonectidae, Baetid = Baetidae, Chiro = Chironomidae, Corix = Corixidae, Cerato = Ceratopogonidae, Calopt = Calopterygidae, Coccin = Coccinellidae, Rhyaco = Rhyacopilidae, Scirt = Scirtidae, Pyra = Pyralidae, Phys = Physidae, Hydro = Hdrobiidae, Planor = Planorbidae, pH = Hydrogen ion, DO = dissolved oxygen, EC = electric conductivity, NH3- = ionized ammonia, NO3- = nitrate ion NO2- = nitrite ion, PO43- = phosphate ion, Tp = total phosphorus, TSS = total suspended solid, TDS = total dissolved solid, Sec = Secchi depth, Temp = Temperature, Turb = Turbidity. Different colors were required to identify macroinvertebrate families and environmental variables.
The watershed of Lake Wanchi was highly exposed to various levels of degradation. The riparian vegetation removal was more intensive in hab-plot “A” compared to the other hab-plots in the region of Lake Wanchi (Table 4). The result of the comparability habitat assessment and the developed index classified sites into three water quality: fair, good, and very good. Various activities have been observed on the sites such as riparian vegetation clearance, nutrients inlet through flooding, loss of physical habitat structure, and changes in littoral cover, commonly associated with lakeshore. These anthropogenic activities, therefore, affect the distribution and diversity of macroinvertebrates.
One way to assess the water quality of the aquatic ecosystem is by measuring the conventional environmental variables. The measured environmental variables of Lake Wanchi were within the optimum range for the growth and survival of aquatic life in the tropics (Mugo, 2010; Katsallah, 2012; Godswill, 2012). However, Secchi depth showed a dramatic change from 54(±13) cm at LWS1 to 84(±10) cm at LWS 4. The turbidity at site LWS1 was comparable with that of Lake Naivasha (Mugo, 2010). The relatively high turbidity at site LWS 1 might be due to siltation from the catchment as the watershed is highly degraded.
Biological monitoring based on various aquatic biotas may be more effective than measuring water chemistry alone because the organisms integrate the chemical and physical properties of streams over time, which could be overlooked by one-time water chemistry sampling. In the present study 1249, macroinvertebrate individuals representing 15 families were recorded. Three taxa (Gastropod Families; Hydrobiidae, Physidae, and Planorbidae) accounted for the non-insects whereas the rest 12 taxa were represented by insect families. Alpha diversity was higher (13 taxa) at the reference site (LWS4) compared to the impaired site with only 5 taxa (Table 2). This study found different compositions, distribution, and assemblage of macroinvertebrate taxa between reference and impaired sites. This might be due to the influence of physicochemical parameters. A study on the relationship between environmental factors and macroinvertebrates suggested that community composition depends on environmental factors related to habitat, water chemistry, resource partitioning, and predation (Dall et al., 1984; White and Irvine, 2003; Olomukoro and Oviojie, 2015). Usman (2015) also found that particulate matter in fresh or marine waters causes siltation and smothering of benthos and interference with the feeding of bivalve filter feeders.
The family Planorbidae was the most abundant taxa throughout the study period. This may be due to their tolerance toward pollution or substrates. This observation is in line with the work of Strong et al. (2008) who stated that Planorbidae has a secondary gill (pseudobranch) and efficient respiratory pigment (hemoglobin) enabling the taxa to exploit oxygen-depleted environments.
As a higher number of family taxa (richness) was recorded at site LWS 4, the Shannon diversity index was expected to be higher. But that was not the case compared to LWS 1 and LWS 2 sites. The presence of relatively well-structured riparian vegetation at the less impacted site could harbor predators, particularly arthropods which are potential predators to aquatic macroinvertebrates. This can affect the abundance as well as the index value as the index takes into account both richness and evenness (Shannon and Weiner, 1949) For instance Burdon and Harding (2008) found a strong negative correlation between riparian arthropod predators and aquatic insects. Similarly, Strayer and Findlay (2010) observed that the terrestrial side of the shore zone often contains large numbers of predators that feed on emerging aquatic insects and aquatic predators affect the distribution, abundance, and behavior of their prey. The correlation between measured environmental variables and metrics was not consistent. This might be because of the variability of the environmental variables among sites. A similar finding was presented by Yorulmaz et al. (2013) in the Esen River in Turkey where metrics differentially respond to biotic and abiotic factors.
The riparian vegetation removal was more intensive in hab-plot “A” compared to the other hab-plots in Lake Wanchi (Table 4). The percentage comparability habitat assessment and index of biotic integrity categorized sites into three quality ranks: LWS 1 as fair, LWS 2 and 3 as good, and LWS 4 as very good. Various activities have been observed on the sites such as riparian vegetation clearance, nutrients inlet through flooding, loss of physical habitat structure, and changes in littoral cover, commonly associated with lakeshore. These anthropogenic activities could affect the distribution and diversity of macroinvertebrates which in turn influence the total score. This observation agrees with Degefu et al. (2014) who stated that Lake Wanchi was becoming a tourist destination, with a corresponding increase in newly erected resorts and tourist facilities which remove riparian communities and make aquatic biodiversity vulnerable. Hampton et al. (2011) also indicated that the rapid response of nearshore habitats could serve as an early warning signal before deteriorations in water quality happen. The current study also revealed that less density and abundance of macrobenthic fauna were found at site LWS 1. This was in agreement with Kaufmann et al. (2014) who reported reductions in physical habitat structural complexity can deleteriously affect aquatic macroinvertebrates.
Lake Wanchi has started to show signs of degradation and water quality deterioration due to ongoing human activities and a lack of appropriate management. The biological assessment also depicted the presence of anthropogenic impacts in the lake. A total of 1249 benthic macroinvertebrate individuals representing 15 families were recorded in this study. This work demonstrated that the composition and distribution of the macroinvertebrate community varied depending on physicochemical parameters along a gradient of human pressure. It was observed that the responses of macroinvertebrate communities were good indicators for assessing ecosystem integrity. The value of the benthic index of biotic integrity separated the sites into three quality ranks according to the levels of human exposure. The study, therefore, provided information on macroinvertebrates community-based assessment and set a basis for a lake water quality monitoring framework that can inform managers and other decision-makers at the local and national levels on taking integrated ameliorative and preventive measures so that the lake is used sustainably. The authors recommend identification of the taxa to the lower level and further study is needed to understand the seasonal effects on the distribution and abundance of macroinvertebrates.
All of these authors were working in collaboration during data collection, analysis, and manuscript writing; even now during submission of this manuscript, the cooperation is going on.
Figshare. Macroinvertebrate-based index of biotic integrity for assessing the ecological condition of Lake Wanchi, Ethiopia. DOI: https://doi.org/10.6084/m9.figshare.19503709.v2 (Kuma et al., 2022)
This project contains the following underlying data:
- Lake Wanchi is one of the Ethiopian lakes that have huge ecological, socio-economic and aesthetic value. Although pollution and environmental degradation within the lake is increasing over time, monitoring and management actions have not been undertaken within the lake. This study was conducted to assess the ecological condition of Lake Wanchi using the macroinvertebrate-based index of biotic integrity between September 2016 and should 2017. Four sampling sites (LWS 1, LWS 2, LWS 3, and LWS 4) were purposively selected. A rapid bioassessment protocol criterion was accustomed to categorize the sites. About 1249 macroinvertebrate individuals were collected using the D-frame net with a mesh size of 500μm. Physico-chemical analysis was also done to assess the link between the benthic macroinvertebrate structure and environmental factors within the system. The benthic index of biotic integrity ranged from 37.78 to 75.55 and also the sites were categorized into three quality ranks: LWS 1 as and 3 fair, LWS 2 as good, and LWS 4 as very good. The study confirmed that Lake Wanchi was largely influenced by agricultural and other anthropogenic factors. This study concluded that the benthic index of biotic integrity is an appropriate tool for water quality and ecological assessment in the lakes.
Data are available under the terms of the Creative Commons Attribution 4.0 International license (CC-BY 4.0).
| Views | Downloads | |
|---|---|---|
| F1000Research | - | - |
|
PubMed Central
Data from PMC are received and updated monthly.
|
- | - |
Provide sufficient details of any financial or non-financial competing interests to enable users to assess whether your comments might lead a reasonable person to question your impartiality. Consider the following examples, but note that this is not an exhaustive list:
Sign up for content alerts and receive a weekly or monthly email with all newly published articles
Already registered? Sign in
The email address should be the one you originally registered with F1000.
You registered with F1000 via Google, so we cannot reset your password.
To sign in, please click here.
If you still need help with your Google account password, please click here.
You registered with F1000 via Facebook, so we cannot reset your password.
To sign in, please click here.
If you still need help with your Facebook account password, please click here.
If your email address is registered with us, we will email you instructions to reset your password.
If you think you should have received this email but it has not arrived, please check your spam filters and/or contact for further assistance.
Comments on this article Comments (0)