Keywords
Resonance, Flaw seeding, Cracks, Contact cracks
Resonance, Flaw seeding, Cracks, Contact cracks
The field of non-destructive testing (NDT) is critical to many industries, with several new techniques emerging. These offer new and commercially relevant solutions for flaw detection, but require validation on controlled specimens. For these emerging techniques and other established methods, there is a need for options which quickly and reproducibly create multiple test pieces with embedded flaws.
Embedding flaws into test pieces can be achieved using methods such as thermal cycling, mechanical fatigue, or chemical processes. Localised thermal fatigue is one method which uses repeated heating and cooling cycles on a small area to generate thermal fatigue cracks,1 which may be particularly representative of flaws in high temperature environments such as power stations.2 More common are mechanical techniques such as notching, where crack-like flaws are machined, or fatigue cracking, where a cyclic load initiates crack mechanisms at a fraction of the ultimate tensile strength. These two methods may achieve similar results for some NDT techniques; however, notches are often not representative of real-life flaws and conventional fatigue processes require a large number of cycles to complete.3 Other methods use chemical processes such as hydrogen induced cracking, where hydrogen diffuses into the metallic structure causing weakness and internal pressure, resulting in internal cracking.4,5 All of these processes generally give rise to flaws of uncontrolled dimensions.
The recent additive manufacturing (AM) standard ISO/ASTM/TR 52906:20226 notes that “there is currently no proven method for controlled and replicable seeding of intimate disbonds (sometimes known as “kissing bonds”) – where two surfaces are in intimate or close contact, but with compromised adhesion”. This holds true for conventional manufacturing methods in addition to AM. These intimate disbonds are also known as “contact cracks”, or “stealth flaws”, because they are difficult to detect using established NDT techniques. Figure 1 shows such features formed by hydrogen embrittlement.
This paper describes a system which rapidly introduces contact cracks of controlled dimensions into metallic coupons using a combination of static and dynamic loading. After the flaws were created their presence was confirmed destructively, using Scanning Electron Microscopy (SEM) on a representative selection.
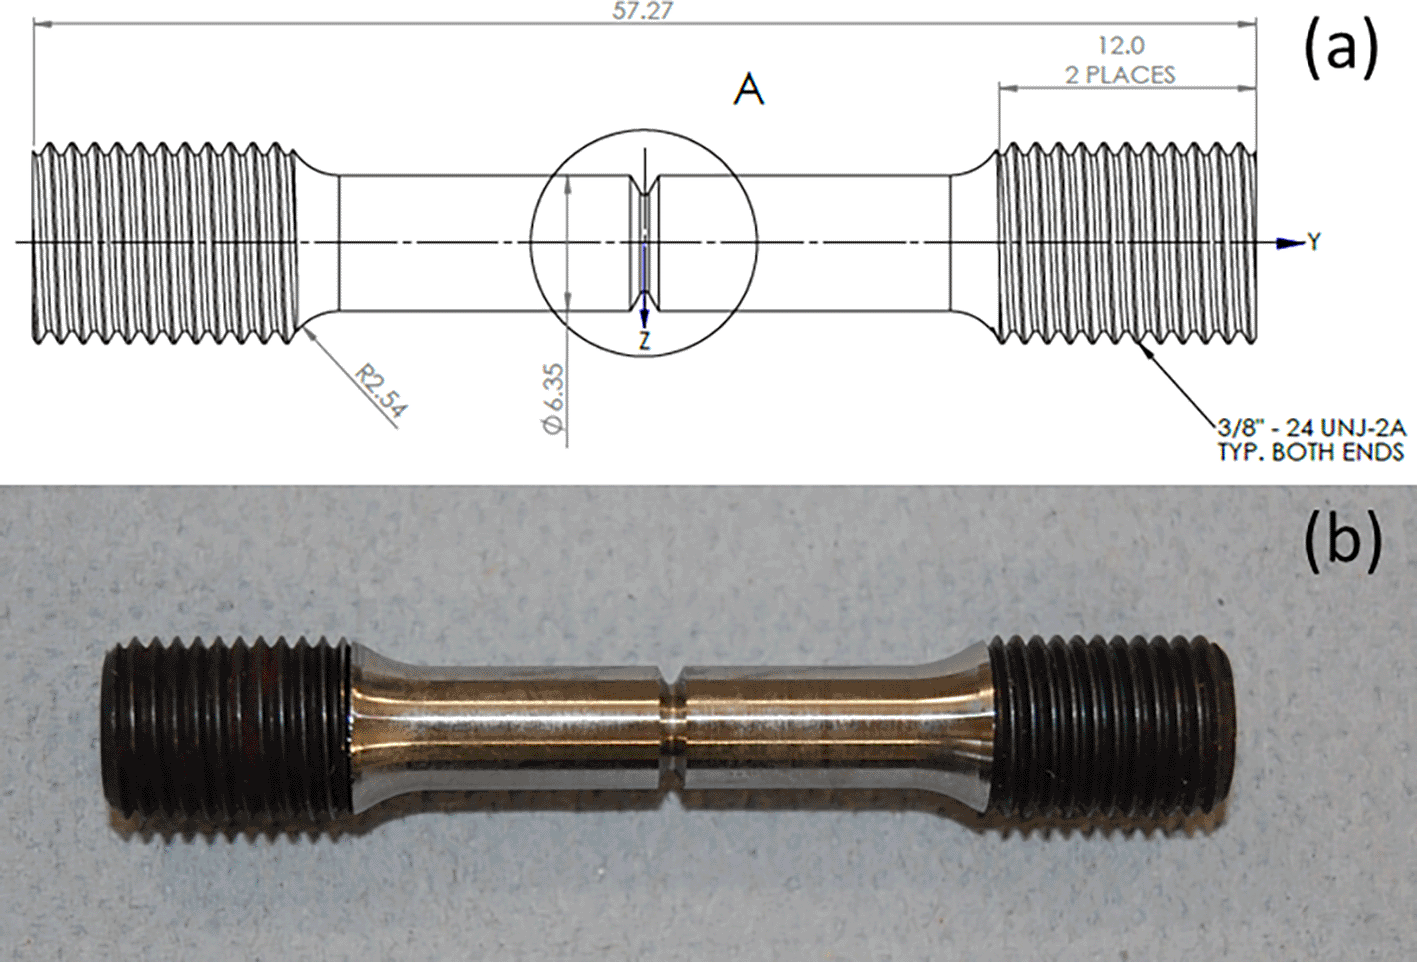
ASTM F519-18 Type1a.1 tensile coupons7 were chosen as the host test pieces. The coupons were procured from Green Specialty (Green Specialty Service Inc, Joshua, Texas, US) and provide a standardised geometry with an incorporated stress-raising notch in the centre (Figure 2).
The key to successful implementation is to approach the local ultimate tensile strength of the material, in order to initiate the fatigue cracking process. By exploiting resonance in the coupon, strain profiles are more readily controlled and amplified: targeting different resonance modes will place the stress maxima in different locations. However, for the chosen coupon the first natural frequency occurs at approximately 6.6 kHz, where displacements (and hence strain energies) will be low. In order to accentuate the excitation energies, it is necessary to mass-load the coupon to reduce the natural frequencies significantly. Under these conditions the first flexural mode offers a low complexity, low frequency vibration. This mode maximises stress in the notch by imposing high strain due to the high displacement associated with low frequency modes (Figure 3).
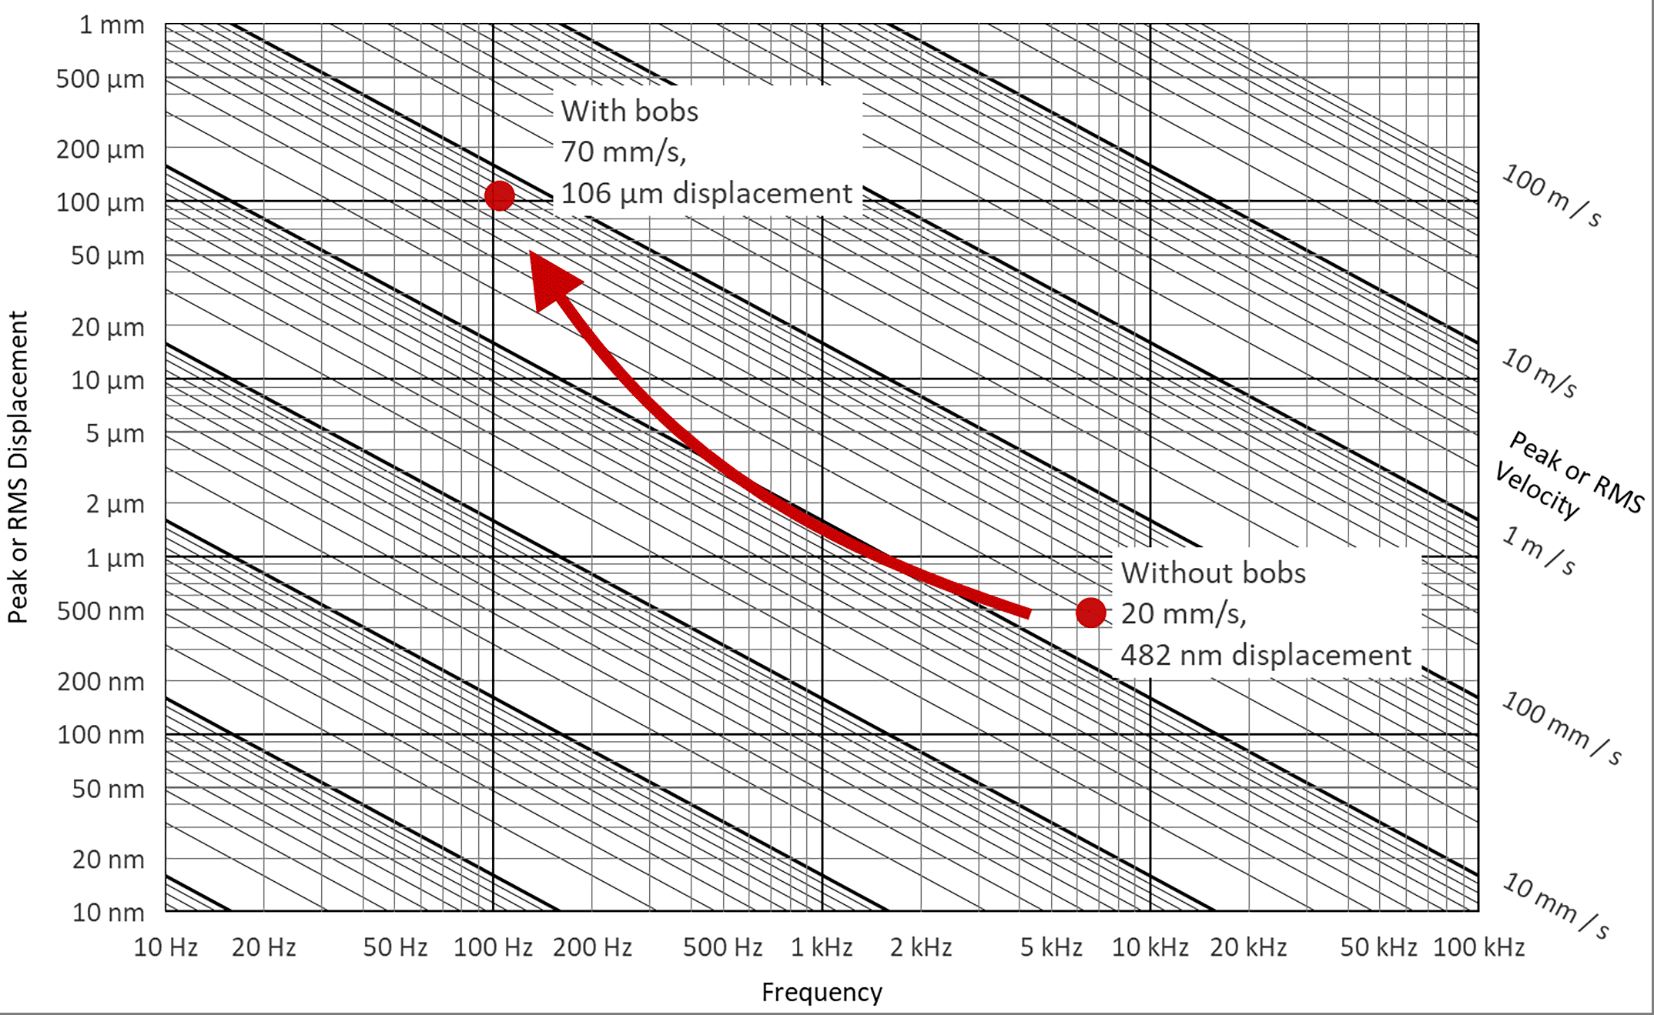
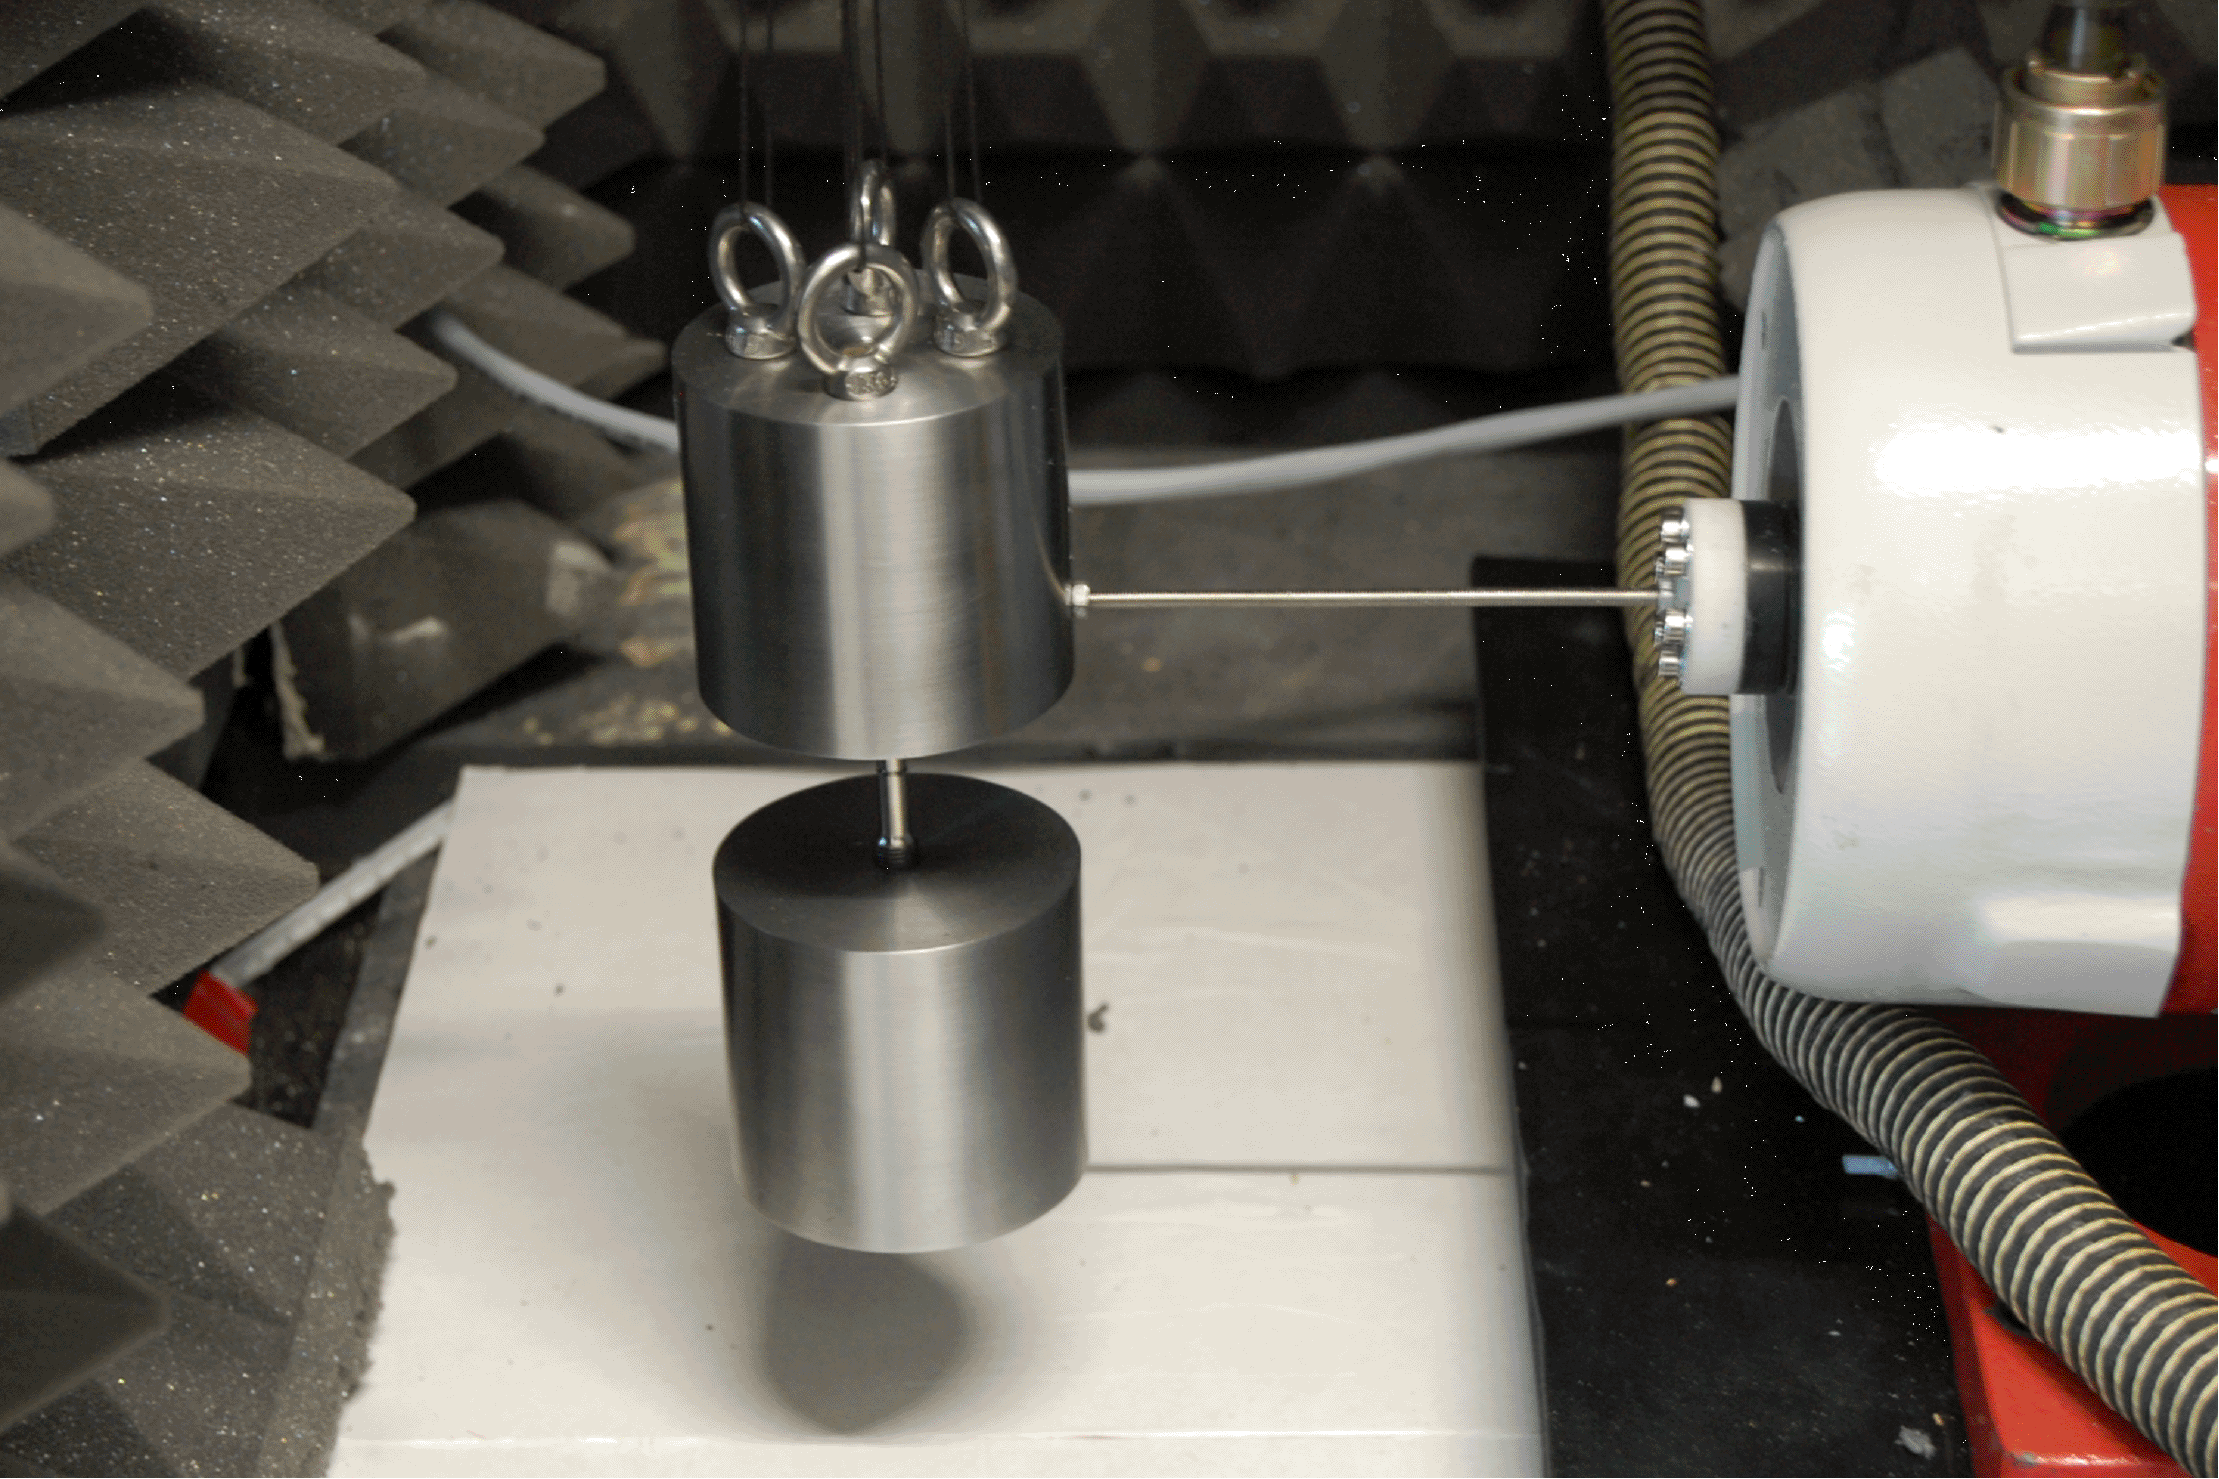
The threaded ends of the coupons allow for convenient attachment of additional masses to control the resonance behaviour of the assembly. The F519 testpiece is mass-loaded at each end with a 2.35 kg cylindrical bob (Figure 4), designed such that the first flexural eigenfrequency of the specimen is significantly reduced, to 105 Hz, while also ensuring that the frequency of vibration is within the operating bandwidth of the excitation system. The change in resonance frequency, displacement and velocity that accompanies the addition of the bobs is illustrated by the markers in Figure 3. By tailoring the bob properties, it can be ensured that crack formation will occur over an appropriate time: if the period is too short, crack formation will be uncontrolled and if the period is too long, the experiment will consume too much resource.
A laser vibrometer is used to measure system resonance.
Each bob is female-threaded such that it can be readily attached to the testpiece. Initial trials were made with brass bobs; however, the threads deteriorated rapidly under dynamic loading. For this reason, the next iteration was fabricated using EN1A steel, which is easily machined and of sufficient density to permit a compact design.
The excitation system is a Hottinger Brüel & Kjær LDS V406 Permanent magnet shaker (Hottinger Bruel & Kjaer UK Ltd, Royston, UK), attached to a threaded steel stinger. The stinger is attached at the other end, via a thread and a locking nut, to the upper bob (Figure 4). A Polytec PDV 100 laser vibrometer (Polytec Ltd, Coventry, UK) was used to measure the velocity of the resonating system. Due to the stiff coupling, the resonance mode involves the vibration of the two bobs and the coupon as one combined part. Laser measurement is taken from the upper bob in a position which is known to have a high velocity (an antinode). A Fast Fourier Transform was used to determine the precise resonance frequency. The entire setup is represented by the block diagram in Figure 5.
It is very important to ensure that there is no relative motion between the bobs and the coupon: if this occurs, there can be rapid and uncontrolled fast fracture. For this reason, the contact was reinforced using a locking nut, adjusted to a torque of 10Nm (Figure 6). The entire assembly was then suspended under gravity using four aramid wires (Figure 4), chosen for their resistance to wear and fracture in comparison to conventional fibres/polymers.
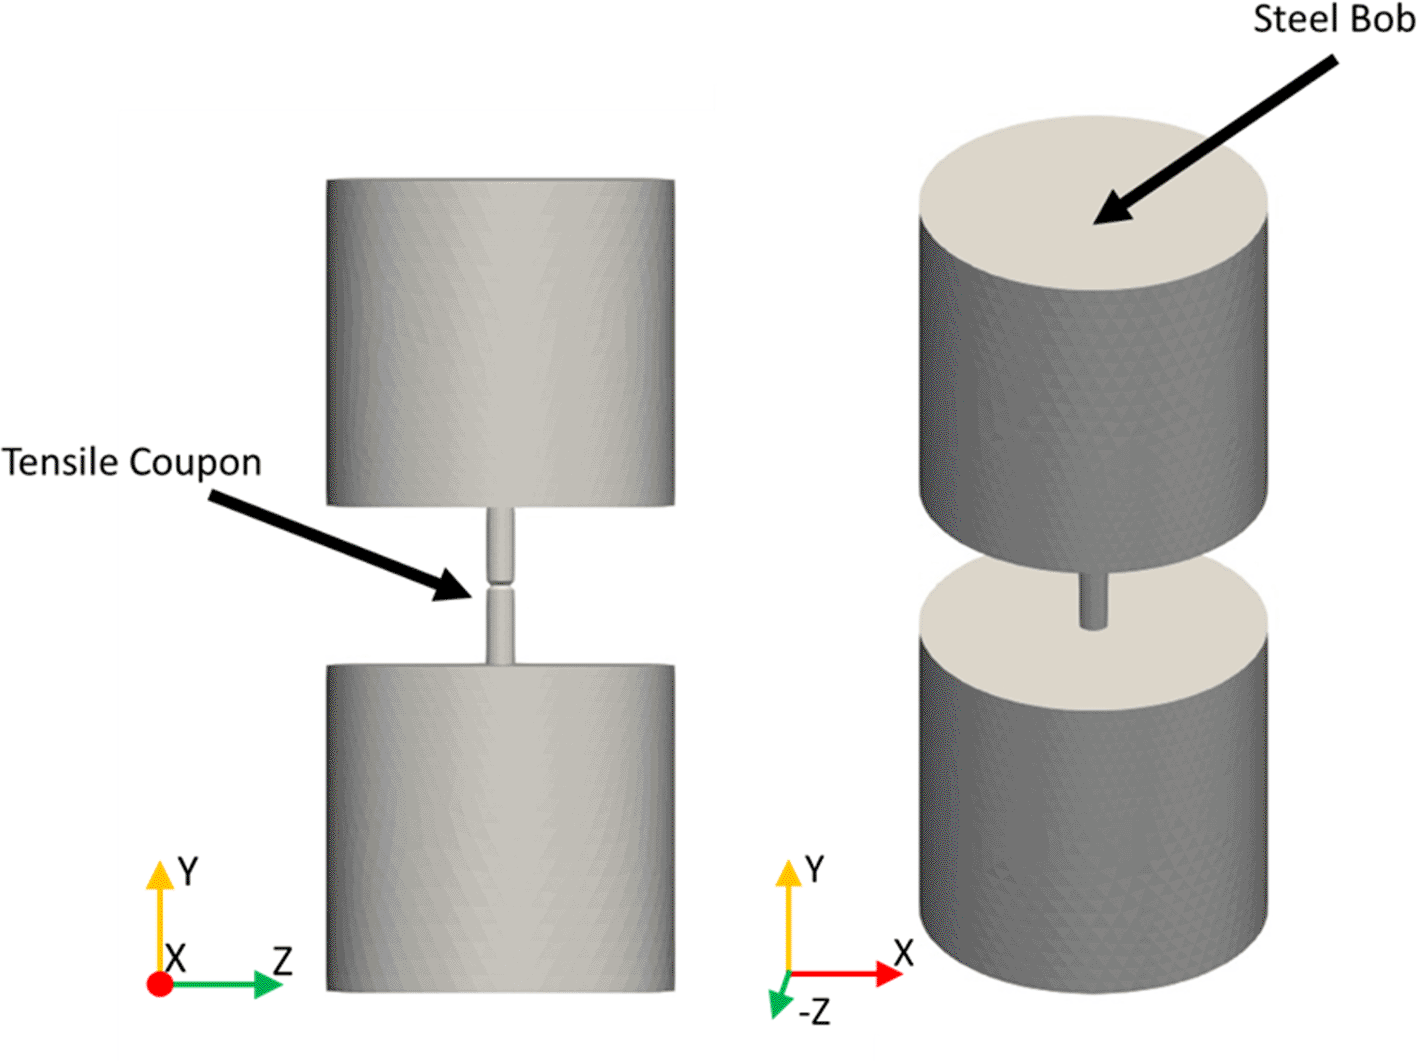
In order to understand the stress distribution in the assembly, and the frequencies of specific modes, Finite Element Analysis (FEA) was carried out on a defeatured CAD model (Figure 7) using the CalculiX finite element solver version 1.0.0, with ParaView version 5.10.0 for visualisation of the modes. The first flexural mode was predicted to be at 99.7 Hz, the exaggerated displacement profile of which is illustrated in Figure 8.
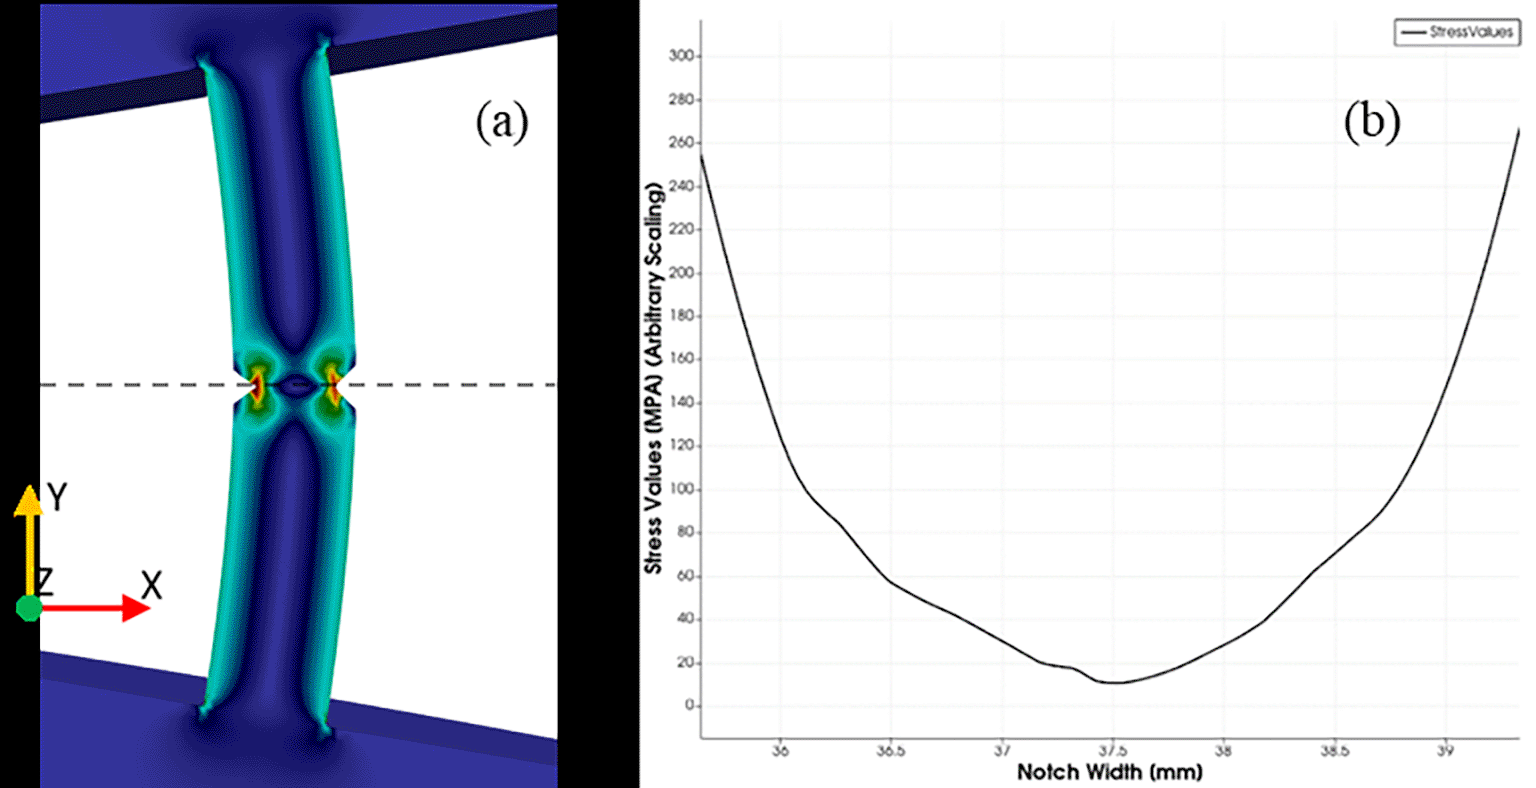
It can be seen from the Y-plane sectioned view (Figure 8a) and the stress line plot across the thickness (Figure 8b) that the stress is concentrated at the notch. The model suggests that the crack initiation and propagation will occur primarily in the stress raising notch, parallel to the excitation source (parallel to plane Z in Figure 2).
Alternative resonance modes could be selected to induce stress differently in the cylindrical section; Figure 9 shows, for comparison, a Z-plane sectioned view of the flexural mode stress distribution and the first torsional mode, which has stress more symmetrically distributed across the Z-plane. The flexural mode is more suitable in this case, due to experimental simplicity and the desire for crack initiation at the circumference of the notch and in a controlled direction.
Twenty coupons were tested to destruction, in order to determine the fracture point threshold under experimental conditions and the optimum setup parameters required for stable crack growth.
A broadband sinusoidal sweep was first conducted, to establish the frequency of the first flexural mode of the assembly. Figure 10 illustrates a typical output, showing a first resonance at 105 Hz. This peak corresponds adequately with the FEA model.
Next, in order to concentrate the excitation energy around the selected resonance mode, a high-resolution narrowband sweep (±10 Hz) was conducted around this frequency (Figure 11).
The dynamic stresses during the sweep cause crack formation in the specimen, located at the notch. This leads to a reduction in structural stiffness and a consequent measurable reduction in resonance frequency. The new frequency was located, and a second narrowband sweep was conducted, centred upon this new frequency. This process was iterated until the specimen failed. The value of the change in resonance frequency, Δf, was recorded. Several specimens were thus tested, in order to ascertain the range of Δf values at which failure occurs, ΔF. Figure 12 illustrates the change in frequency up to failure for four coupons that were tested to destruction. It can be seen that there is some variation in ΔF values; this is probably due to micro/mesoscale material flaws that affect the crack propagation and rate of growth.8 In the early stages of the process, the reproducibility is much closer, because the crack is more stable.
Having established a ΔF threshold, it should now be possible to run a controlled set of experiments to seed cracks. These can be created with a range of severity, by setting the control software to stop the test at various values of Δf prior to reaching ΔF. Figure 13 shows three different examples of this, with Δf values of 5, 15 and 20 Hz. Each sweep corresponds to a single point on the graph, and takes approximately 30 seconds. Some variation in gradient is inevitable, given that the initial conditions of the specimens are likely to vary.
A range of Δf stopping points was used for the coupons with the aim to obtain different crack sizes (Table 1).
During crack formation, the resonance peak is likely to exhibit “splitting”.9 The testpieces are exposed to dynamic loading in one axis with stress concentrations from the flexural mode parallel to this axis. The resulting crack initiation and propagation is therefore preferentially in one direction (Figure 14), giving rise to an anisotropic stiffness profile in the Z-plane and, therefore, degenerate modes manifesting as split peaks.
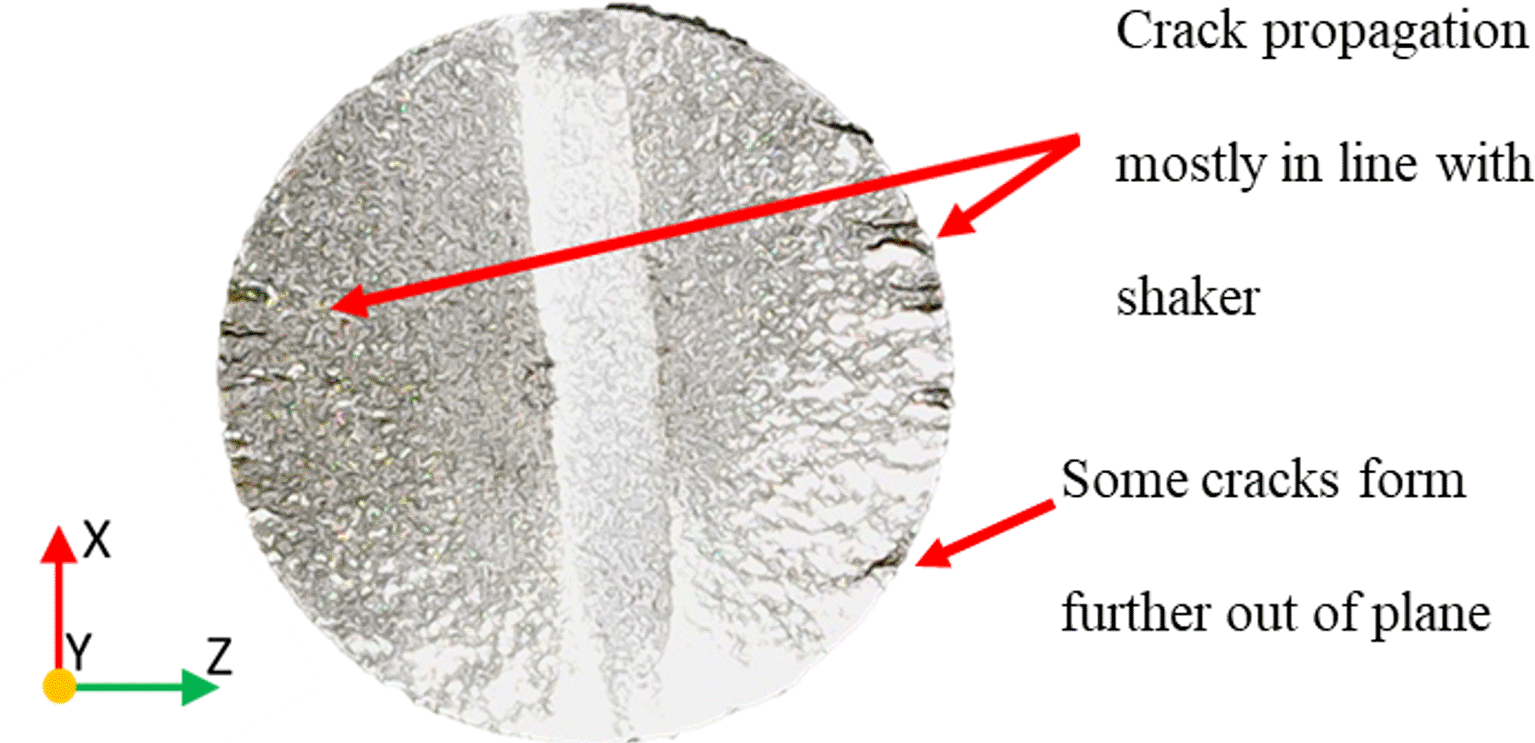
Figure 15 shows the flexural mode response; the left peak is parallel to the excitation, which has a reduced stiffness due to cracking, whereas the right peak is the orthogonal flexural mode. Figure 16 shows the measured difference in frequency between the split peaks in each of the coupons. It can be seen that all but the controls exhibit this effect. These measurements were taken after the exposure process, with bobs removed.
As the cracks propagate through the test piece, the left peak will move towards lower frequencies and the peak separation (i.e. the difference in frequency between the split peaks) can therefore be used as an indicator of crack propagation. The sensitivity of the peak splitting metric will depend on the Quality Factor and the position of the crack initiation points: it will not be possible to distinguish two closely-spaced peaks if the Quality Factor is not sufficiently high. The crack initiation points are unpredictable and are likely to depend on pre-existing material inhomogeneity.8 Anisotropy will be less affected by initiation points that are, for example, 45 degrees off-axis from the shaker excitation and will be more affected when they are parallel to the excitation direction, the latter creating the greatest difference between the two split peaks. This is because a crack initiated at 45 degrees will affect the stiffness of both of the degenerate modes equally.
Specimens RD20, RD25 and RD30 represent different crack propagation stages (5 Hz, 15 Hz, 20 Hz frequency shift respectively), and so were selected for destructive imaging. They were sectioned close to the Y plane and then carefully polished to remove the remaining material in order to expose the plane fully. This provided images in the areas of high stress concentrations. The imaging was then conducted using a JSM-IT800 Schottky Field Emission Scanning Electron Microscope.
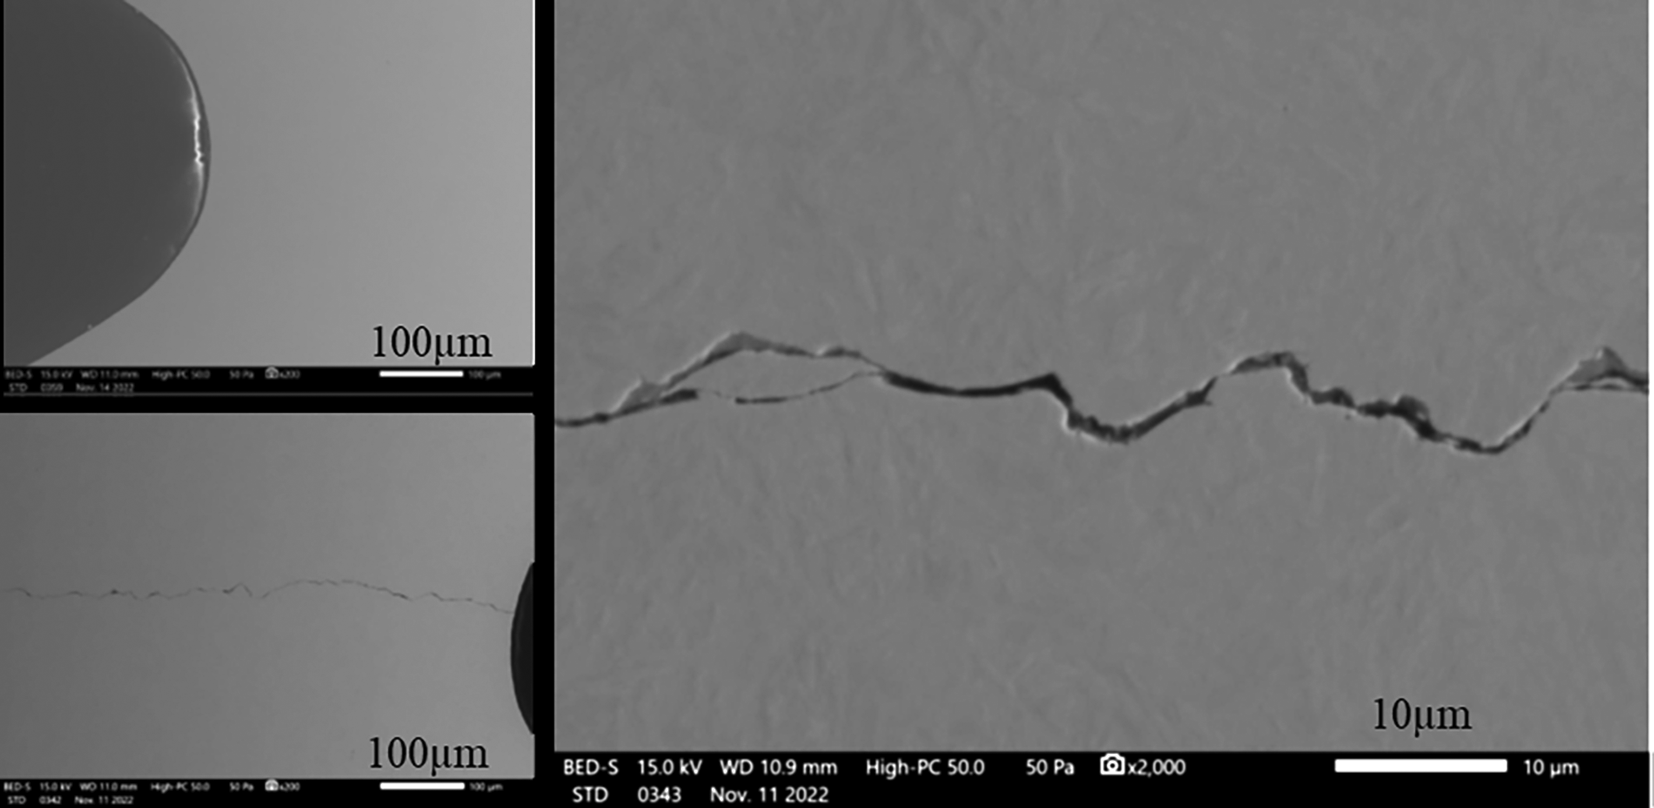
SEM images were gathered from a selection of the exposed coupons, chosen as representing a wide range of exposure conditions. In RD20, the coupon which exhibited the lowest frequency shift of 5 Hz, a small crack ranging from 0.5 microns to 5 microns in width was discovered at the edge of the notched section (Figure 17). The length of the crack is approximately 50 microns, suggesting that it is in the early stages of propagation.

RD25 and RD30 are shown in Figure 18 and Figure 19 respectively. The two outer images show the extent of propagation from the right-hand edge of the notch (the ‘excitation side’) and the central image shows a magnified view of a central portion of the crack. These coupons have much more extensive cracking, which propagates over a significant proportion of the diameter. RD25 and RD30 have similar propagation lengths; however, RD30, which exhibited the highest frequency shift, has a maximum crack width at approximately 2 microns. RD25 has a smaller width at approximately 1 micron. It is believed that both of these coupons were close to failure due to the propagation length of the cracks. The coupons display increasing crack propagation with increased exposure to the technique, proving that contact cracks can be rapidly and controllably seeded in these metallic test coupons. This builds on the capability of the other techniques identified in the introduction by creating a flaw more representative of fatigue type cracking without requiring the large number of cycles. Due to constraints on the project, only three coupons were selected for the SEM validation stage. In future developments, it would be desirable to select more coupons from earlier stages of propagation so that the correlation between crack dimensions and exposure level can be more closely established.
This paper reports the development of a rapid, controlled method for seeding contact cracks in ASTM coupons, which could be adapted for other geometries. The technique involves an electromagnetic shaker, laser vibrometer and two steel bobs attached to ASTM F519-18 Type 1a.1 tensile coupons. This has been trialled on a selection of twelve coupons with an additional three retained as controls.
When a coupon is exposed to a combination of a static tensile load and a dynamic cyclic load, very small contact cracks of varying severity can be created at stress riser locations. The dynamic loading exploits the first flexural resonance of a system consisting of the coupon and two mass-loading bobs. This is important, as it will maximise the excitation energy at the desired flaw locations. The crack size can be controlled by precisely measuring the resonance frequency of the system and stopping the exposure process upon reaching predetermined thresholds.
The crack-seeding process was validated using scanning electron microscopy. The SEM images clearly identified the cracks that were responsible for the measured changes in resonance frequency. They indicate that the cracks are much more advanced in coupons RD25 and RD30 when compared to RD20, suggesting that the rate of change of resonance frequency closely correlates with rate of crack growth. The extent to which the cracks have propagated through the RD25, RD30 coupons suggests that they are likely to be very close to fracture, whereas the crack in RD20 had only just initiated and has a much lower propagation length of approximately 50 microns.
Figshare. Controlled Seeding of Contact Cracks in Testpieces for the Evaluation and Validation of Non-Destructive Testing Systems. https://doi.org/10.6084/m9.figshare.23391566.v1
This project contains the following underlying data:
Data are available under the terms of the Creative Commons Attribution 4.0 International license (CC-BY 4.0).
The authors gratefully acknowledge the help of Francesca Willcocks and Thomas O’Hanlon from the Plymouth Electron Microscopy Centre, University of Plymouth for making the SEM images of the sectioned coupons, and Peter Woolliams and Maria Lodeiro at the National Physical Laboratory for providing Figure 1.
| Views | Downloads | |
|---|---|---|
| F1000Research | - | - |
|
PubMed Central
Data from PMC are received and updated monthly.
|
- | - |
Is the work clearly and accurately presented and does it cite the current literature?
Yes
Is the study design appropriate and is the work technically sound?
Yes
Are sufficient details of methods and analysis provided to allow replication by others?
Partly
If applicable, is the statistical analysis and its interpretation appropriate?
Not applicable
Are all the source data underlying the results available to ensure full reproducibility?
Partly
Are the conclusions drawn adequately supported by the results?
Partly
Competing Interests: No competing interests were disclosed.
Reviewer Expertise: Fault diagnosis; Condition monitoring; Vibration analysis; Machine learning
Is the work clearly and accurately presented and does it cite the current literature?
Partly
Is the study design appropriate and is the work technically sound?
Yes
Are sufficient details of methods and analysis provided to allow replication by others?
Partly
If applicable, is the statistical analysis and its interpretation appropriate?
Partly
Are all the source data underlying the results available to ensure full reproducibility?
Yes
Are the conclusions drawn adequately supported by the results?
Partly
Competing Interests: No competing interests were disclosed.
Alongside their report, reviewers assign a status to the article:
| Invited Reviewers | ||
|---|---|---|
| 1 | 2 | |
|
Version 1 04 Sep 23 |
read | read |
Provide sufficient details of any financial or non-financial competing interests to enable users to assess whether your comments might lead a reasonable person to question your impartiality. Consider the following examples, but note that this is not an exhaustive list:
Sign up for content alerts and receive a weekly or monthly email with all newly published articles
Already registered? Sign in
The email address should be the one you originally registered with F1000.
You registered with F1000 via Google, so we cannot reset your password.
To sign in, please click here.
If you still need help with your Google account password, please click here.
You registered with F1000 via Facebook, so we cannot reset your password.
To sign in, please click here.
If you still need help with your Facebook account password, please click here.
If your email address is registered with us, we will email you instructions to reset your password.
If you think you should have received this email but it has not arrived, please check your spam filters and/or contact for further assistance.
Comments on this article Comments (0)