Keywords
Sub-pathway-based analysis, iDEAP, Support Vector Machine, 10-fold Cross Validation, Cancer Classification
Sub-pathway-based analysis, iDEAP, Support Vector Machine, 10-fold Cross Validation, Cancer Classification
In the life sciences, emerging high–throughput technologies such as next-generation sequencing, -omics technology and microarrays allow for creation of massive amounts of highly dimensional biological data. Such data can cover genome, transcriptome, epigenome, proteome, metabolome, molecular imaging, and molecular pathways. Many sophisticated analytic methods have been developed to broaden the biological interpretation of differentially expressed genes and pathways. The earliest approach involved gene-by-gene analysis through individual gene analysis (IGA), which produced a list of altered genes using a cut-off threshold. 1 Subsequently, systems-level methodologies have pushed forward the transition of IGA to include gene set analysis (GSA), that can identify gene sets in a more subtle way, coordinated by a single-step process. Even though GSA methods have the advantage to researchers in characterizing groups of genes, they have limitations when applied to pathway datasets. Many of GSA methods disregard the graphical structure of pathway data, resulting in the potential omission of critical information regarding the biological interactions between molecules. As a consequence, this can lead to inaccurate outcomes. Pathway topology-based analysis has been introduced to overcome the limitations of GSA methods by considering the pathway structure. This analysis has integrated the information of gene ontology and pathway structure to discover which pathways are associated with a particular phenotype. In addition, two hypothesis tests can be observed. First, entire pathways can be tested for differential expression, and secondly identified informative sub-pathways represent the entire pathway with massive information associated with the differential expression. The second hypothesis is a more recent evolution in topology-based analysis as it can improve the specificity and sensitivity of the outcomes.2 Previous studies stated that the pathway structure information can provide relevant biological insights and contribute to the understanding of higher integrative levels of biological functions that are more complex with many variations and characteristics of information.3 Recently, topology-based analysis has shifted towards sub-pathway-based analysis, which provides information on biological phenomena more precisely, and hence can identify regions of the pathway that are dysregulated by diseases.4 In addition, previous studies have proved that deformities in sub-pathway regions of the pathway might contribute to the etiology of the disease.5 An overview of sub-pathway-based analysis is illustrated in Figure 1.

Several sub-pathway-based analysis methods have been developed which share the same target in the search pathway portion related to disease modeling, drug targeting and other objectives.6–9 However, most of the methods have constraints that need to be improved due to a range of challenges. One of the challenges is how to examine the sub-pathways.10 Most of the sub-pathway methods independently search sub-pathways without implementing any search algorithm. Moreover, some researchers assume extraction of sub-pathway strategies do not affect the results.2 In addition, the pathway structures can be complex and involve the combination of many sub-pathways and interactions. Due to this, an efficient sub-pathway-based analysis method is essential to identify the specific region that is differentially expressed by utilizing all information within a given pathway. Therefore, this paper integrates the DMSP (Module from Seed Protein) algorithm to identify informative sub-pathways from the specific nodes and expanding them to the entire pathway network. The sub-pathway with the most informative genes is used to produce the best biological insight in identifying informative pathway related to the given phenotype under investigation.
Numerous biological pathway databases now exist such as Kyoto Encyclopedia of Genes and Genomes (KEGG),11 Gene Ontology (GO),12 Biocarta (https://maayanlab.cloud/Harmonizome/dataset/Biocarta+Pathways) and many more. The majority of these pathway databases are not specific to certain biological contexts such as cancer. By implementing sub-pathway-based analysis, many informative pathways can be identified and leveraged and improve biological databases. In addition, the knowledge of genes within informative sub-pathways highly related to diseases can be applied for future studies such as cancer classification.13 Previous cancer studies are clinical and have limitations in diagnostic ability.14 Usually, gene expression data that is gained from microarray experiments is used to performed cancer classification with the implementation of advanced machine learning methods. The use of gene expression data poses a challenge for cancer classification, especially when using traditional approaches.
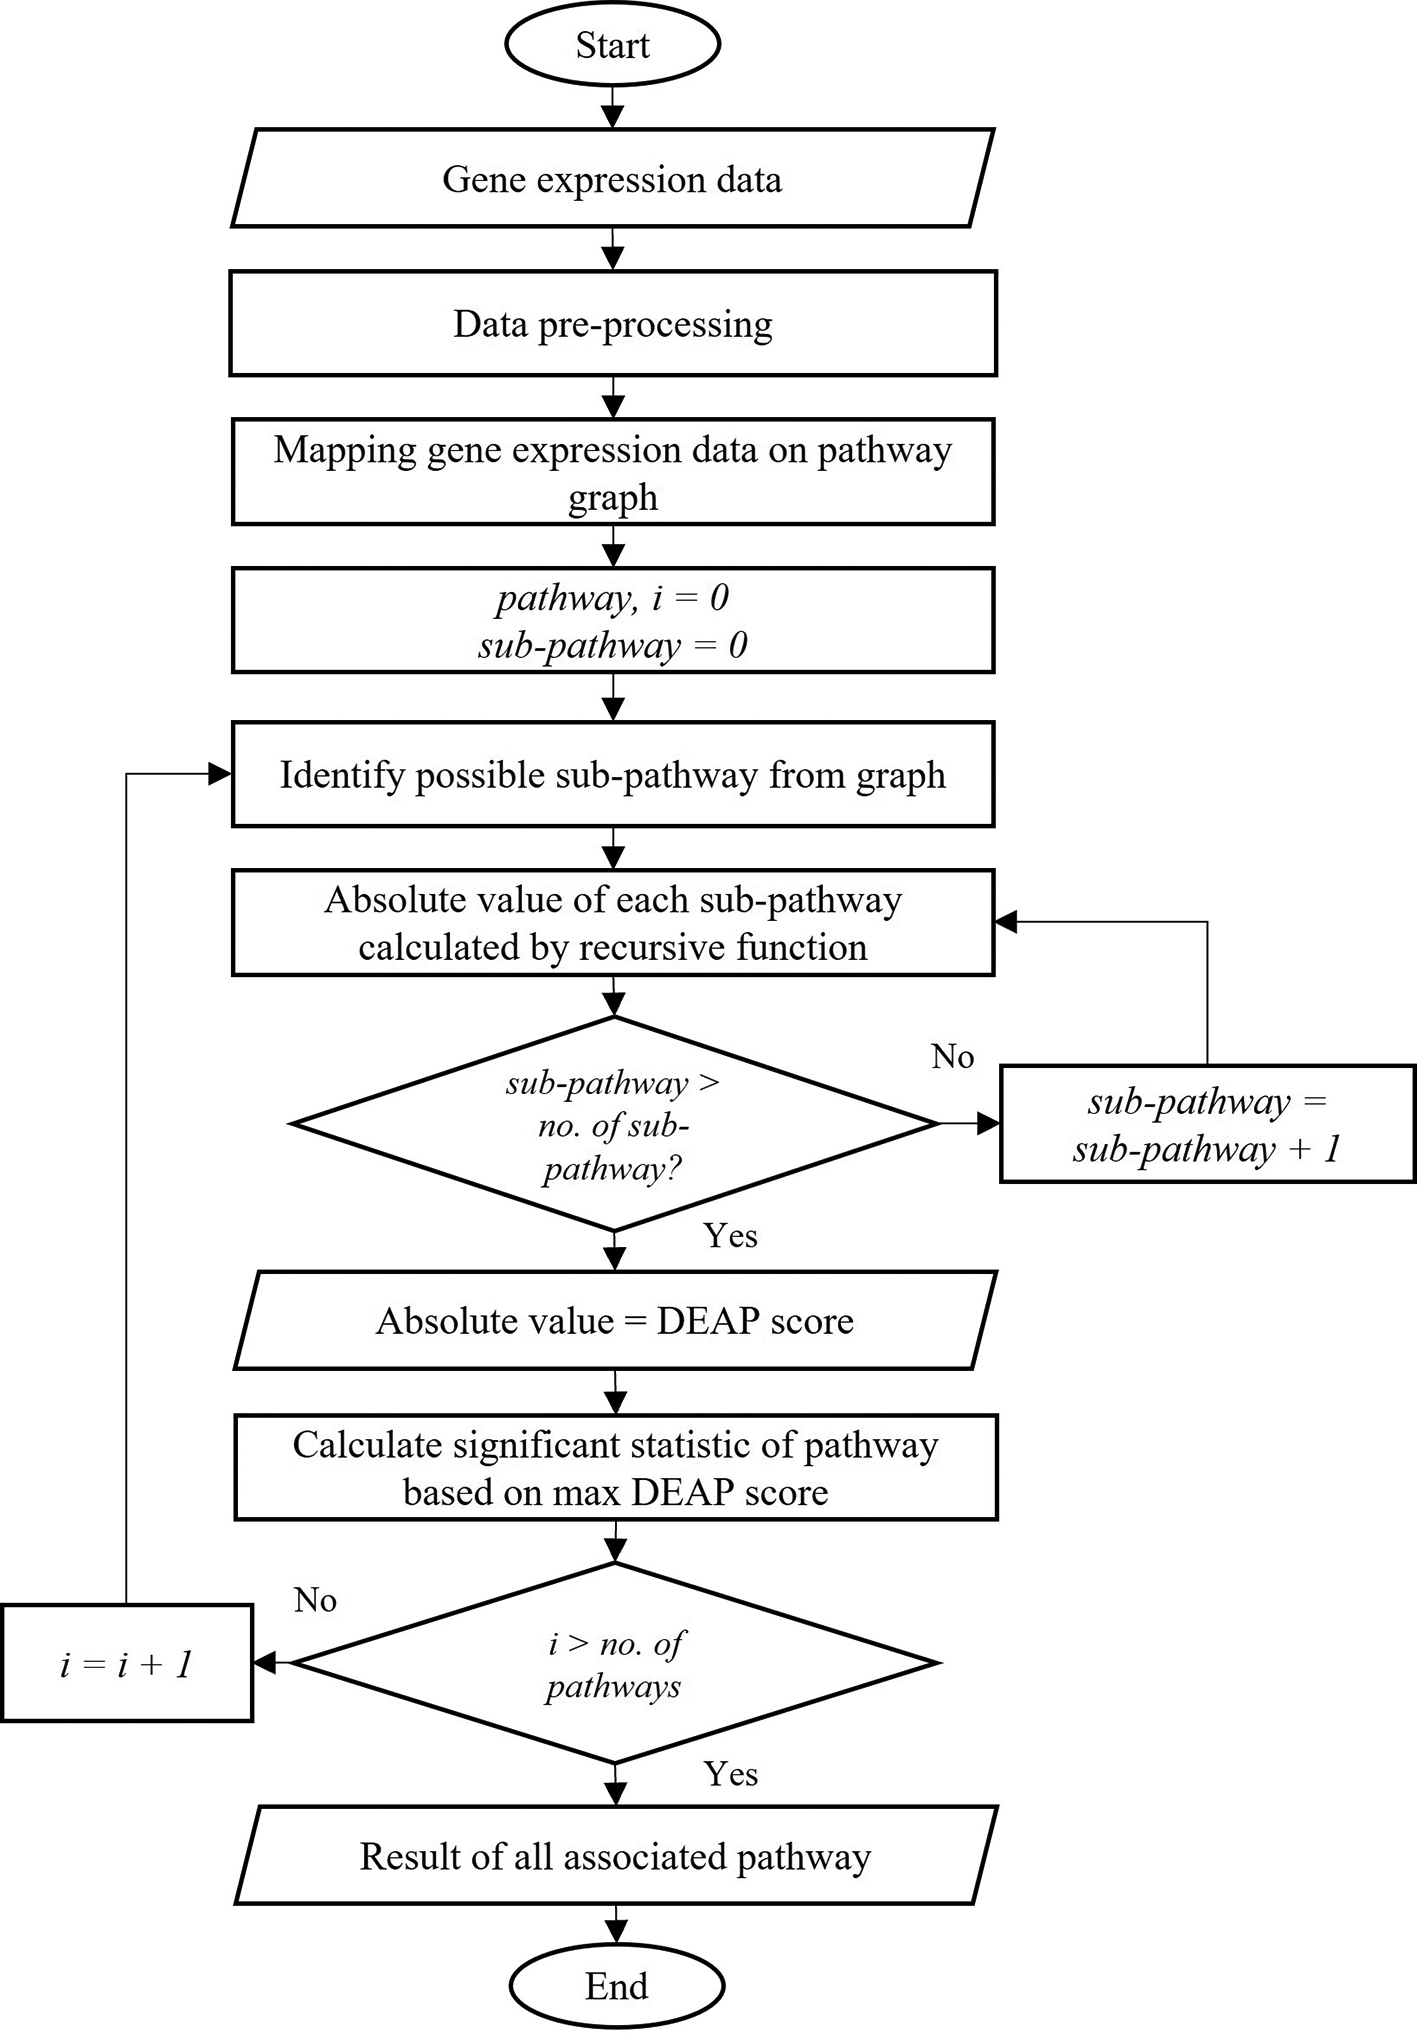
Differential Expression Analysis for Pathways (DEAP) method is a sub-pathway analysis method that can find informative pathways based on the maximum absolute running sum score of sub-pathways. This method calculates the sub-pathway maximum absolute summation score by considering the interaction between nodes, where catalytic/inhibitory edges are taken as positive/negative summands. There are five primary steps in the DEAP method: data pre-processing, data mapping, identification of sub-pathways, absolute value calculation and statistical calculation of pathways as shown in Figure 2. First, the gene expression data undergoes a pre-processing stage to generate a null distribution using random rotations. Then, the algorithm starts by mapping the expression data onto the pathway graph. Next, the sub-pathways in the pathway are recursively identified from root to leaves nodes. A recursive function calculates the maximum absolute running summation score for all sub-pathways within the pathway by considering whether the reactions are catalytic or inhibitory. Every reaction represents a value, which is used for calculating each sub-pathway. From the calculation, the sub-pathway with maximal differential expression is determined. The maximum absolute value represents the DEAP score, which is returned.
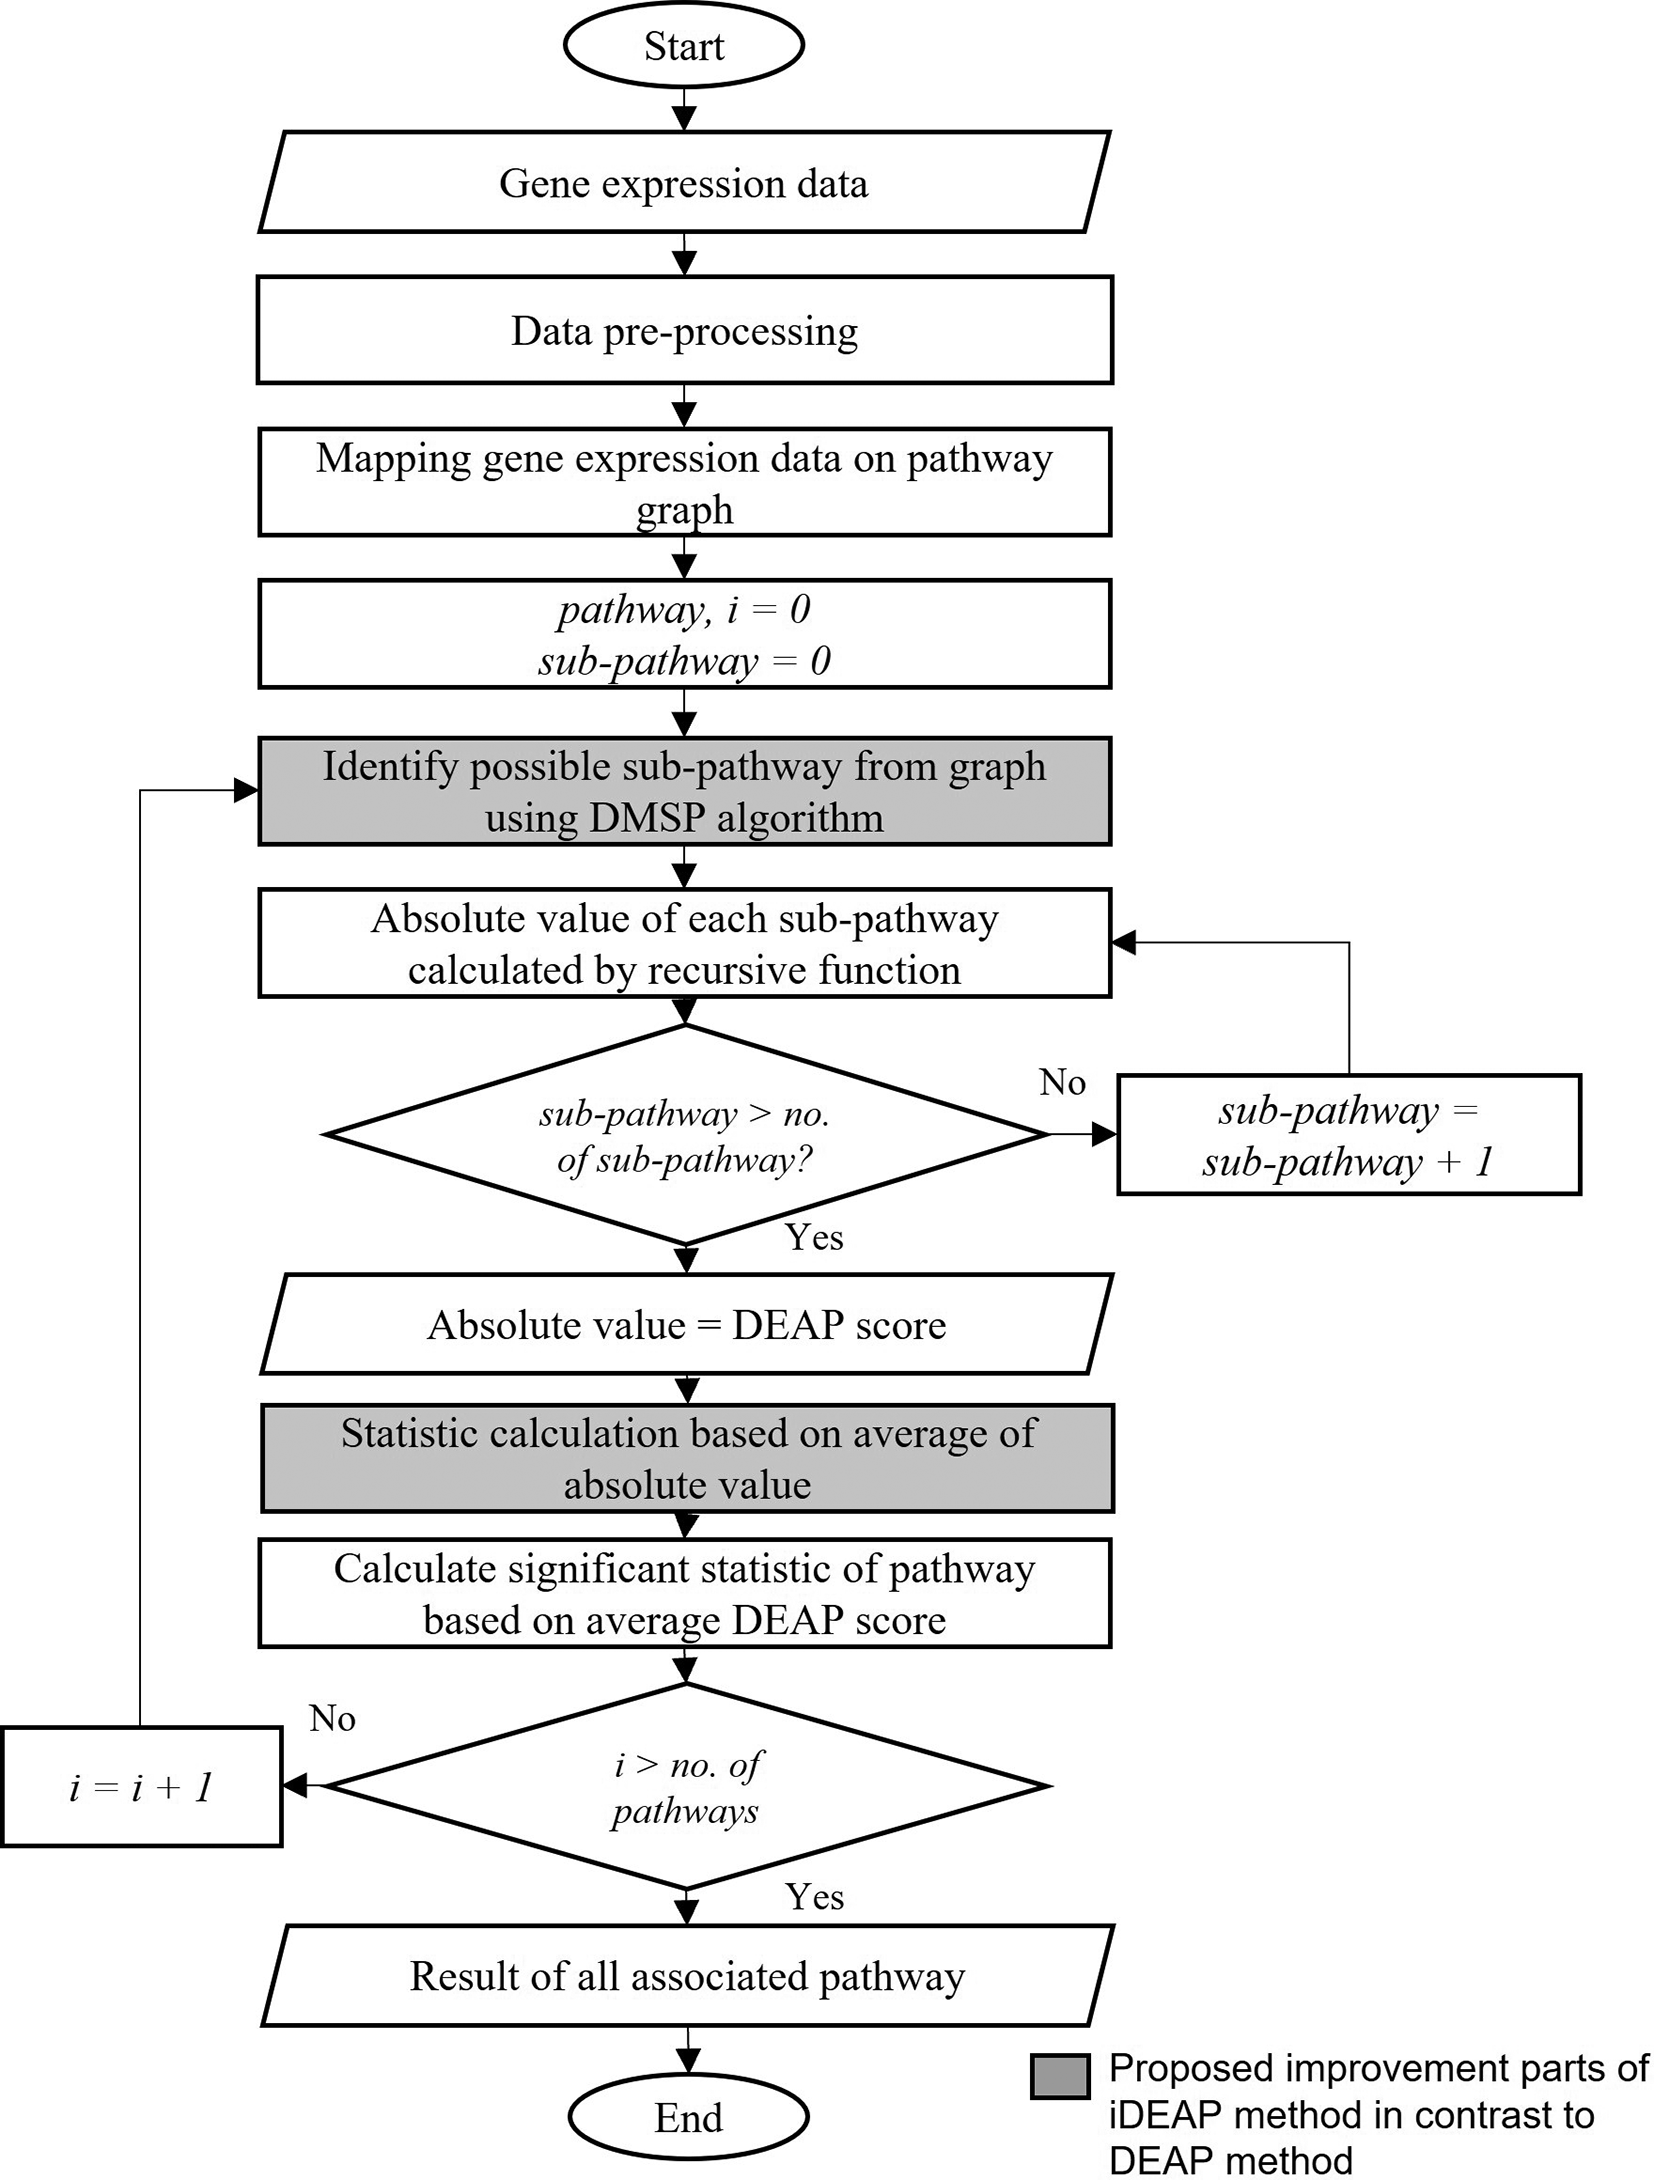
In order to extract a sub-pathway that is related to the targeted phenotype, many methods had been developed based around differentially expressed (DE) genes. The differential expression analysis for pathway (DEAP) method15 utilizes the information in biological pathways to identify important paths by integrating differential expression data. Despite the good performance of DEAP, the identification of sub-pathway efficiency still can be improved by integrating a searching algorithm starting from the most associated genes in the pathway. The DEAP method searches for the possible sub-pathway within the pathway without taking other information into account. It also only uses a basic search algorithm embedded in the DEAP method. Basically, the search starts from the root node to the leaves node and goes through all the nodes until the end. The efficiency of searching can be improved by implementing a search algorithm to find informative pathways. Recent research has shown that the use of search algorithms can provide better results.16 In sub-pathway-based analysis, one of the main concerns is the precision in identifying sub-pathways within a given pathway. Sub-pathways were often considered without taking into account biological relations within the pathway. Thus, non-informative sub-pathways could be erroneously identified during the analysis of data used for specific biological contexts like cancer. This is because not every gene in the pathway is involved in biological processes and diseases like cancer. This research proposes the DMSP search algorithm to the DEAP method to improve the efficiency of the identification of informative sub-pathways and genes. The proposed method is referred to as iDEAP.17 In the proposed method, the search process is improved to search for the best informative sub-pathway with an additional step introduced to average all of the DEAP scores to consider all interactions between sub-pathways. The overview of the workflow of the iDEAP method is shown in Figure 3. The improved parts that show the differences between DEAP and iDEAP can be seen in Figure 3. Where the proposed algorithm is implemented. The code from previous work is combined with a proposed searching algorithm and average calculation code. Furthermore, new codes have been developed specifically for data pre-processing, ensuring that the data are appropriately prepared.
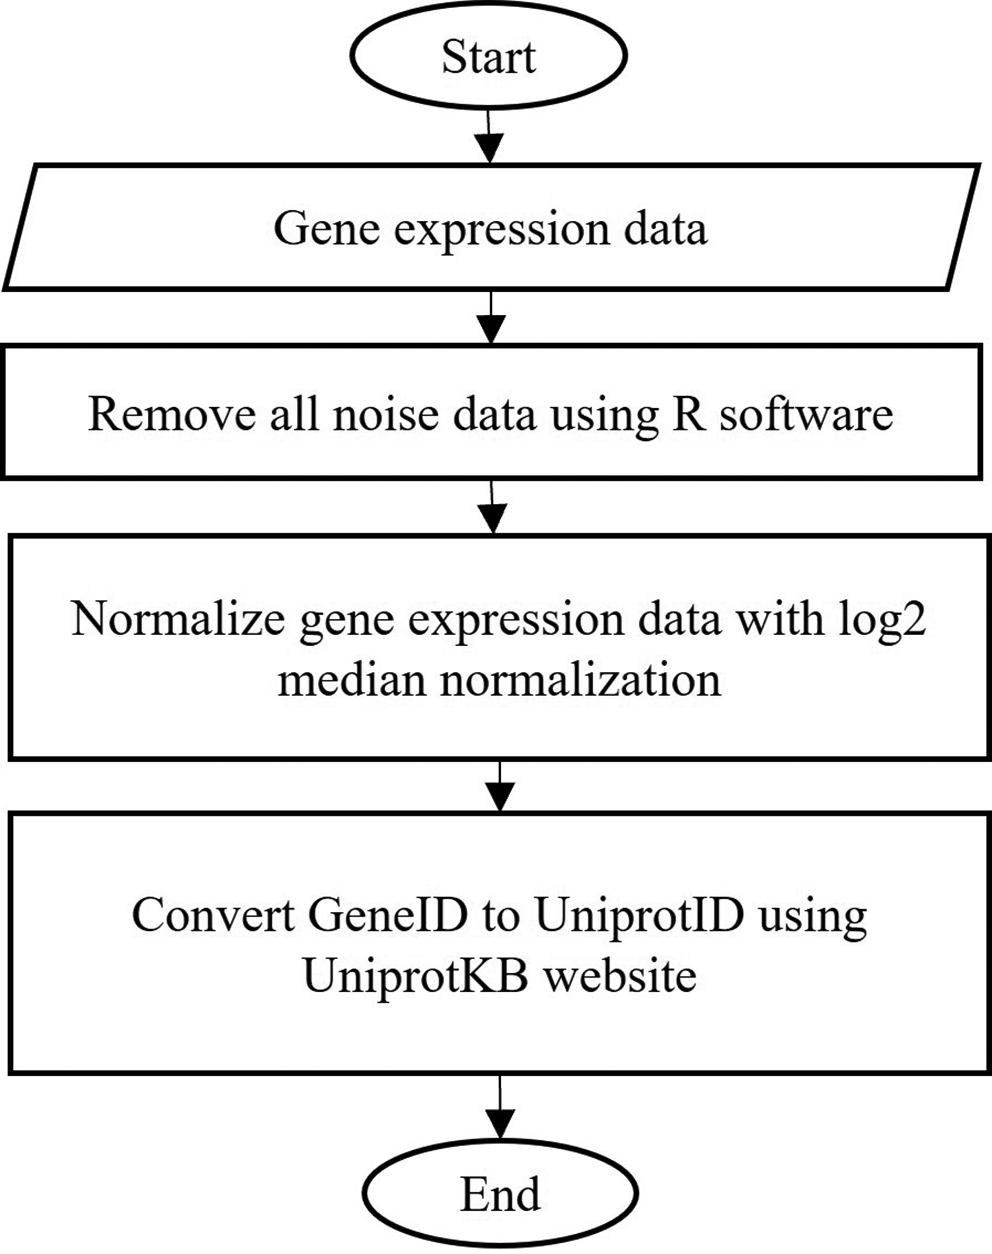
The purpose of data pre-processing is to remove uninformative data that affect the results and to ensure the data is suitable for input. Firstly, the uninformative data are removed from the dataset, followed by a normalization process. This step is important to correct the expression data value according to different cellular inputs. Next, the geneID is converted to UniProtID as this analysis utilizes the UniProt identifier. Figure 4 shows the flowchart of the data pre-processing activity.
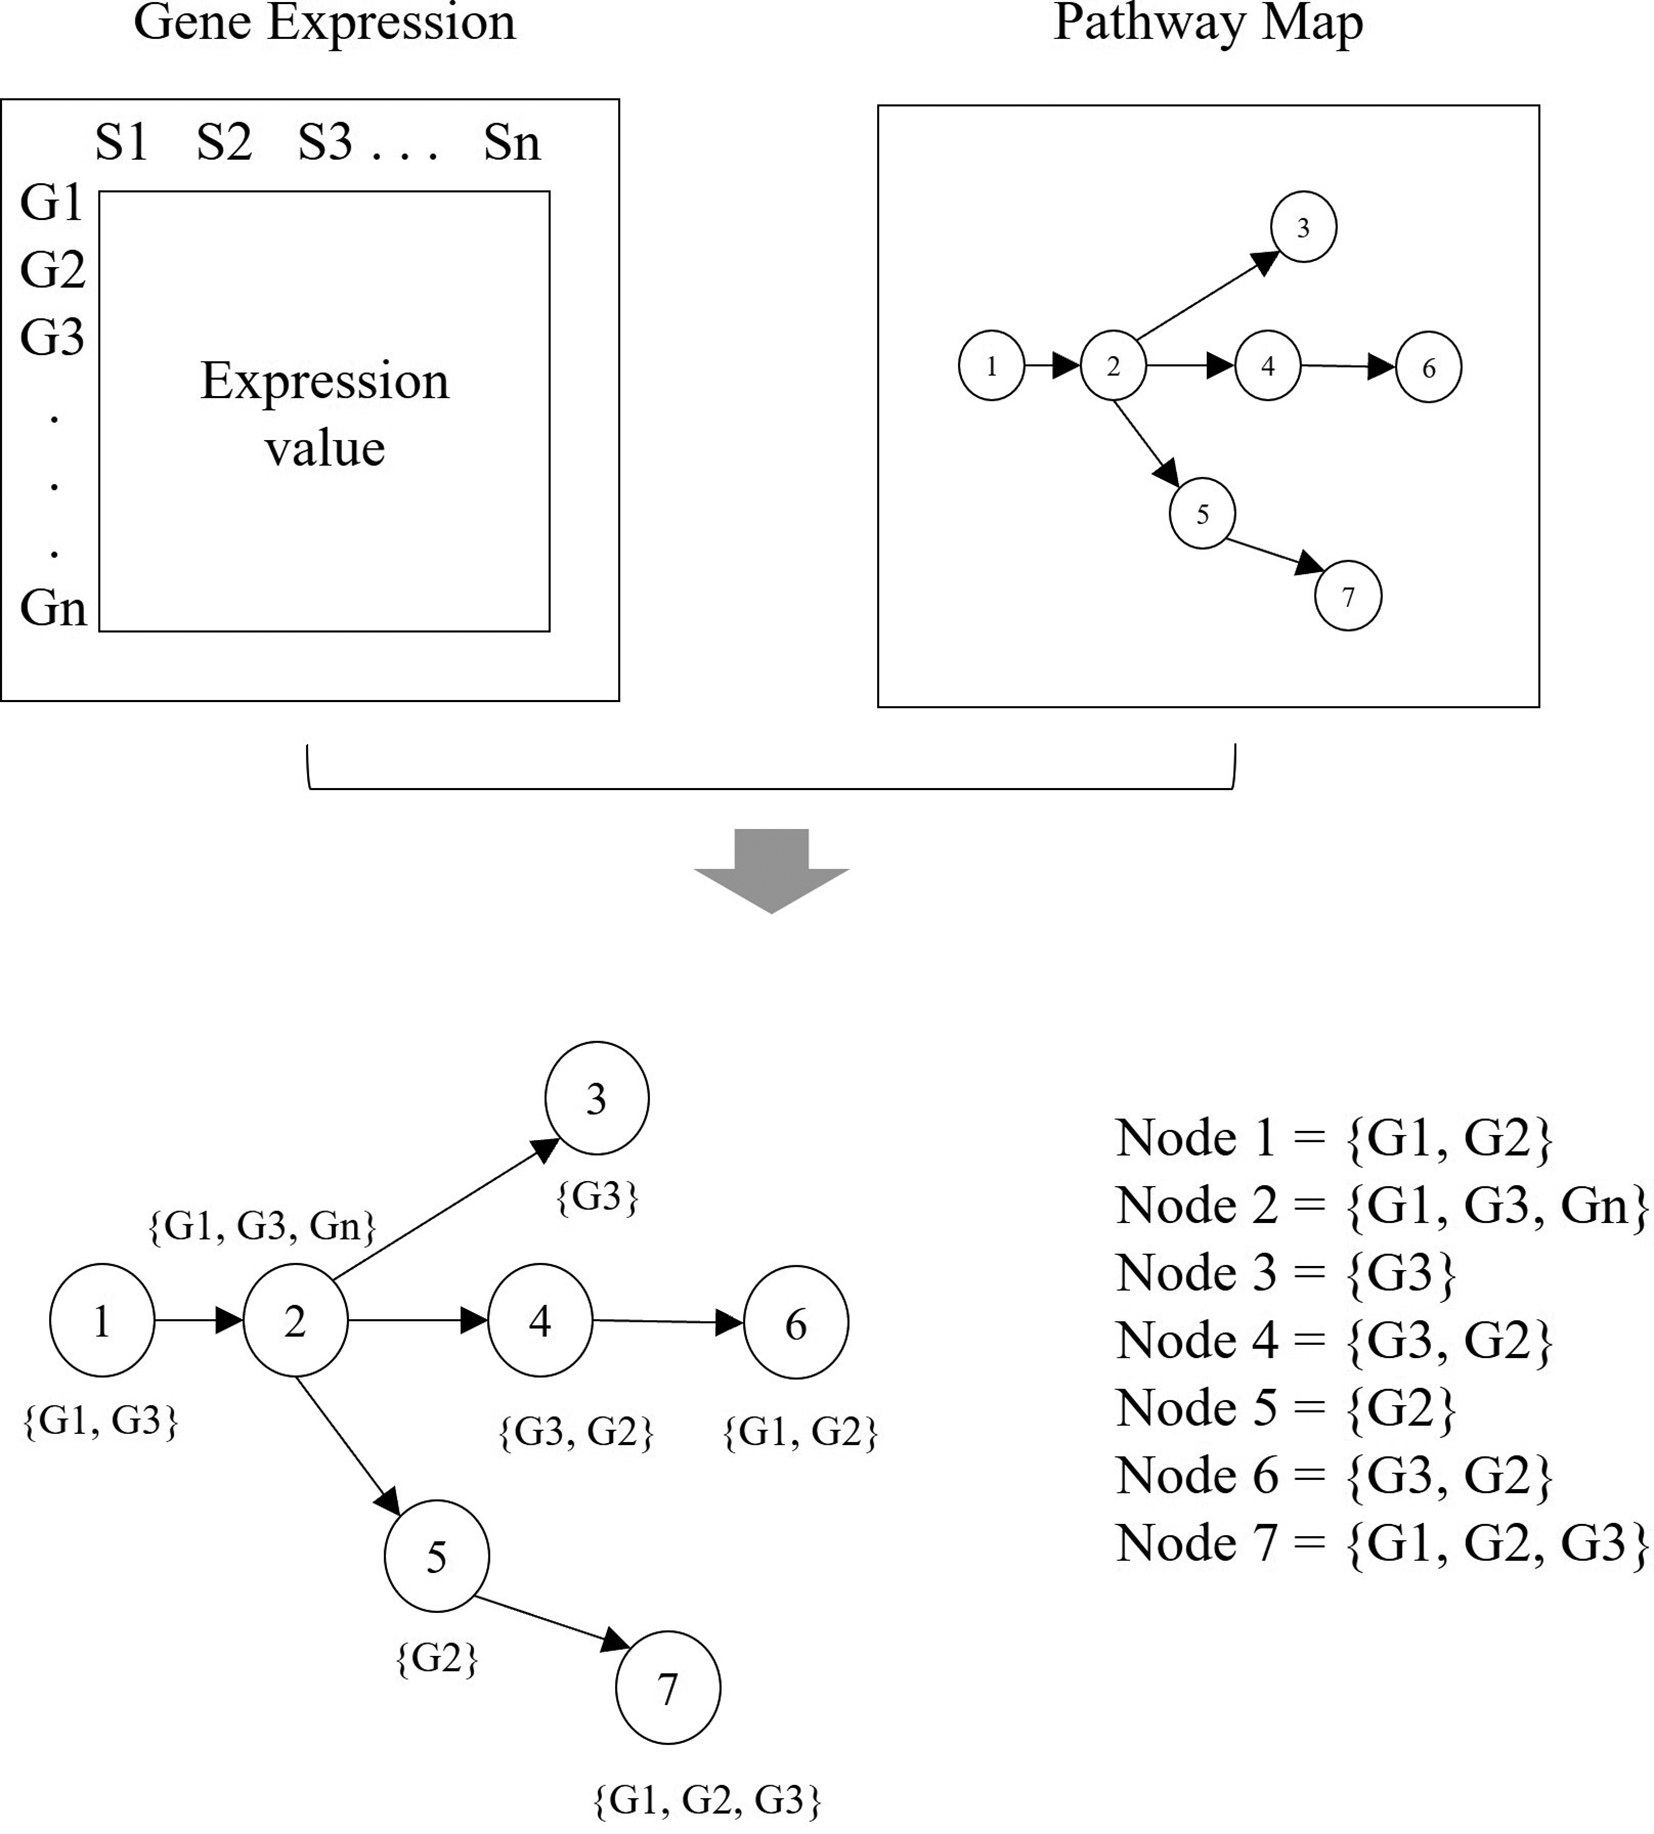
In this phase, the gene expression data are integrated with the pathway graphs. All cellular components within the pathway are extracted as nodes in the corresponding graph. Each node contains multiple genes which have a different unique ID. This ID is used to derive the expression values from the gene expression data. The process of mapping is illustrated in Figure 5.
DMSP searching algorithm was introduced in 2007 for integrating gene expression data and protein-protein interactions (PPI) to determine functional modules. This algorithm is able to determine interactions among a set of proteins in each graph. Generally, the idea is to discover biologically relevant PPI subnetworks within a larger network, whose proteins interact significantly. This algorithm is setup to identify functional modules starting from a ‘seed’ protein (the most informative protein) in the dataset.
In this work, a search algorithm was implemented to extract sub-pathways by taking topology information into account. This algorithm is adapted from the DMSP algorithm18 where the search process starts from the most interesting node. The package edgeR19 is used to detect the most differentially expressed genes to be appointed as the most interesting nodes in the pathway. The sub-pathways were extracted based on the perturbation caused by the most interesting nodes in the pathway as shown in Figure 6(b). The most interesting nodes are selected based on the value of the most differentially expressed genes.
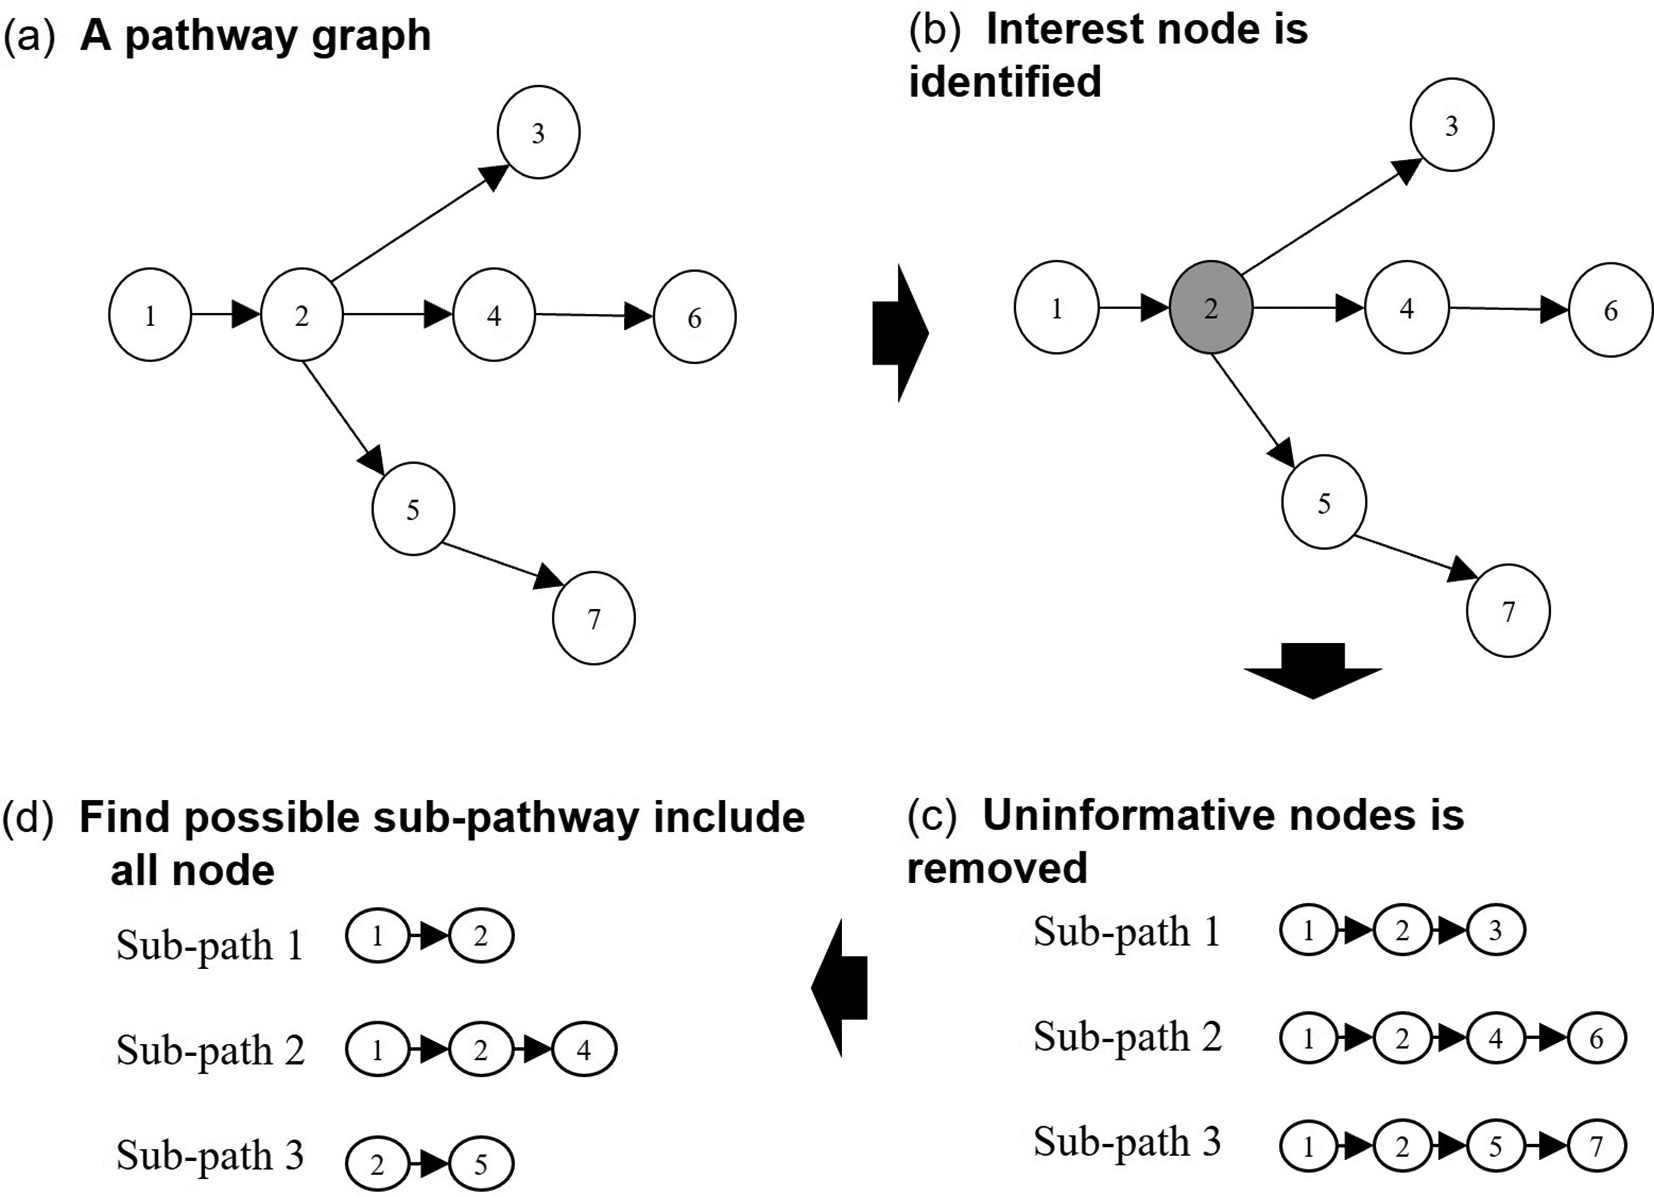
The search algorithm works in two phases. First, the search is conducted by selecting the internal and external nodes to form a sub-pathway. Second, the nodes in the sub-pathway are pruned to select highly connected sub-pathways as shown in Figure 6(c) and (d). To obtain a compact sub-pathway, the node is removed from the sub-pathway if it satisfies the criteria: Ninternal > Nexternal where Ninternal is the internal node nearest to the interesting node and Nexternal is the external node. This process is recursively repeated for every sub-pathway. The process is illustrated in Figure 6 and the flow of the process is shown in Figure 7.

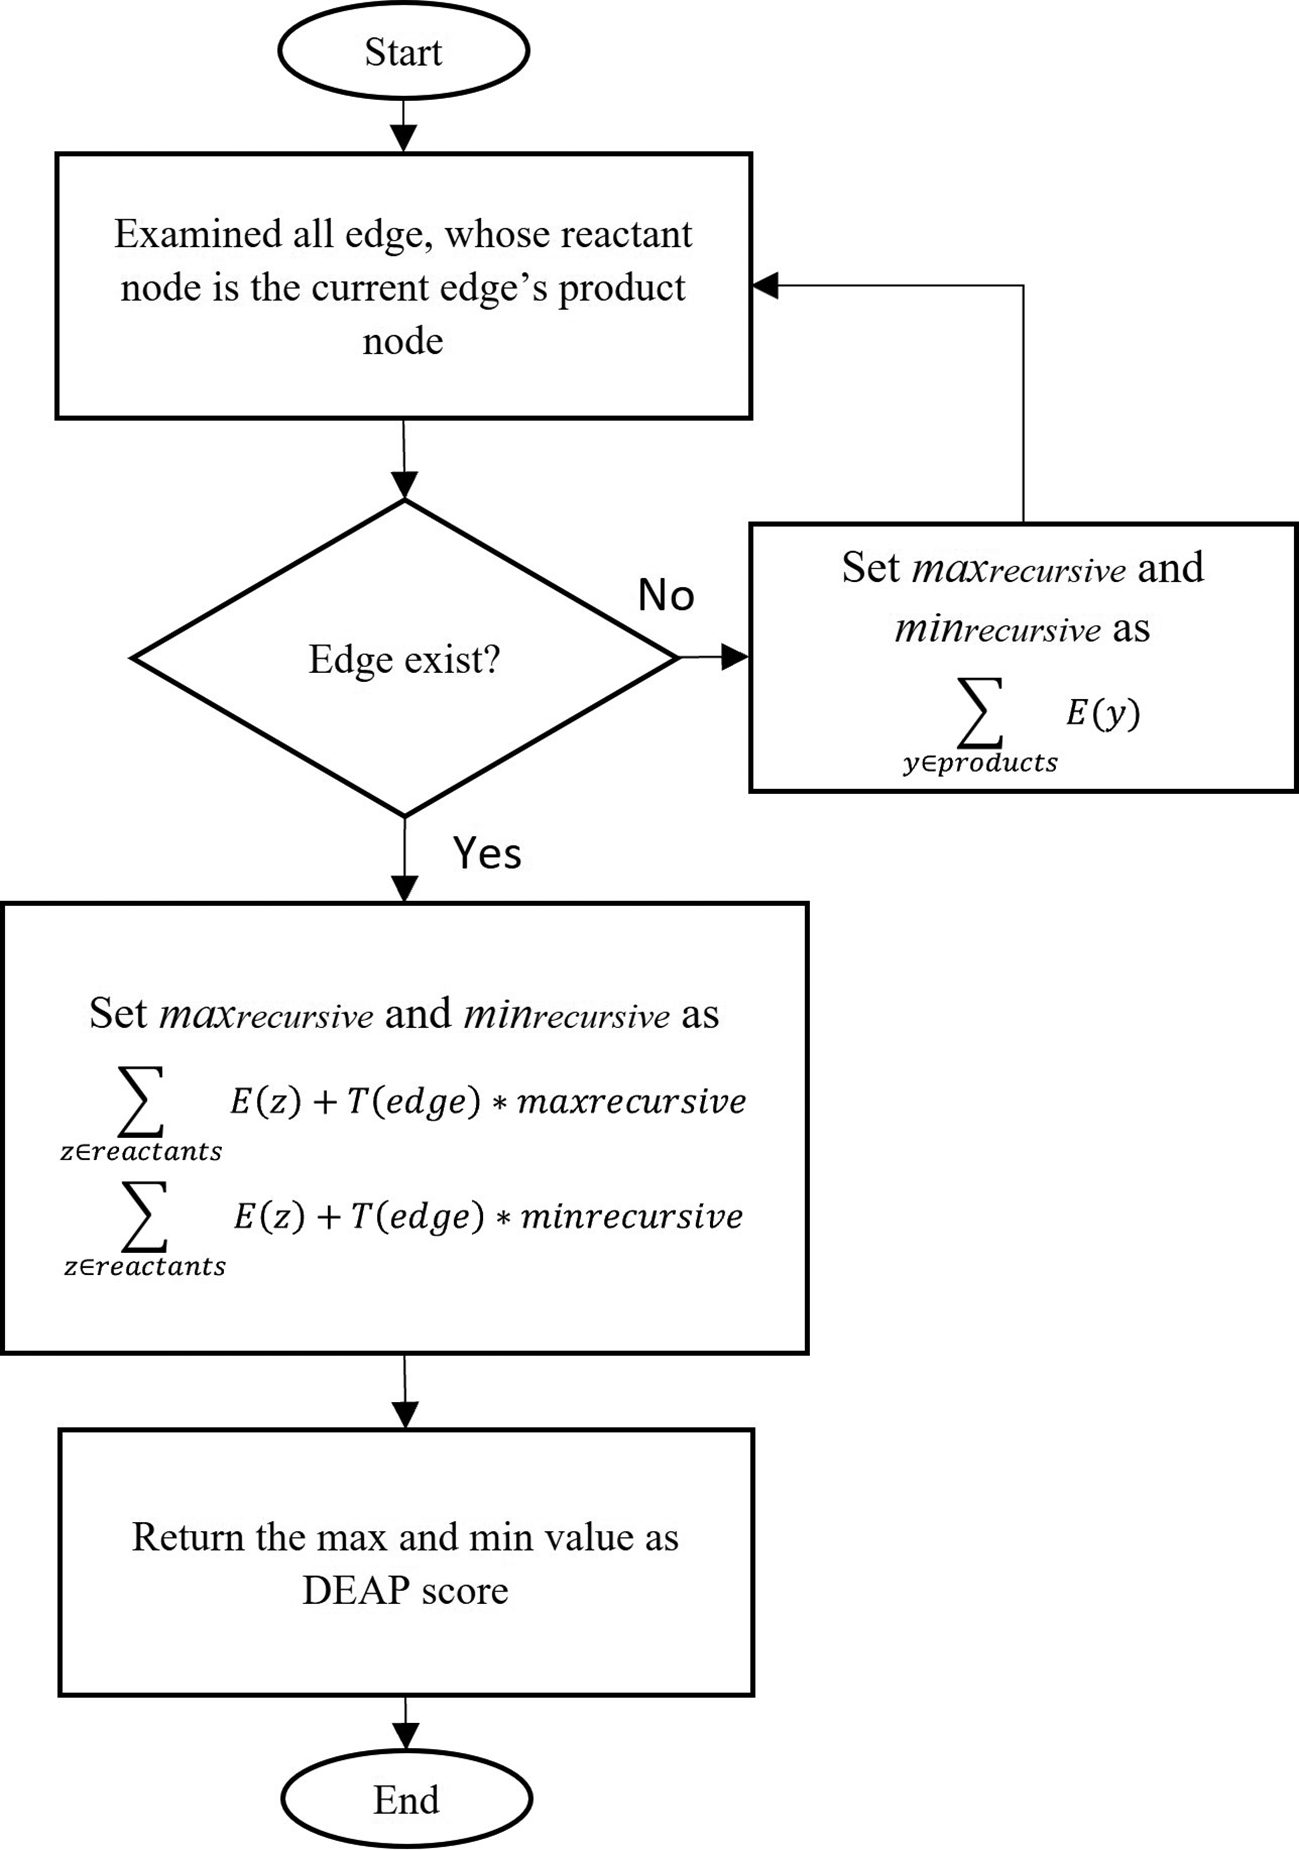
Given an edge and all other edges in the graph together with the expression values for all genes, we consider the expression data with two conditions (health/cancer), . This is defined to be the difference between the logarithm of the arithmetic mean of expression values associated with gene(s) x. Next, all edges in the sub-pathway are examined recursively, where maxrecursive represents the maximum values and minrecursive represents the minimum values of the edge. The algorithm examines all possible edges in the sub-pathway set whose reactant node is the current edge’s product node. If there are no such edges, we set maxrecursive and minrecursive as where y∈products refer to each gene contained in the edge’s products. Otherwise, maxrecursive and minrecursive are defined as the maximum and minimum score, respectively. The formula to calculate the maximum score and minimum scores is as follows:
Where is the multiplier associated with the edge type (-1 or 1) for inhibition or catalysis, z∈reactants refer to each protein, z, contained in the edge’s reactants. Finally, the maximum and minimum value of DEAP scores are returned for each sub-pathway. The process of establishing the DEAP score is shown in Figure 8.
The goal of this research is to include all relations or interactions within a pathway to provide a finer resolution to represent relevant biological process related to a given target phenotype. To support this, all scores of the sub-pathways are calculated together and the average of the scores taken. The average scores are calculated based on the maximum score of each sub-pathway based on the equation below:
In this equation, MaxScore represents the maximum score of every sub-pathway in the pathway. The maximum score of the i-th sub-pathway, MaxScorei is calculated based on the recursive function in DEAP. The average of the maximum score, avg is calculated by summing all MaxScores for a sub-pathway and dividing by the number of loops (n) in the recursive function for one pathway.
The average of the maximum score is used for the statistical calculation to evaluate the significance of a given pathway to the target phenotype. The statistics used here are based on maximum order statistics.15 The statistic calculation of the proposed method is shown by the following equation:
Since the research focuses on pathway-based analysis, two common data sets have been used: pathway data sets and gene expression data sets. Specifically, three gene expression datasets were used in this research. Table 1 shows the gene expression dataset used here. These three datasets which are head and neck tumor,20 colorectal cancer,21 and breast cancer22 can be downloaded from the NCBI GEO database.
| Dataset | No. of sample | No. of gene | Class | Author |
|---|---|---|---|---|
| Head and neck tumor cell lines | 7 | 22284 | 2 (normal/tumor) | 20 |
| Colorectal cancer | 12 | 54676 | 2 (normal/tumor) | 21 |
| Breast cancer | 100 | 22284 | 2 (normal/tumor) | 22 |
A total of 177 graph-based pathway data sets were downloaded in Systems Biology Markup Language (SMBL) format. For the interpretation, the pathways were broken into their protein components. Every pathway represented information about protein, biochemical reaction, and other substrates. The pathway data set is used to group the gene expression data based on the sample pathways. Matching processes between the gene expression data set and the pathway data set was undertaken. All the pathways were taken from the Protein Analysis Through Evolutionary Relationships (PANTHER) database related to regulatory and metabolic pathways.23 The pathway data sets can be downloaded at http://www.pantherdb.org/downloads/.
Most sub-pathway analysis methods are assessed based on the number of differentially expressed pathways found. In order to verify the performance of the iDEAP method, this research applied three sets of biological data on the biological pathways and made comparisons with previous work. The result of the proposed method was based on comparison with previous methods, namely the DEAP,15 SubSPIA,16 MinePath,24 HiPathia,25 and PsSubpathway.26 Table 2 shows the comparison result of the iDEAP method with the previous methods based on the number of informative pathways found. As noted, significant pathways were selected based on a p-value less than 0.05 (p-value ≤ 0.05). Generally, the performance of iDEAP method was improved based on the results obtained. This proves the effectiveness of the search algorithm for identification of informative sub-pathways. In addition, the interaction and relation between sub-pathways are important as additional information to help the medical sector detect diseases. By considering all interactions, the tendency to identify informative pathways related to the targeted phenotype is increased.
| Method | Number of significant pathways | ||
|---|---|---|---|
| Head and neck tumor | Colorectal cancer | Breast cancer | |
| iDEAP17 | 81 | 78 | 95 |
| DEAP15 | 12 | 98 | 5 |
| SubSPIA16 | 3 | 18 | 31 |
| MinePath24 | 17 | 64 | 26 |
| HiPathia25 | 30 | 43 | 25 |
| PsSubpathway26 | 26 | 51 | 77 |
The iDEAP method performed well for head and neck tumor and breast cancer but unfortunately, not for colorectal cancer. This is because the colorectal cancer data was not suitable for this research, since most of the genes were not complimentary to the pathway data resulting in sub-pathway interactions being reduced. Moreover, the huge size of colorectal cancer data could affect the results, since it might contain significant noise data that obfuscates the informative data.
The performance of the proposed method was evaluated through a 10-fold cross validation classification in terms of accuracy. These measurements were used to justify the method performance by using the identified informative genes in the sub-pathways. These genes were selected from sub-pathways with p-value less than 0.05 and underwent a classification process using support vector machine (SVM) algorithm based on a cross validation. SVM algorithm is widely used for cancer genomic classification and prediction. Therefore, the classification accuracy can be used to analyze the effectiveness of the proposed method in identifying informative genes to targeted phenotype. To get a consistent result, the classifications were run 10 times, then, the average was calculated. The comparison of the average 10-fold cross validation (CV) classification accuracy between the iDEAP method and DEAP method for all data sets is presented in Table 3.
It is important to validate the result in the biological context with literature and databases to show the relevance of the research. This validation was manually undertaken after the experiments were conducted. All the identified informative genes and pathways based on the result in the proposed method were checked through biological literatures and databases. This study used google scholar as the biological literature and Genecards as the biological database.
The pathways were analyzed individually and consequently produced corresponding p-value and informative sub-pathways. According to Figure 9, the top five pathways with the corresponding p-value and the associated list of informative genes were selected and validated based on the biological database and literature in order to show biological relevance.

Table 4 presents the top five pathways selected from the proposed method for the head and neck tumor data sets. The first ranked pathway was the Notch signaling pathway that has been implicated in the regulation of self-renewal capacity, cell cycle exit, and neural stem cell survival.27 Notch signaling is often associated with cancer diseases including head and neck squamous cell carcinoma (HNSCC).28 In addition, meta-analysis reveals that this pathway plays an important role in tumor development.29 The proposed method selected three informative genes for classification where all genes found were related to the development of head and neck tumors. CSL is one of the nucleus DNA-binding factors which interacts with an intracellular fragment of NOTCH.29 The NOTCH4 gene was found to be significantly related to HEY1 gene activation in HNSCC which promotes cell proliferation, cisplatin resistance, inhibition of apoptosis and cell-cycle dysregulation.30 MAML1 regulates transcription of Notch target genes and interacts with muscle-specific genes like MEF2C as a fundamental coactivator of other cell signaling pathways.31
| Pathway | p-value (<0.05) | Selected genes |
|---|---|---|
| Notch signaling pathway | 0.000033 | CSL,29 NOTCH4,30 MAML131 |
| TGF beta signaling pathway | 0.001236 | JUND39 EP300,40 CITED1, CITED2,41 FOXH1, DCP1A, JUNB,42 SMAD5,32 FOSL1, SNIP1, SKIL,43 DCP1B, SMURF1,44 SMURF2, DCP1B |
| Ras signaling pathway | 0.001412 | PIK3CA,45 PIK3C3,46 PIK3CG,46 PIK3CB,47 PIK3CD, HRAS, NRAS,47 KRAS48 |
| JAK STAT signaling pathway | 0.004789 | STAT5A, STAT5B, STAT3, STAT4, STAT1, STAT6,49 JAK3,50 JAK2, JAK151 |
| Interleukin signaling pathway | 0.037188 | STAT5A, STAT5B,49 STAT2,50 STAT3, STAT1, STAT4, STAT6,49 MAPK6,52 MAPK1,53 MAPK3,54 MAPK7, MAPK15 |
The second rank pathway with the lowest p-value was TGF beta signaling pathway. Transforming growth factor-β (TGF-β) is a homodimeric protein that is known as a multifunctional regulator in the target cell and plays a role in numerous types of cancer including HNSCC.32 The defective TGF-β signaling within epithelial cells promotes the growth of tumors and increases the inflammation in tumor stromal cells.33 From biological validation, seven of the 15 informative genes were identified (JUND, EP300, CITED2, JUNB, SMAD5, SKIL, SMURF1) as being related to the development of HNSCC.
The third rank pathway was the Ras signaling pathway. Ras is a family of proteins called GTPase that is commonly involved in cellular signal transduction.34 The Ras signaling pathway is rarely related to HNSCC, but this pathway had been shown to be highly significant to this cancer by a meta-analysis of differential protein expression networks.35 In this pathway, eight informative genes were selected by the proposed method and all the genes (PIK3CA, PIK3C3, PIK3CG, PIK3CB, PIK3CD, HRAS, NRAS, KRAS) were found to be involved in HNSCC.
The fourth rank pathway was the JAK STAT signaling pathway. This is involved in cell division, cell death and most importantly tumor formation.36 STAT signaling was identified by the literature to play an important role in cancer formation and progression.37 In addition, the constituents of JAK STAT activation have been recognized in many cancers including head and neck cancer.38 In this pathway, nine genes were selected for the classification and all these genes (STAT5A, STAT5B, STAT3, STAT4, STAT1, STAT6, JAK, JAK2, JAK1) were associated with HNSCC based on the literature.
Table 5 shows the top five ranked pathways identified by the iDEAP method for colorectal cancer data. The first top ranked pathway was the FAS signaling pathway. FAS also known as Apo1 or CD95, are death domain-containing members of the Tumor Necrosis Factor Receptor (TNFR).55 The FAS pathway was identified to be functional in colorectal cancer and induced apoptosis.56 Based on biological validation, only one (FASL) gene was identified to be related to the growth of colorectal cancer.
| Pathway | p-value (<0.05) | Selected genes |
|---|---|---|
| FAS signaling pathway | 0.000182 | FAS, FASL66 |
| 5HT3 type receptor mediated signaling pathway | 0.000851 | VAMP8, STX3,67 SNAP25, VAMP2,68 VAMP3, SNAP29, SNAP23, VAMP1,69 SLC6A4,70 SLC18A1, SLC18A2 |
| p53 pathway | 0.005318 | TP73,71 RCHY1,69 TP53,72 TP63, MDM2,73 MDM474 |
| PDGF signaling pathway | 0.036023 | PDGFRL,75 PDGFB,76 PDGFA77 |
| JAK STAT signaling pathway | 0.012335 | STAT5A, STAT5B, STAT3, STAT4, STAT1, STAT6,64 JAK3,78 JAK2, JAK164 |
The second top ranked pathway was the 5HT3 type receptor-mediated signaling pathway also known as the 5-Hydroxytryptamine3 receptor. This is a member of the cys-loop family of ligand-gated ion channels.57 Although there has been no study that has proven the direct relationship of this pathway to colorectal cancer, digestive function involvement in colorectal cancer is common.58 Furthermore, the expression of 5-HT3 subunits exist in the colon and the small intestine is related to colorectal cancer.59 From the iDEAP method, 11 genes were selected for classification and five of those genes (STX3, SNAP25, VAMP2, VAMP1, SLC6A4) were found to be involved with colorectal cancer.
The third ranked pathway was the p53 pathway which is a tumor suppressor protein in humans regulated by the TP53 gene.60 A previous study showed that the p53 tumor suppressor was frequently found in colorectal cancer.61 Consequently, six informative genes were selected by the proposed method and only five genes (TP73, RCHY1, TP53, MDM2, MDM4) were related to the development of colorectal cancer.
The fourth ranked pathway was the platelet-derived growth factor (PDGF) signaling pathway. This pathway has been studied in cancer progression as PDGF can regulate many cellular processes.62 The PDGF signaling pathway consists of four ligands and two receptors involved in colorectal cancer progression.63
The fifth ranked pathway was the JAK STAT signaling pathway, which is a chain of interactions between proteins involved in immune function, cell growth and tumor formation.64 Previous research has reported that this pathway was differentially expressed in colorectal cancer tissues.65 In this pathway, the proposed method selected nine genes for classification and all of these genes (STAT5A, STAT5B, STAT3, STAT4, STAT1, STAT6, JAK3, JAK2, JAK1) were found to be related to the development of colorectal cancer.
For the breast cancer data set, the result of the top five pathways is shown in Table 6. The first top ranked pathway was the Ras signaling pathway. As noted, Ras is a family of related proteins which belongs to the small GTPase class that is involved in cellular signal transduction. Mutation in Ras genes can cause unintended and overactive signaling inside the cell, thus Ras signaling pathways ultimately lead to cancer.79 Previous studies showed that this pathway was activated persistently in nine widely studied human breast cancer lines.80 Based on the proposed method, seven informative genes were selected for classification and all the genes (PIK3C3, PIK3CG, PIK3CB, PIK3CD, HRAS, NRAS, KRAS) were found to be involved in the development of breast cancer.
| Pathway | p-value (<0.05) | Selected genes |
|---|---|---|
| Ras signaling pathway | 0.001182 | PIK3C3,88 PIK3CG,89 PIK3CB,90 PIK3CD,91 HRAS,92 NRAS, KRAS93 |
| Notch signaling pathway | 0.002017 | RBPJ,94 NOTCH1,95 NOTCH3,96 MAML1, NOTCH2,97 NOTCH498 |
| JAK STAT signaling pathway | 0.003416 | CNR1,99 GNAI3100 |
| Thyrotropin-releasing hormone receptor signaling pathway | 0.006196 | CACNB3, CACNA1E, CACNA1A,101 CACNB2, CACNA1B,101 CACNB1,102 CACNB4103 |
| Interleukin signaling pathway | 0.029594 | STAT5A,104 STAT5B,105 STAT2,106 STAT3,107 STAT1,108 STAT4,109 STAT6,110 MAPK6,111 MAPK1, MAPK3,64 MAPK7,112 MAPK15 |
The second top ranked pathway was the Notch signaling pathway. This is involved in the development of neural tissues, blood vessels, heart, pancreas, mammary gland, T lymphocytes, hematopoietic lineages, and other cell types.81 The current study identified that the Notch signaling pathway had major participation and multiple roles during breast tumor progression.82
The third top ranked pathway was the JAK STAT signaling pathway. The Janus kinase-signal transducer and activator of transcription (JAK-STAT) pathway significantly contributes to the transmission of signals from cell-membrane receptors to the nucleus, playing a pivotal role in this process. Moreover, the JAK-STAT pathway is indispensable for numerous cytokines and growth factors, which are responsible for crucial cellular processes such as hematopoiesis, lactation, and the development of the immune system and mammary glands.83 A previous study revealed that chemoresistance in breast cancer was associated with the activation of JAK/STAT signaling and it was suggested that JAK2 may be useful in combating chemoresistance in breast cancer.84
Two informative genes (CNR1, GNAI3) were selected for classification and both genes were identified as being involved in breast cancer progression. The fourth top ranked pathway was the Thyrotropin-releasing hormone receptor (TRHR) signaling pathway. The TRHR is a G protein-coupled receptor that binds to the tripeptide thyrotropin releasing hormone.85 Dating back to the late 18th century, the administration of thyroid extract was often used in conjunction with oophorectomy as a treatment for breast cancer.86 In this pathway, seven genes were selected by the proposed method and six genes (CACNB3, CACNA1E, CACNA1A, CACNA1B, CACNB1, CACNB4) were found to be involved in the progression of breast cancer.
Finally, the fifth top ranked pathway was the Interleukin (IL) signaling pathway from the proteins of interleukins family. This pathway regulates numerous biochemical events, including cellular proliferation and long-term survival. Previous studies have shown many of the interleukin families contribute to the progression of breast cancer. For example, the IL17 family consists of six protein members, among them IL17B and its receptor. The IL17RB signaling pathway plays a key role in the development and progression of breast cancer.87 For this pathway, 12 informative genes were selected to undergo the classification process and only 11 genes (STAT5A, STAT5B, STAT2, STAT3, STAT1, STAT4, STAT6, MAPK6, MAPK1, MAPK3, MAPK7) were identified as being involved in the development of breast cancer.
Pathway-based analysis has led to a new era in genomic studies which integrates the benefits of gene-set analysis and enhances them with prior information based on gene interaction within pathways. However, early methods of pathway-based analysis relied on enrichment-based approaches and identified differentially expressed pathways without identifying specific regions related to the target phenotype.2 The results are not entirely accurate and complete since the current methods do not consider interactions involving functional molecular pathways.113 Usually, complex diseases like cancers involve interactions between genes that causes the genes to be expressed differently compared to a single gene. In order to obtain more specific biological knowledge, pathway-based analysis needs to shift to sub-pathway-based analysis which can identify regions of pathways that are dysregulated by diseases or involved in drug-related perturbations. Therefore, investigating sub-pathways is more relevant, since it can provide finer-grained resolution representing the underlying biological processes more accurately.114
One important feature of sub-pathway-based analysis is the ability to exploit the maximum interaction between nodes in pathways. In recent years, a series of methods had been developed to find solutions for sub-pathway analysis that identify informative sub-pathways accurately. This research proposes an improved differential expression analysis for the pathway (iDEAP) method which identifies informative sub-pathways and genes in pathways by considering all the interactions involved in the pathways. The iDEAP method extends the DEAP method by implementing the DMSP search algorithm to identify the informative sub-pathway as well as through modifying the calculation algorithm based on a recursive function used to obtain the average DEAP score for all sub-pathways. This is because the DEAP score of a single sub-pathway can lead to inaccurate interpretation since the size and structure among pathways are different.15 A Support Vector Machine (SVM) classification algorithm had been implemented to measure the performance of the proposed method based on the genes selected within significant pathways. Lastly, the iDEAP method used Genecards and literatures to validate the identified pathways and genes.
| Views | Downloads | |
|---|---|---|
| F1000Research | - | - |
|
PubMed Central
Data from PMC are received and updated monthly.
|
- | - |
Provide sufficient details of any financial or non-financial competing interests to enable users to assess whether your comments might lead a reasonable person to question your impartiality. Consider the following examples, but note that this is not an exhaustive list:
Sign up for content alerts and receive a weekly or monthly email with all newly published articles
Already registered? Sign in
The email address should be the one you originally registered with F1000.
You registered with F1000 via Google, so we cannot reset your password.
To sign in, please click here.
If you still need help with your Google account password, please click here.
You registered with F1000 via Facebook, so we cannot reset your password.
To sign in, please click here.
If you still need help with your Facebook account password, please click here.
If your email address is registered with us, we will email you instructions to reset your password.
If you think you should have received this email but it has not arrived, please check your spam filters and/or contact for further assistance.
Comments on this article Comments (0)