Keywords
Investment Portofolio, K-Means Clustering, LQ45 Index, Covid-19, Machine Learning
Investment Portofolio, K-Means Clustering, LQ45 Index, Covid-19, Machine Learning
COVID-19 not only poses a threat to human health but also has an impact on economic growth throughout the world, including Indonesia. All economic sectors have been negatively affected by the COVID-19 pandemic. Therefore, the Indonesian government implemented a COVID-19 prevention policy, including by strictly monitoring the traffic of foreigners and goods entering and leaving Indonesia as a form of prevention in these uncertain economic conditions. Although, several sectors continue to have been directly impacted due to the pandemic, namely the tourism, aviation, land and sea transportation, hotels, restaurants and manufacturing sectors.1 The COVID-19 economic impact is more complicated than 2008-2009 of global economic crisis. It was felt by all stakeholders in the business sector. The belief is that the COVID-19 economic impact is in the form of shocks due to negative supply conditions.2 There are two conditions that cause that economic shock. First, workers in the manufacturing sector were exposed to the virus so they stopped working, the implication of this being that factories reduced their production capacity. It is assumed that if 10 percent of the world’s population is infected with the COVID-19 virus, this will result in a serious labor shortage which will affect a country’s economic and financial infrastructure.3 Second, limited population activities to suppress the spread will have an impact on decreasing production, decreasing international trade, the creative economy, tourism and other economic activities.4
Then, the effect of the COVID-19 pandemic also put pressure on the index, especially LQ45, which was triggered by negative sentiment for global and domestic stock markets, namely the emergence of the corona virus or COVID-19 outbreak. At first this had no impact on the stock market, but as more and more losses were confirmed, the stock market reacted negatively.5 This has also caused prices in the stock market to decline significantly, including the LQ-45 index.6 The LQ-45 index is the main indicator in the Indonesian Stock Exchange (IDX), consisting of 45 stocks with the largest and most liquid capitalization levels, as well as the largest share ownership. The LQ-45 index was able to grow by 3.23% before the news of COVID-19 to Indonesia at the end of 2019. However, after the news of COVID-19’s spread, it affected the sentiment towards the value of the shares incorporated in the LQ45 index which decreased by 15%.7 This clearly affects the Indonesian economy and the Indonesian stock market, so that it will affect the reaction of investors and also the condition of the stock market on the Indonesian Stock Exchange as a whole.
The development of the capital market can be used as a benchmark for economic growth in a country where the capital market significantly contributes to economic growth.8 Capital market participation in economic growth is illustrated when investors receive profits in the form of dividends or capital gains and pay taxes to the state on the profits that have been received. The capital market is a bridge between investors and companies (issuers) and even the government through financial instruments (securities), namely stocks. Shares are the most frequently traded securities in the capital market, both common and preferred, because of their simple implementation so that people can invest not only in real sector but also in the financial sector.
In minimizing risk and getting the maximum profit from a stock in the midst of a recession due to the COVID-19 pandemic, investors really need understanding and knowledge to be able to create an optimal portfolio. Portfolios composed of a combination of individual stocks with optimal returns and minimal risk is an optimal portfolio. Stock diversification using portfolio analysis is the right decision to minimize large losses due to black swan events.9
Portfolio diversification is the practice of buying securities exposed to different risks, as opposed to putting all eggs in one basket. Therefore, if a black swan event has a negative impact on the price of one stock, other stocks will not be affected or even have reversed price movements, because they are not exposed to the same risk. While speculators may try to achieve this through diversification, reason-supported market-tested diversification methods, such as the ten to thirty stock sector diversification method suggested by Benjamin Graham,10 are often preferred. Because of the diversity of markets, there is no single “standard” method of portfolio diversification, even when the economic outlook is bright.
Over the past few years, many studies have investigated stock portfolio selection to understand how investment an portfolio is well formed. An investment portfolio is a collection of income-generating assets that have been purchased to meet financial goals.
Markowitz proposed a portfolio model using the average and variance of asset returns to express the trade-off between portfolio return and risk.11 Therefore, the Markowitz portfolio model is also called the Mean-Variance (MV) portfolio model. This model is an optimization problem with two opposing goals. This means that the expected return from the portfolio results needs to be maximized, otherwise the portfolio risk represented by the return variance of the assets needs to be minimized.
Various studies have been conducted to solve and develop the Markowitz portfolio model. All of this is done to adapt the existing model to financial market conditions and the demands of capital market players. One focus of research on portfolio selection is the time efficiency of selecting the optimal portfolio. This is understandable because the greater the number of securities involved in portfolio selection, the more likely the portfolio can be formed. The large number of securities involved in portfolio selection can be overcome by grouping security data using cluster analysis. Securities with similar characteristics are grouped into the same cluster.
Many studies on portfolio selection have used cluster analysis in the recent years, including Refs. 12–14, and Ref. 15, which shows that the optimal portfolio is obtained by using the mean vector (MV) Markowitz portfolio model. The main problem with the MV Markowitz portfolio model is that the mean vector and covariance matrices must be estimated from highly volatile data. Parameter estimation can be done with a variety of estimation techniques, which will definitely contain estimation errors. As a very important input in the formation of the MV Markowitz model portfolio, the estimation error will greatly affect the results of forming the optimal portfolio. Best & Grauer,16 Chopra & Ziemba,17 and Ceria & Stubbs18 have conducted several studies regarding estimation errors and their relationship to the formation of optimal portfolios. Based on this study, it was concluded that although the MV model is supported by a strong theory and has ease of calculation, the MV model shows several weaknesses. One of the drawbacks is that the optimal portfolio generated by this model is not well diversified and tends to be concentrated in a small proportion of assets.19 In addition, the MV model is also sensitive to changes in the input parameters, namely the mean vector and the covariance matrix.
Marvin20 proposed a portfolio diversification method using K-means clustering. Instead of just using daily stock movements as inequality metrics, he proposes using a company’s historical return on assets and asset turnover ratio as difference metrics. The reason is that the cluster approach based on stock price correlation, as proposed by Ren21 and Rosen,22 “is not stressful.” because the study was conducted before the Great Recession of 2008. Global economic crises such as the 2008 recession often wipe out annual growth in a matter of months. As an illustration, in March 2009, the Dow Jones index fell 7721.16 points or 54% from the highest in October 2007 at 14164.23 The S&P 500 index experienced an equally large drop of 38.5% in 2008.20 The 2008 recession erased more than 10 years of economic growth in less than 18 months and saw the collapse of industrial giants like Lehman Brothers. According to statistician, trader, and black swan theory creator Nassim Nicholas Taleb, such low-probability events are usually considered statistical outliers, but are often far more impactful than24 Taleb’s casual and predictable events. Thus, a good investment portfolio should always consider the possibility of high impact events and low probability. Taleb25 in this case, the potential impact of an unexpected economic crisis needs to be considered when creating a portfolio. Marvin20 claims that a company’s asset return and asset turnover ratio are much better indicators of a company’s financial health during times of recession. So, instead of using historical stock price data, Marvin20 proposes using the company’s quarterly report weighted average of the two ratios as the difference metric for clustering.
In actual situations, it is not possible to have data on future financial crises and use that data to adjust clustering and portfolio algorithms accordingly. Therefore, it is very important to separate the data before and during the financial crisis as training and testing data. The current ongoing recession caused by the COVID-19 shutdown provides an excellent testing ground for the performance of several variations of the algorithm proposed.20
In this study, the authors grouped stocks with different metrics of differences in the stock sample of LQ45 index member issuers. Stock grouping is done using the K-means clustering method on stocks on the LQ45 index over a period of 484 Days. The time period is the period when the recession inequality metric includes historical daily price movements of the stock and the company’s historical return on assets and asset turnover ratio. A diversified portfolio is then built with a combination of the results of the grouping and the stock sharpe ratio. This research is expected to determine and recommend the optimal portfolio of LQ45 member issuers during the pandemic and the recommendations given by the author to investors in choosing a stock portfolio during the upcoming recession.
The data used in this study is secondary data that has been obtained by collecting information from other intermediary media. Such consists of stock fundamental data, such as Return on Assets (ROA), & Asset Turnover obtained from the financial statements of each related issuer. Secondly is the daily stock price, the closing stock price during the study period which reflects all the information available on that day from the LQ45 Index, Indonesia Stock Exchange member issuers. The research period conducted from January 1, 2019 to December 31, 2020 which is the period before and after the pandemic hit. The time span will be divided into two periods, (1) the period before the pandemic, which is January 1, 2019 – December 31, 2019 & (2) the period of the pandemic, which is January 1, 2020 – December 31, 2020.
The stock fundamentals used as research input variables in the stock clustering stage are Return on Assets (ROA) and Asset Turnover. While the technical variable used in building the portfolio from the cluster results is the sharpe ratio as shown in Table 1.
| Variable | Description | Scale |
|---|---|---|
| Xp | Stock Code | Nominal |
| X1,p | ROA 2019 | Ratio |
| X2,p | Asset Turnover 2019 | Ratio |
| X3,p | Sharpe Ratio 2019 | Ratio |
| X4,p | ROA 2020 | Ratio |
| X5,p | Asset Turnover 2020 | Ratio |
| X6,p | Sharpe Ratio 2020 | Ratio |
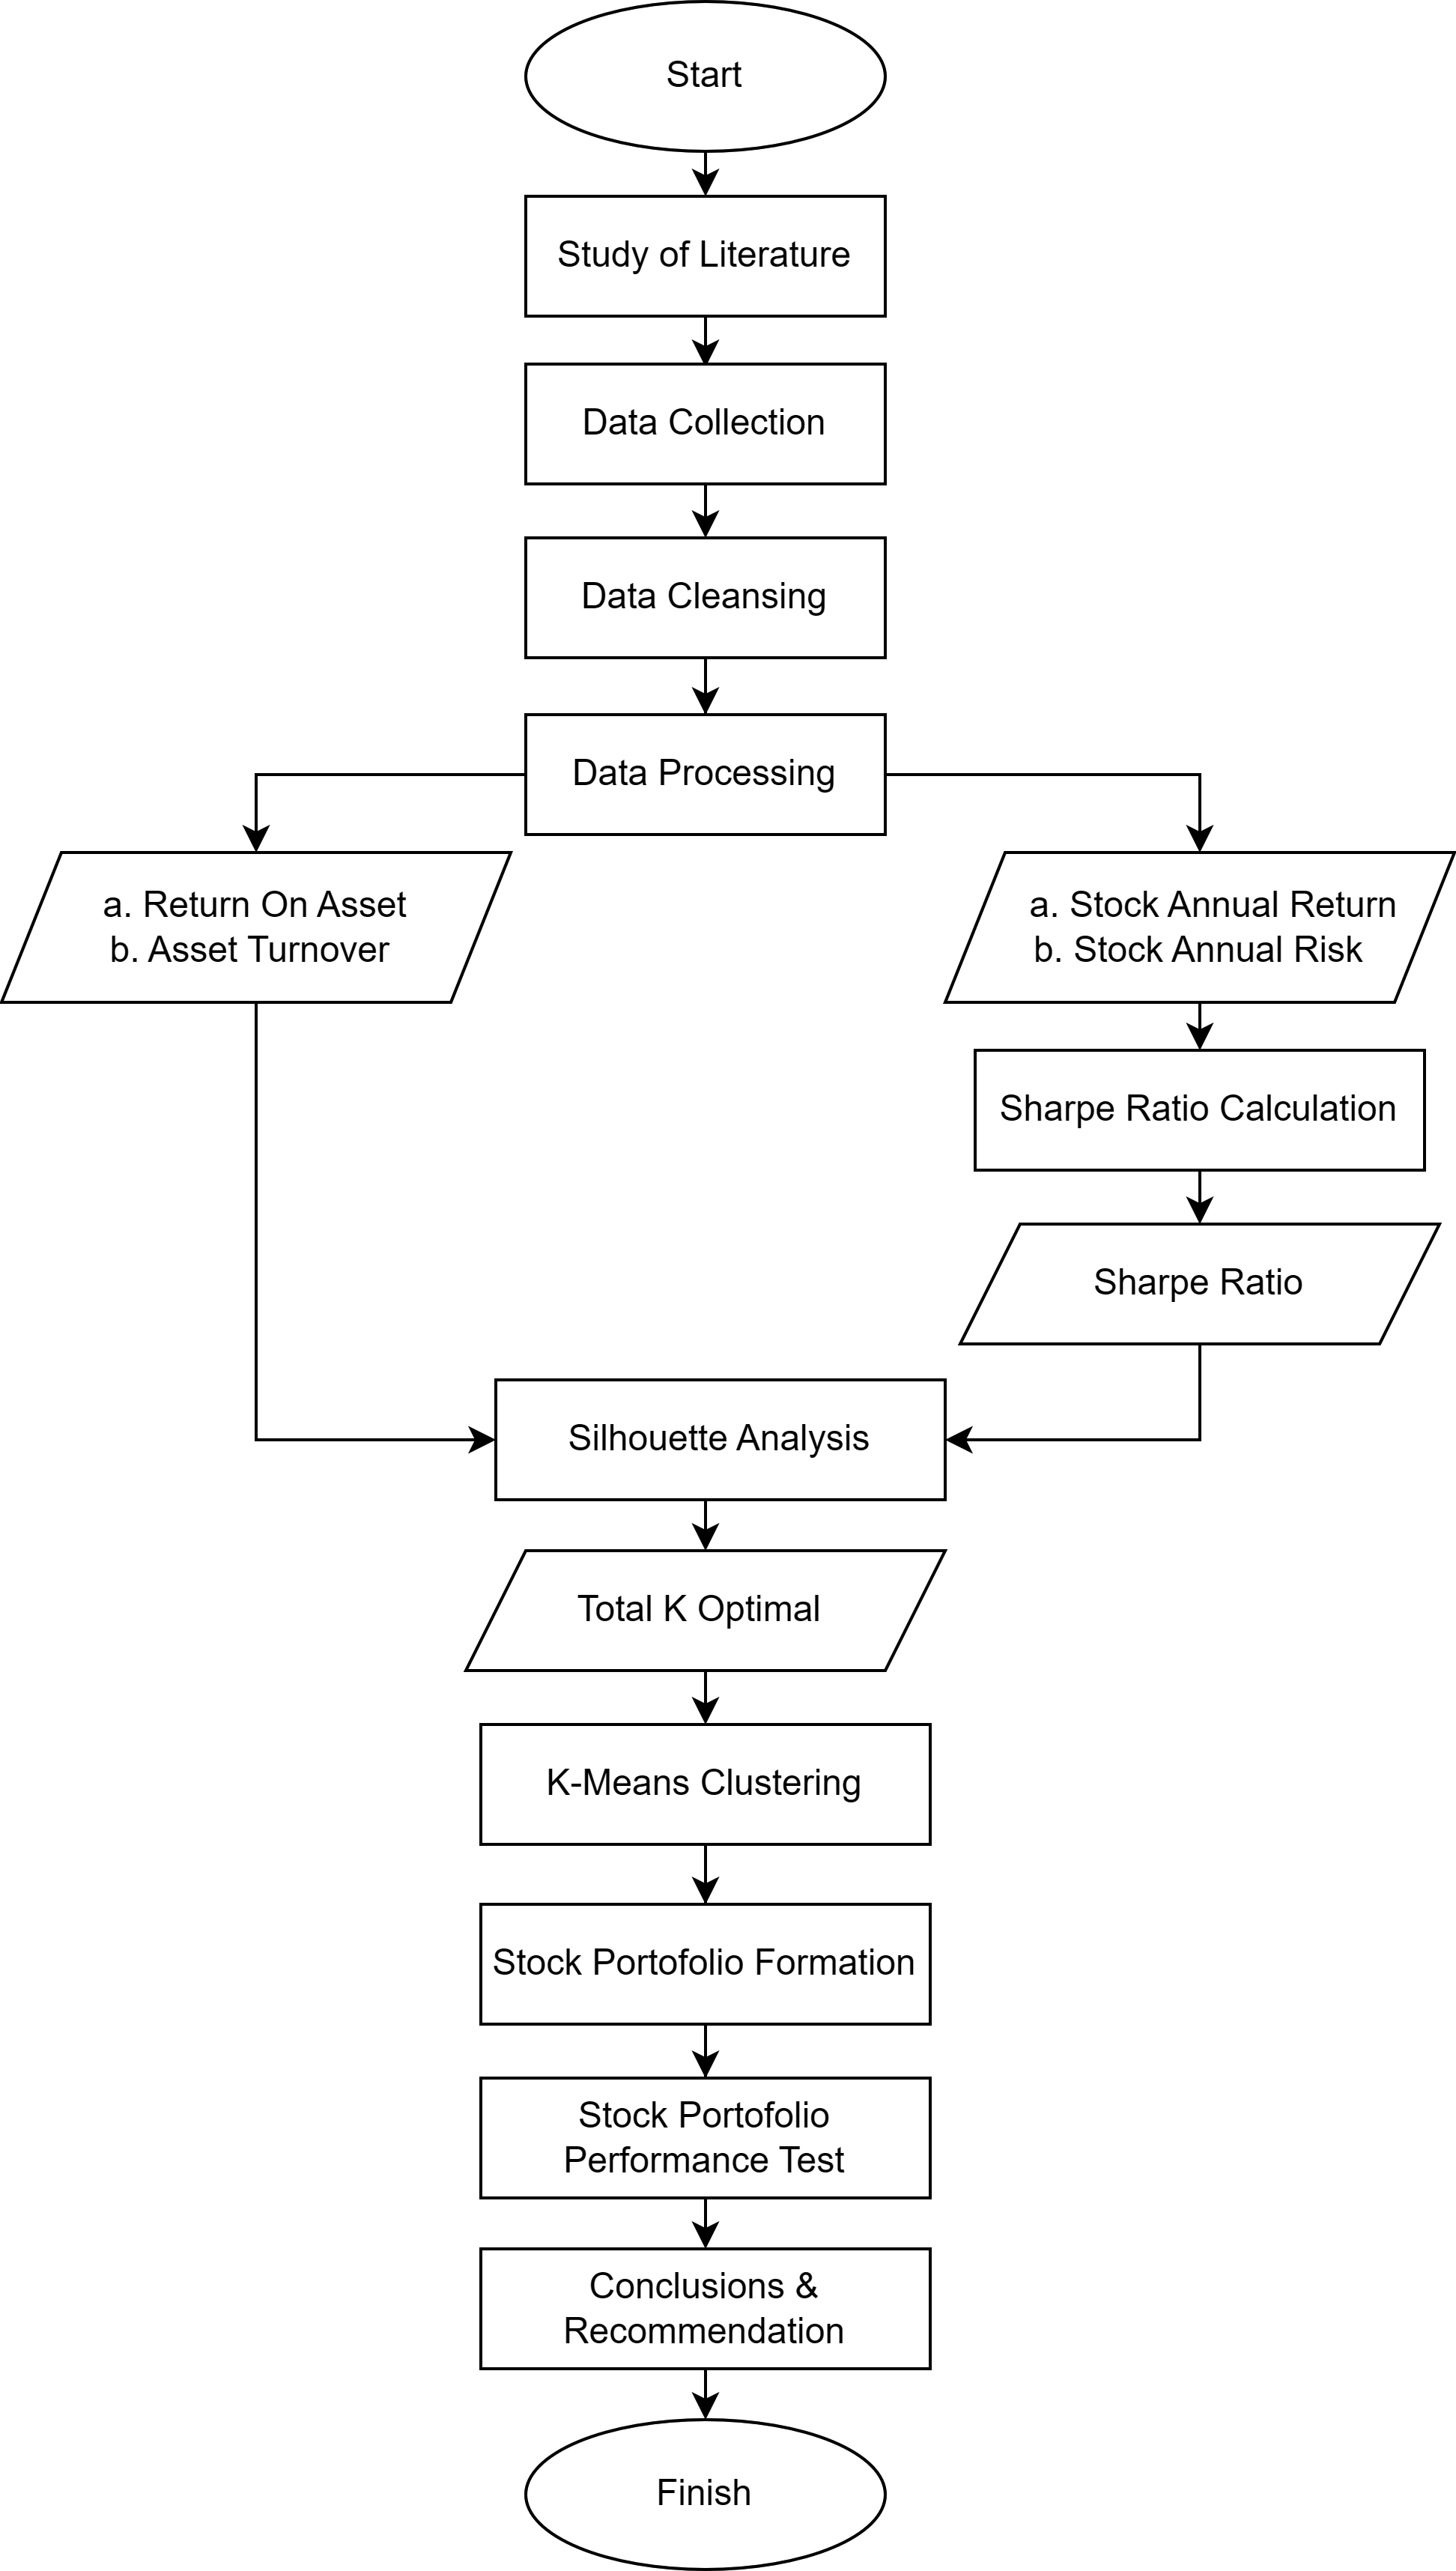
The author divides research activities into 6 stages: (1) Data Crawling/Collection, (2) Data Cleansing, (3) Data Processing, (4) K-Means Clustering, (5) Portfolio Formation, (6) Portfolio Performance Test, as shown in Figure 1.
A. Data Crawling/Collection
Companies selected as data in this study must consistently be in the periodic evaluation of the LQ45 Index during the study period. Stock data was obtained from Yahoo Finance and the IDX website through the Application Programming Interface (API) request using the pandas datareader module from the Python programming language.
B. Data Cleansing
Data cleansing is done to eliminate companies that have incomplete data. After the cleaning process, 10 companies were finally eliminated, leaving 35 companies.
C. Data Processing
At this stage, the initial processing of the data will be carried out before being used in the data analysis stage. The steps taken are in the form of calculation of return on asset, asset turnover, calculation of stock daily returns, stock quarterly returns, stock quarterly risks, sharpe ratios, etc and a brief discussion of how to plan data analysis to be carried out.
D. K-Means Clustering Analysis
In this section, there are two stages that will be carried out, first to determine the optimal number of clusters using the silhouette method and then from the results proceed to the second stage, clustering using k-means clustering. The results of the cluster will then be used for further analysis in the next data analysis section. Each cluster will be analyzed in detail.
E. Portofolio Formation
In this section it will be determined which clusters have good performance. Then, from the selected clusters, the best shares will be determined as representatives of the cluster to be formed into a stock portfolio. Sharpe ratio variable will be used in determining the best stock from each cluster.
F. Portofolio Performance Test
The actual data on the price of each share from January 1, 2021 to December 31, 2021 will be used in the portfolio performance testing phase that has been formed from the previous stage. Return from each portfolio will be used as the main indicator in the testing phase. In addition, correlation of all stocks of each portfolio will also be carried out to see how strong the relationship between price changes is between one stock and another.
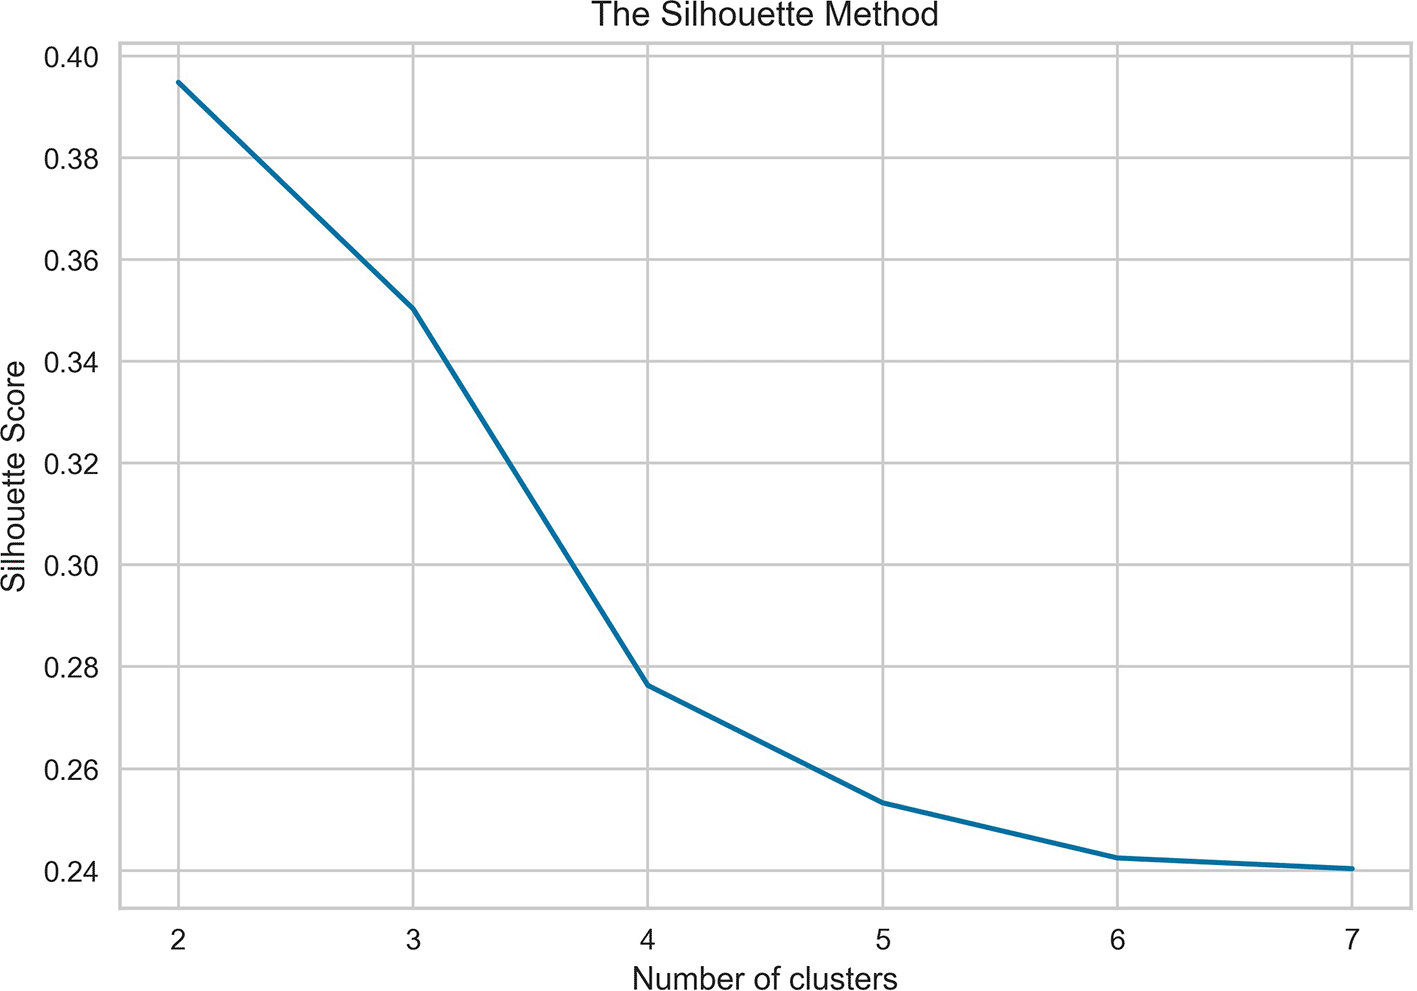
There are two stages carried out in the stock clustering process, the first is a silhouette test to determine the optimal number of clusters, then stock clustering is carried out using the k-means method. Both stages are carried out using the python programming language using the KMeans module from Scikit Learn.
Figure 2 show that first we assume that the 4 number of clusters has 0.28 (>1) in silhouette score that means clusters are well apart from each other and clearly distinguished, support with a large number of clusters compared to just dividing the cluster into 2 or 3.26 Then to see further the selection of the best number of clusters, a silhouette plot analysis was carried out using the yellowbrick module in the Python programming language. Figure 3 shows that 4 clusters is a more optimal number of clusters as seen from the distribution of the number of members which is fairly distributed to each cluster and has a silhouette coefficient value past the average silhouette score as shown in.
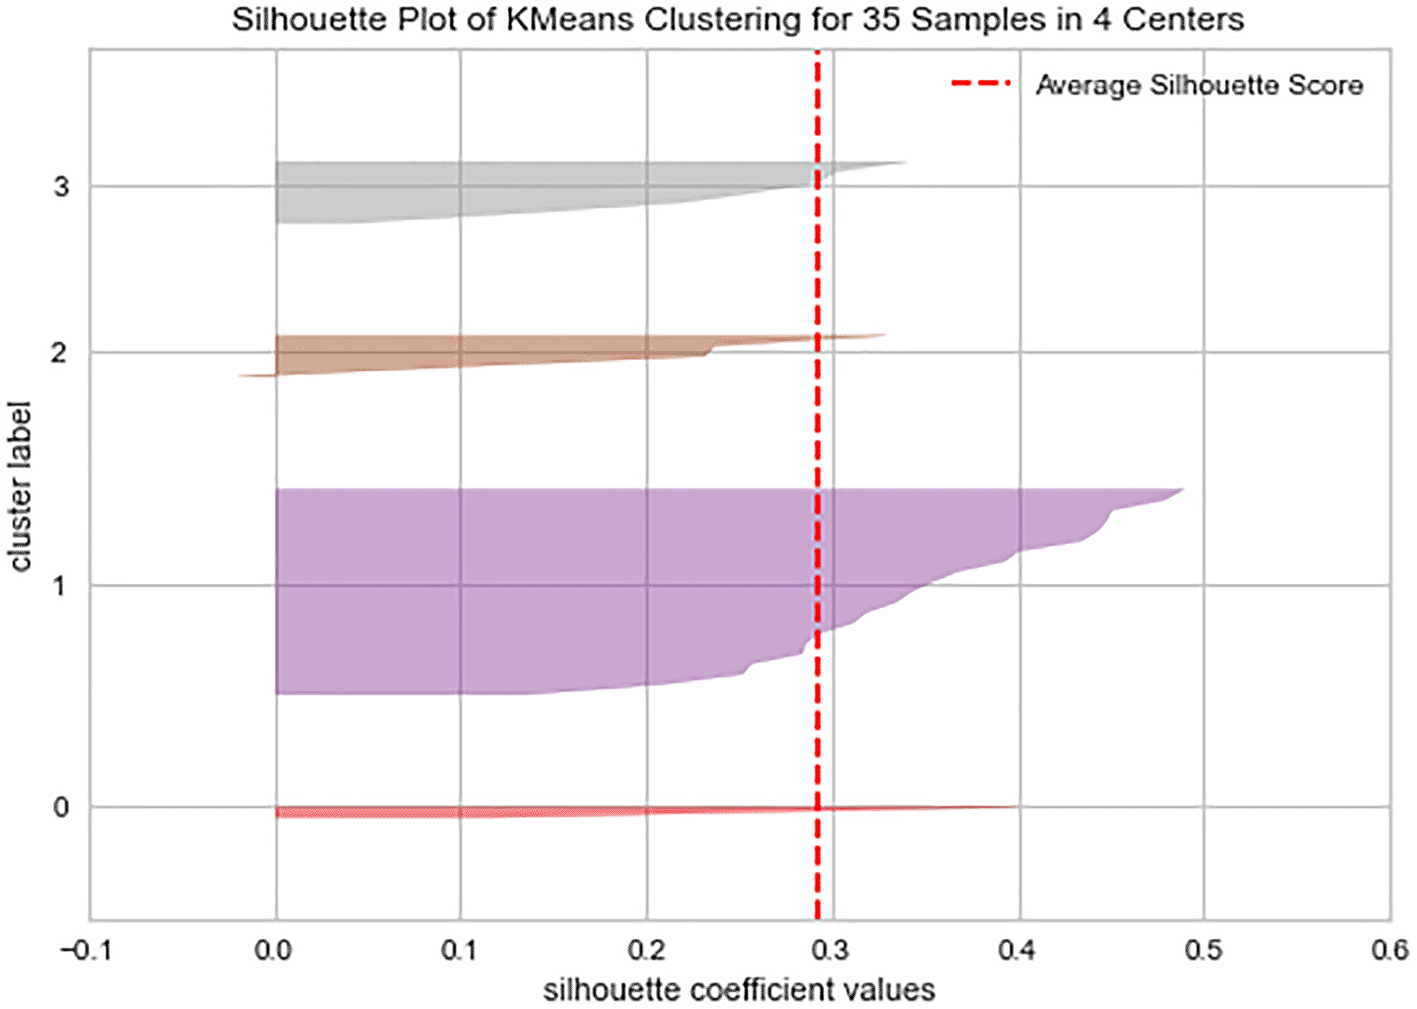
After being grouped into 4 different clusters, it found that a total of 51% or 18 shares were included in cluster 2 and as many as 23% or 8 stock issuers were included in cluster 1 as the dominant clusters as shown in Table 1. Cluster 3 has members of 7 stock issuers and cluster 4 is found to consist of only 2 stock issuers. Clusters 1 & 2, which are the dominant clusters, represent the general pattern of stock indicators owned by the LQ45 Index during the period of the research data. While the rest are stocks that have stock indicator patterns that tend to be different from other stocks.
Further analysis of each cluster will be carried out in the following analysis stage.
Cluster 1 is a cluster consisting of asset intensive industries business where these companies do business by maximizing assets of great value to generate revenue/profits such as large mining and construction equipment. It can be seen from the graphs in Figure 4, issuers of cluster 1 members are companies that generate quite large revenue from their assets but their profits are quite eroded below 10% due to operational costs ranging from large asset maintenance to high operating expenses and liabilities due to the amount of capital that must be invested initially to do business in these industrial lines.
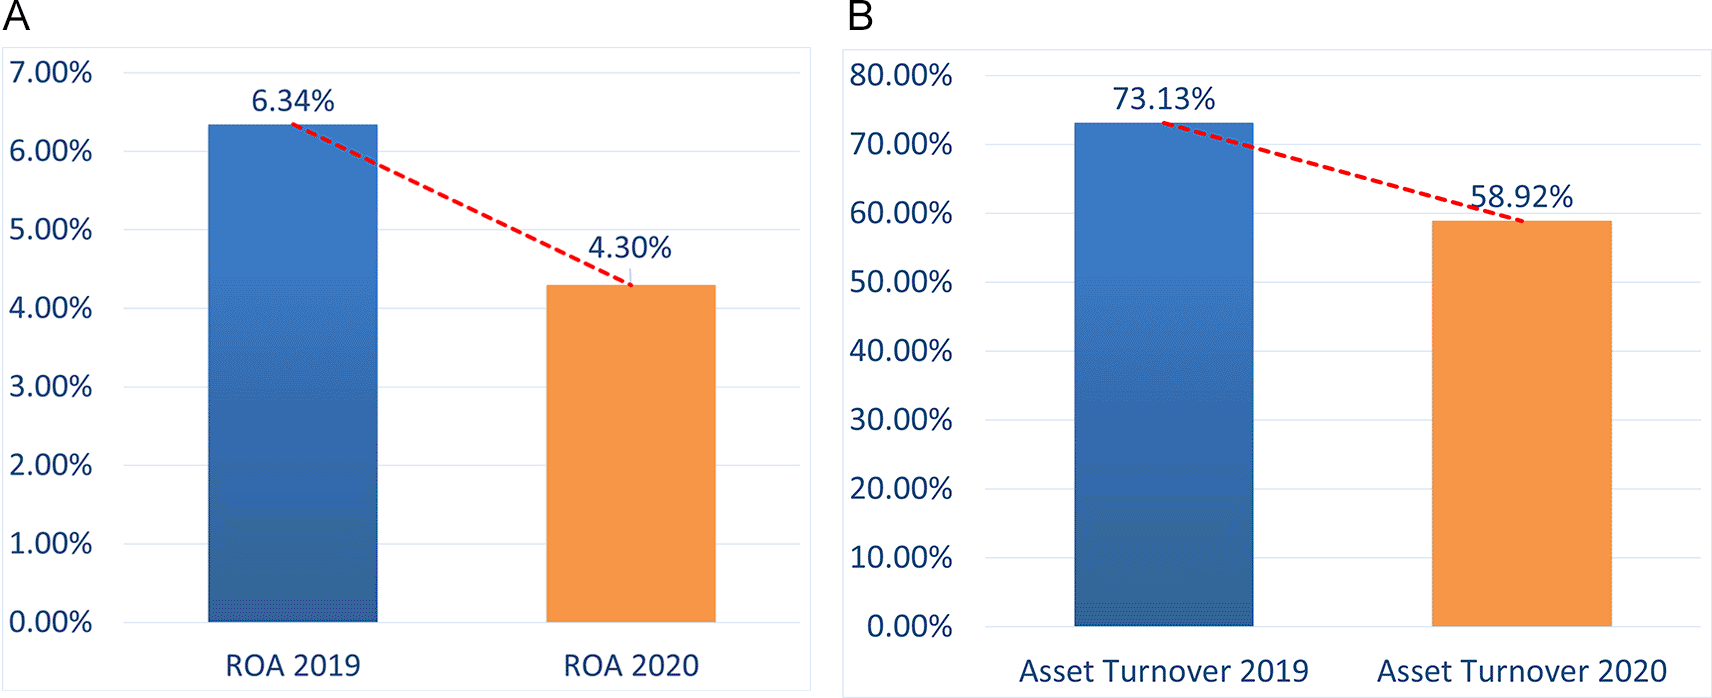
Figure 5 shows that this cluster is the one that receives the highest profit return during the pandemic and even the recession in 2020. This illustrates that this cluster member have very positive sentiments, supported by the government’s efforts to keep running their businesses. This is also supported by public confidence in gold and other precious metal instruments as an alternative to transferring investment funds during the pandemic, because they are considered quite stable and have little risk compared to other investment instruments.
Cluster 2 is the cluster with the most members among all existing clusters who dominated by banking stocks where these stocks are companies that use capital/capital from how much money is saved or invested in the company. There are also property & construction issuers who experienced a very high decline in sales due to the level of people’s purchasing power.
Figure 6 shows that cluster 2 consists of stock issuers who have a fairly low ability to convert asset values into revenue & profit when compared to other clusters, the value of the revenue ratio before and during the pandemic was only in the range of numbers below 50%. However, when compared to cluster 1, this cluster is quite successful in converting a small volume of revenue into a fairly high profit. This is an illustration that stocks in cluster 1 have a tendency to have operational costs that are not as large as other clusters in carrying out their business processes.
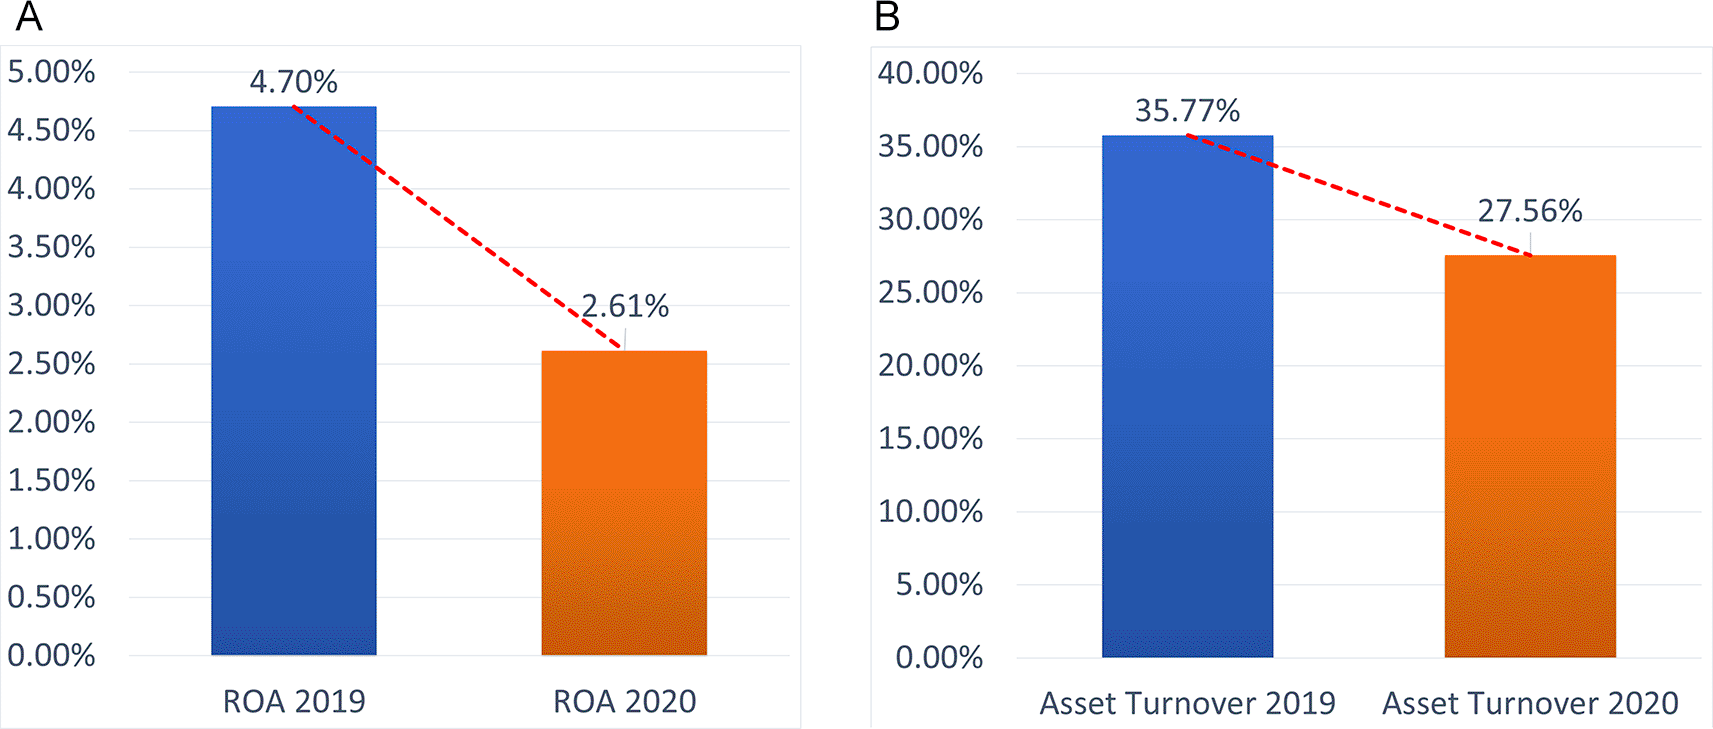
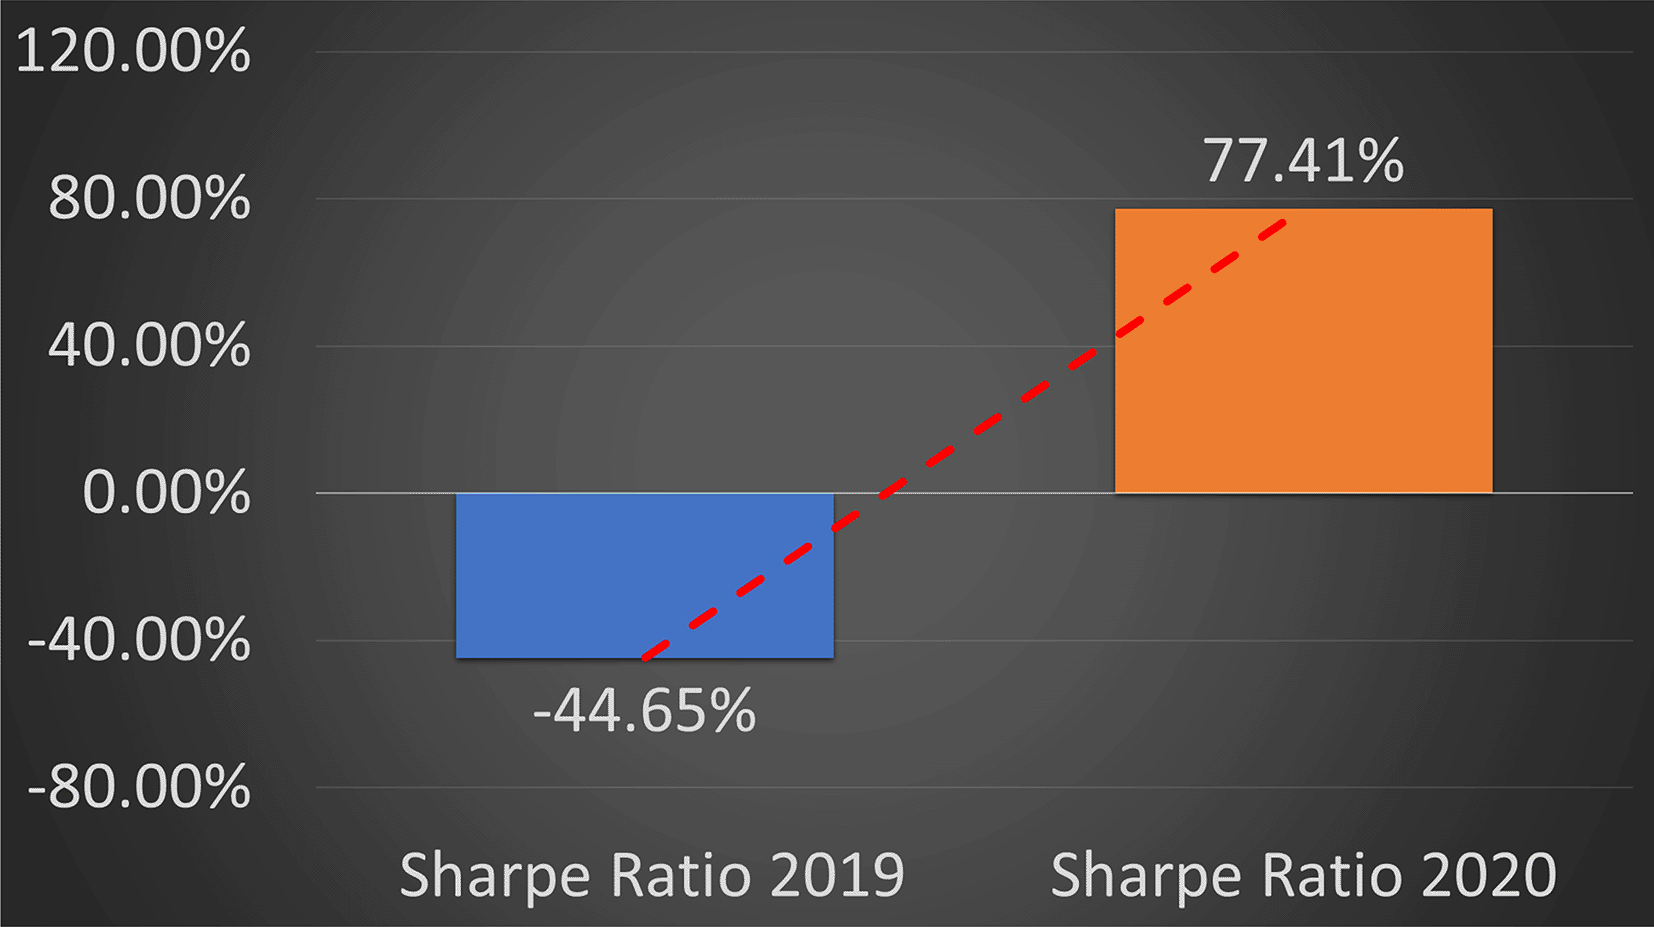
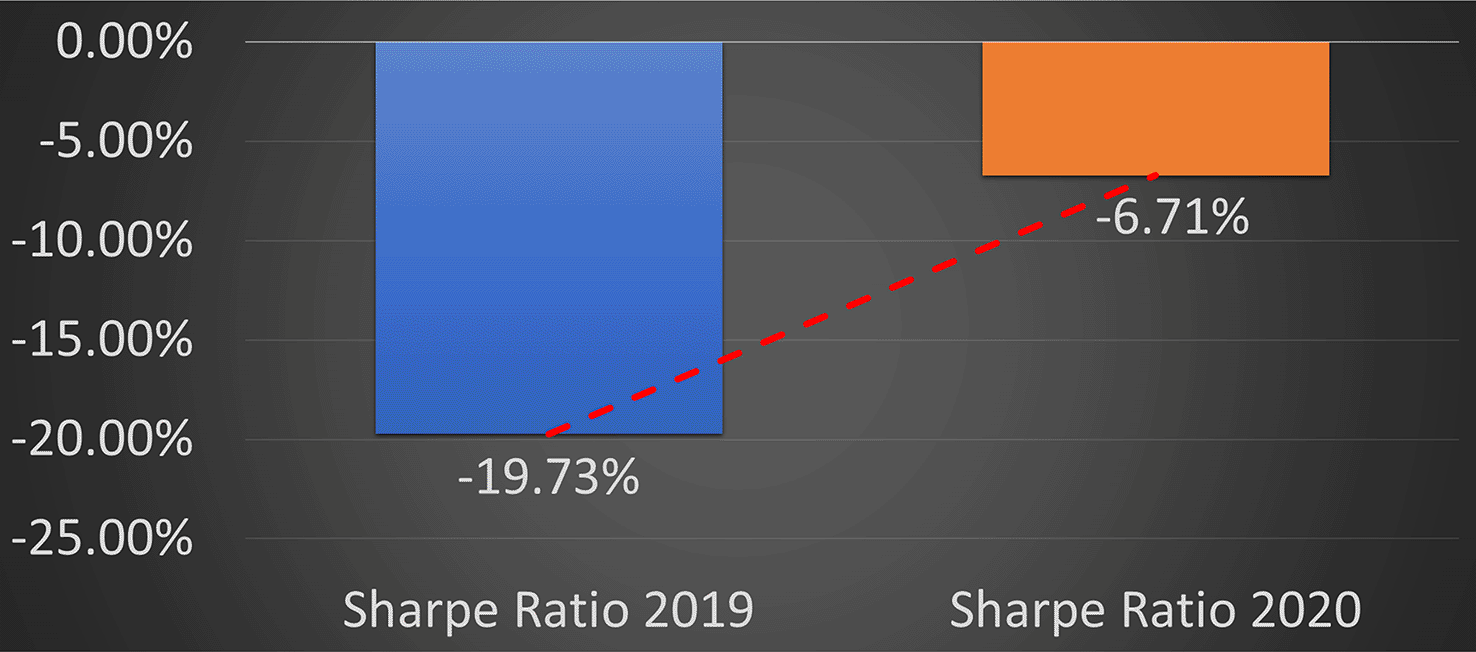
Figure 7 shows the change in the sharpe ratio of cluster 2 before the pandemic to after the pandemic took place. It can be seen that the companies in this cluster 2 are stocks that experienced sluggish business during the pandemic. This also has a lot of impact on the level of investor confidence in seeing the risks of the issuers’ businesses.
Cluster 3 consists of 8 issuers who are members of the cluster who run their business directly with end-customers/commonly referred to as B2C. With the decline in purchasing power that occurred in the community during the pandemic which should have resulted in a decrease in both sales volume and profits to these companies.
Figure 8 shows that issuers are companies with fairly good business fundamentals with a decrease in the ratio of profit and revenue to assets not as big as in other clusters during the pandemic period. This happens because the majority of the members of this cluster are stocks from the consumer cyclicals industry where this industry are issuers whose business is primary goods for the community, meaning that during the pandemic period people will tend to continue to buy goods from the public sector. Online shopping applications, which are increasingly being used during the pandemic, also have an efficiency effect on transportation and operational costs for consumer cyclical companies to be able to survive more against the onslaught of recession due to the COVID-19 pandemic.
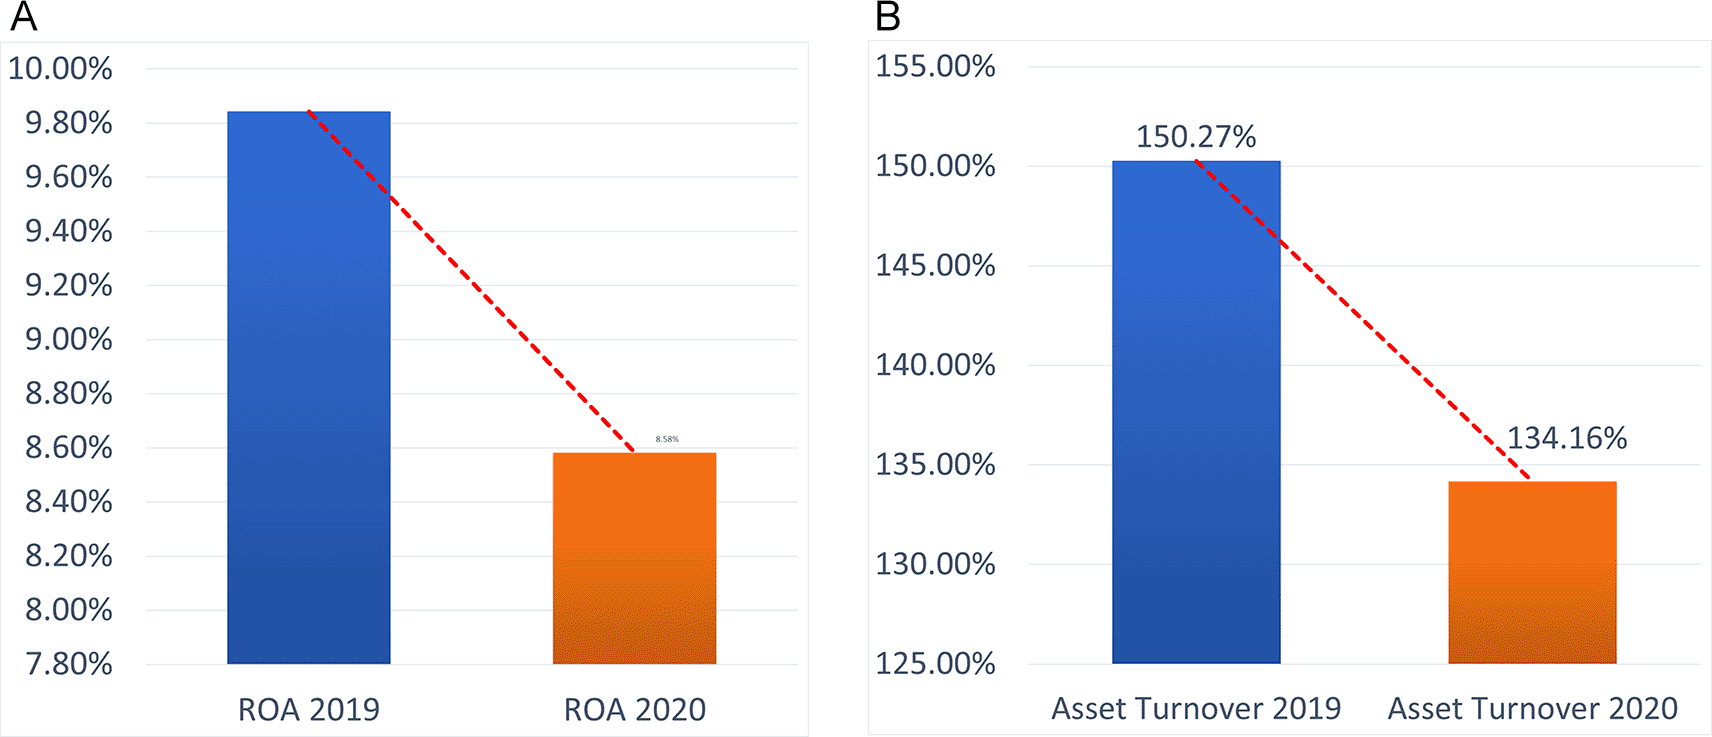
Figure 9 shows that there was an increase in the sharpe ratio value of issuers that are members of this cluster. This illustrates that this cluster does experience an increase in positive sentiment by the public during the pandemic, one of which is because these issuers are companies doing business with basic needs for the community such as PT Charoen Pokphand Indonesia Tbk which produces chicken meat, eggs and other processed foods.
Cluster 4 is the last cluster in which only 2 members who were big enough to do business directly with end customers with products that have a daily cycle consumption. In view of this, although there has been a massive decline in people’s purchasing power, especially in secondary and tertiary goods during the pandemic period, the products of the two issuers of this cluster member should include those that will survive and are needed by the community for daily use.
Figure 10 are graphs of ROA and Return Turnover from cluster 4 during the study period. It can be seen from the graph that the stocks in cluster 4 are companies that can effectively convert revenue into large profits compared to other clusters when viewed from business fundamentals. These strong business fundamentals can mean that the company has an efficient strategy in reducing the costs needed to generate the sales value. Although it is also seen that there is a significant decline in the sales volume ratio and the profit to asset value ratio during the pandemic period.
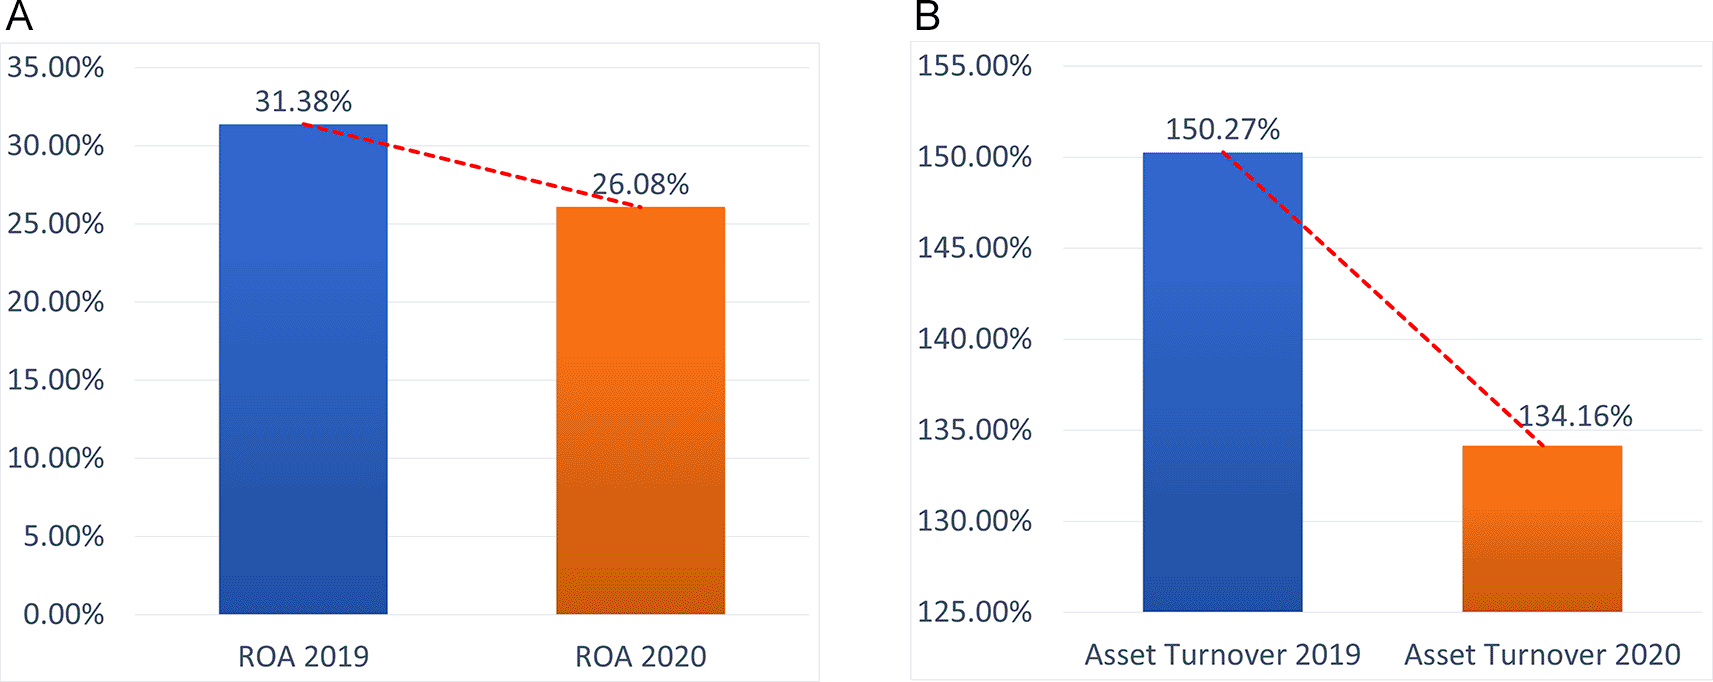
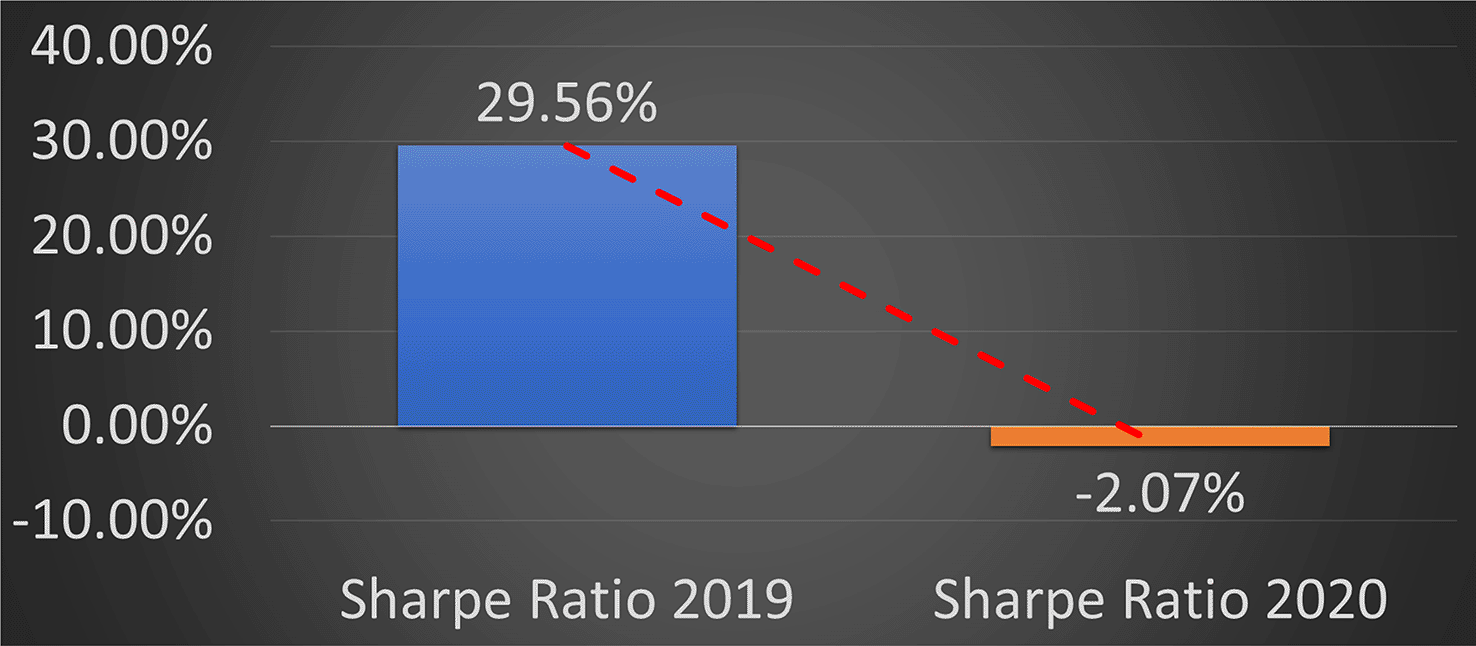
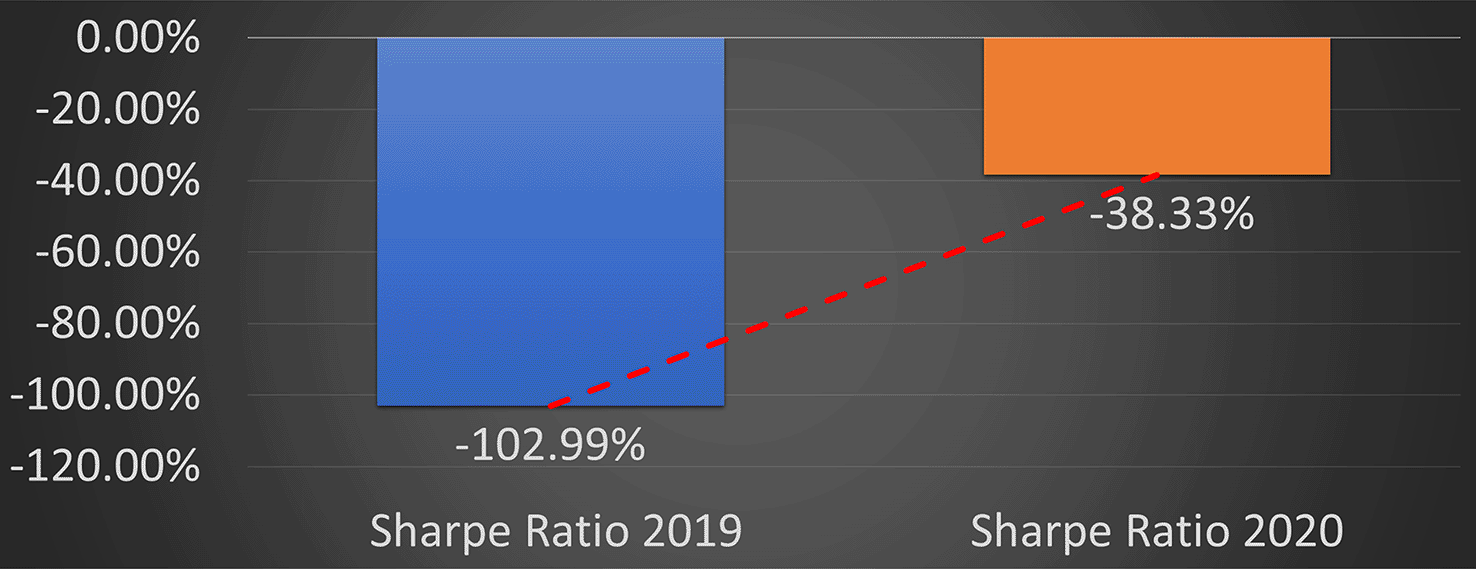
Figure 11 shows the change in the percentage of sharpe ratio both before and after the COVID-19 pandemic took place. It can be seen that before the pandemic, the sharpe ratio or it could be said that the return generated in investments in these issuers gave a fairly deep loss. However, it turned out that during the pandemic period, the public gave optimism to these cluster 4 member companies because their business products were goods that were used daily and consumers tended to buy these products regularly. Therefore, it can be seen that the sharpe ratio increased which was quite significant during the year during the pandemic, although the increase still provided a negative return for investors who invested their capital in the issuer in the short term. However, when viewed from its excellent business fundamentals, long-term investment is a wise thing to invest in the shares of this cluster 4 member.
After completing the analysis of cluster results, the next step is the formation of a stock portfolio based on the results of the analysis of these clusters. Stocks that have the highest sharpe ratio in their cluster will be selected to form a portfolio. The two best stocks from each cluster can be seen in Table 2.
| Cluster | Stock code | Sharpe ratio |
|---|---|---|
| 1 | ANTM | 0.90 |
| INCO | 0.53 | |
| 2 | BBCA | 0.69 |
| MNCN | 0.61 | |
| 3 | ERAA | 0.25 |
| CPIN | 0.06 | |
| 4 | UNVR | -0.38 |
| HMSP | -1.03 |
Based on the results of the sharpe ratio rating, the best stocks selected were ANTM as a representative from cluster 1, BBCA as a representative from cluster 2, and ERAA as a representative from cluster 3.
Then, the actual data on the prices of the three stocks from January 1, 2021 to December 31, 2021 will be used to test how effective the clustering method is in forming the portfolio that has been carried out from the previous stage.
The selected portfolio has a return of 21.8% against its initial price and -1.4% for the LQ45 index yearly return (Table 3). Table 4 also shows the portfolio has a general risk of 0.0798. As for the diversifiable risk indicator, the selected portfolio has a diversifiable risk value of 0.0139. Then, the selected portfolio has an undiversifiable risk of 0.0658. Based on the results of the analysis, the selected portfolio includes a small risk for investors to invest their funds in the portfolio. To see further how the selected portfolio performs, an analysis of the return of each stock will be carried out.
| Return | Risk (variance) | Diversifiable risk | Undiversifiable risk | ||||
|---|---|---|---|---|---|---|---|
| LQ45 | -1.4% | LQ45 | 0.0301 | LQ45 | 0.000 | LQ45 | 0.0301 |
| Portofolio | 21.8% | Portofolio | 0.0798 | Portofolio | 0.0139 | Portofolio | 0.0658 |
In addition, correlation of all stocks of each portfolio was carried out to see how strong the relationship between price changes is between one stock and another. Table 5 shows the selected portfolio has proven to be well diversified using the clustering method. All stocks in the two portfolios have a correlation value which is included in the category of relatively low correlation, which is below 0.2. Even BBCA shares have a very low correlation, which is below 0.1 with respect to other stocks.
| ANTM.JK | BBCA.JK | ERAA.JK | |
|---|---|---|---|
| ANTM.JK | 1 | 0.098769 | 0.191691 |
| BBCA.JK | 0.098769 | 1 | -0.00975 |
| ERAA.JK | 0.191691 | -0.00975 | 1 |
Furthermore, based on a thorough analysis of this research, economic and financial implications are obtained where existence of a demand and supply shock due to the global effects of the pandemic resulted in significant fluctuations in the stock returns of LQ45 members compared to the period before the pandemic. The same thing happened to the risk of member shares which experienced a high increase compared to 2019 before the COVID-19 pandemic took place in Indonesia. Many employers laid off their employees when operations were disrupted and the companies has to reduce the amount of production produced. While on the other hand, people’s purchasing power has also experienced a significant decline due to everyone only focusing on primary needs, one of which is health. LQ45 stocks tend to experience high volatility with price declines across all business sectors. This has an impact not only in terms of the capital market, but also on the company’s business fundamentals, the majority of which have experienced corrections due to the pandemic.
With the global economic domino effect resulting from the COVID-19 pandemic, this study also proves that systemic risk that has occurred is an awareness for investors to be really strong in undergoing and studying the situation and must be able to make investment decisions with a strategy that appropriate. The COVID-19 pandemic situation was initially on a short-term scale, but gradually moved on a long-term massive scale which caused blackswan events like what is happening now. Learning from this incident, investors certainly need to diversify their investment portfolio in the future.
This study also shows that Markowitz’s portfolio theory can be applied as an alternative to reduce the level of risk, by diversifying investments into various other stock options and not focusing on one stock only.11 In addition, stock risk in the form of stock variance also needs attention.27 In addition, it is also in line with the signal theory by spence28 where the government can announce various economic indicators in each period to anticipate for all parties. In certain situations and conditions, the company with the most profitable prospects will optimally provide a signal about its condition so that investors will know which issuer to choose and continue their investment.29
Utilization of the stock clustering method is considered to be used by investors to identify the nature of price movements and the nature of the company’s business fundamentals. By clustering the stock’s fundamental and technical indicators, investors can find unique patterns owned by certain groups of stocks, not only from highly volatile market movement patterns in the short term but also assessing the company’s business fundamentals in the long term and then using the information in making decisions to make better investment decisions.
Some industries that seem to be still quite competitive during the pandemic are the basic materials industry where this company sells its products and services that are used by other industries as raw materials to produce finished goods such as chemical goods, construction materials, wood and paper products. Then there are also some sectors such as healthcare which of course experience what we call “Blessing in Disguise” or profits that occur due to situations that actually harm many parties. The healthcare sector even showed a good increase while other industries did not.30 Then there are also industries that are quite promising, including Consumer Cyclicals and Financial which are strong enough to maintain their performance during this pandemic and tend to recover relatively quickly compared to others.
The correction that occurs is a global domino effect and it is undeniable that all LQ45 member stock sectors are companies that do business globally. Learning from this experience, of course, government policies are needed and have a direct impact on the market at large. In addition to policy measures to strengthen the health sector, the government must also pay attention to efforts to overcome the impact of the economic downturn by launching various stimuli. The policy targets are also very broad ranging from households, corporations, to MSMEs, even local governments, as well as targeting various economic sectors. Various institutions such as the International Monetary Fund (IMF), World Bank, ASEAN also called for the importance of international cooperation to overcome the impact of the pandemic.
Government policies in responding to the pandemic can help increase investor confidence in the stock market.31,32 This is a strategic step for the government because it is proven that the process of the market recovery phase in the Q2-Q4 2020 period which was covered positively in the media has an impact on increasing stock returns, especially for members of the research LQ45 index.
Based on the research that has been carried out, several conclusions can be drawn, including the clustering method by considering technical and fundamental indicators is effective in identifying the nature of price movements as well as the nature of the company’s business fundamentals. It was found that the LQ45 index during the period before and after the pandemic could be divided into 4 clusters, each of which had different characteristics. Investors can use these results to make better investment decisions, such as choosing a cluster whose price movement is in accordance with the return target and the investor’s risk profile. The clustering method is considered effective in diversifying the stock portfolios of LQ45 members which fluctuated during the recession period due to the COVID-19 pandemic. Based on the results of the portfolio performance testing that has been formed, the portfolio’s performance has proven to be much better than the LQ45 index market on a macro basis. In addition, each selected stock in each portfolio has a low correlation so that it can be interpreted that the portfolio is well diversified.
This study also proves that the systemic risk that has occurred due to the COVID-19 pandemic has become awareness for investors to be really strong in studying the situation and must be able to make investment decisions with the right strategy to avoid blackswan events such as those that occurred during the pandemic. Industries that still looked competitive during the pandemic period included industries from the basic materials, finance, healthcare, consumer cyclicals and consumer non-cyclicals sectors. Industries outside these sectors saw a significant correction compared to the previous year’s performance. Learning from this experience, of course, government policies are needed and will have a direct impact on the market at large. The government must pay attention to efforts to overcome the impact of the economic downturn by launching various stimuli. Policy targets must also cover households, corporations, to MSMEs, even local governments, as well as targeting various economic sectors broadly. International cooperation is also very much needed with various institutions such as the IMF, World Bank, and ASEAN to deal with similar incidents.
• Author First Name: Atha Fitrah, Last name: Riyadhi, Mail ID: [email protected],
Department: Department of Technology Management, School of Interdisciplinary Management And Technology, Institution: Sepuluh Nopember Institute of Technology, Town/City: Surabaya State: East Java, Zip/Postcode: 60264, Country/Region: Indonesia
Author Contribution: Conceptualization, Data Curation, Formal Analysis, Methodology, Writing – Original Draft Preparation, Software
• Co-Author First Name: R. Mohamad Last name: Atok, Mail ID: [email protected]
Department: Department of Actuarial Science, Faculty of Mathematics, Computation, and Data Science Institution: Sepuluh Nopember Institute of Technology, Town/City: Surabaya State: East Java, Zip/Postcode: 60264, Country/Region: Indonesia
Co-Author Contribution: Conceptualization, Investigation, Supervision, Validation, Writing – Review & Edition
| Views | Downloads | |
|---|---|---|
| F1000Research | - | - |
|
PubMed Central
Data from PMC are received and updated monthly.
|
- | - |
Provide sufficient details of any financial or non-financial competing interests to enable users to assess whether your comments might lead a reasonable person to question your impartiality. Consider the following examples, but note that this is not an exhaustive list:
Sign up for content alerts and receive a weekly or monthly email with all newly published articles
Already registered? Sign in
The email address should be the one you originally registered with F1000.
You registered with F1000 via Google, so we cannot reset your password.
To sign in, please click here.
If you still need help with your Google account password, please click here.
You registered with F1000 via Facebook, so we cannot reset your password.
To sign in, please click here.
If you still need help with your Facebook account password, please click here.
If your email address is registered with us, we will email you instructions to reset your password.
If you think you should have received this email but it has not arrived, please check your spam filters and/or contact for further assistance.
Comments on this article Comments (0)