Keywords
Agri-business, energy and demand offset, food security, exurb economics
This article is included in the Agriculture, Food and Nutrition gateway.
This article is included in the Energy gateway.
This article is included in the Enhancing water, energy, and food security in an era of increasing demand, degradation, depletion and climate change collection.
Agri-business, energy and demand offset, food security, exurb economics
Energy demand is generally considered to be relatively price inelastic. Which is to say that irrespective of price per unit of energy, the demand remains relatively unchanged; except during artificial periods of abnormal demand. On the supply side, intentional surplus production is generally counterproductive to profitability and intentional scarcity leads to loss of market share or markets all together. The delicate global supply-demand equilibrium is achieved via special economic and trade measures. Simply put, global energy trading is not a simple marketplace where open market economics can prevail. However, within a single political entity or partnership governed by common rules, open market principles and markets exist. Understanding this basic fact of our globalized economy is crucial to discussing energy usage and demand offset.
According to Webber (2019), in the US 10% of all energy consumed is for the entire food supply chain i.e., 1% in calorific content and 9% expended as energy for processing, storing, refrigeration, transportation, and cooking etc. Therefore, in 2021, the total energy consumption for food in the US was roughly 9.7 quadrillion British thermal units (Btu). Of which upwards of 40% or 3.9 quadrillion Btu is lost due to food waste according to Gunders (2012). To quantify that loss, it is equal to USD $21.6 Billion per year (3.9 quadrillion Btu * USD $5.54/1 Million Btu) in natural gas equivalent as of July 6, 2022. Geographically, food waste occurs closer to areas where consumption is also high. Consequently, dense urban and suburban areas have the highest food demand.
A 2020 study from Tufts University (Kurtz et al., 2020) found that local food production is feasible and a potential solution for food availability optimization. However, the study also found that not all urban regions are suitable for local food production. While the study’s conclusions are based on sound data, it is also based on traditional farming techniques and land use practices. This paper, however, explores the idea of mixed use of exurban lands i.e., both for agriculture and non-agricultural use. Also, the focus is on small scale farms that can be well integrated into exurban or even suburban landscapes, thus bringing the farm closer to the urban centers and reducing the farm-to-fork energy consumption and food waste. In addition to energy reduction due to proximity (lower transportation needs), the idea of further reducing energy demand by powering farm operations through wind and solar augmentation, is explored, analyzed, and justified.
The remained of this paper is organized in the following sections. The basic structure, dimensions, and features of the smallest unit field for the proposed exurban farm is described in Section 2. Section 3 discusses the capital needs, operational aspects, energy storage and offsetting capabilities of a unit farm; followed by comments and concluding remarks in Section 4.
The proposed exurban farm is described and illustrated in this section. The basic unit of exurban agricultural parcel is defined as a unit field (UF) and described in Section.
Each UF is served by two towers and three tanks for irrigation and other operations. The tower design and tank layout are presented in Sections 2.2 and 2.3, respectively. Sections 2.4, 2.5, 2.6, and 2.7, presents wind and solar energy augmentation, demand offsetting, space utilization improvements, and local food benefit aspects, respectively.
Figure 1A shows the parameterized (variable x) dimensions for a UF. Where T1 and T2 are the two towers located along the center line of the UF. Let us consider the following two cases for the UF i.e., x is 50 and 100 meters.
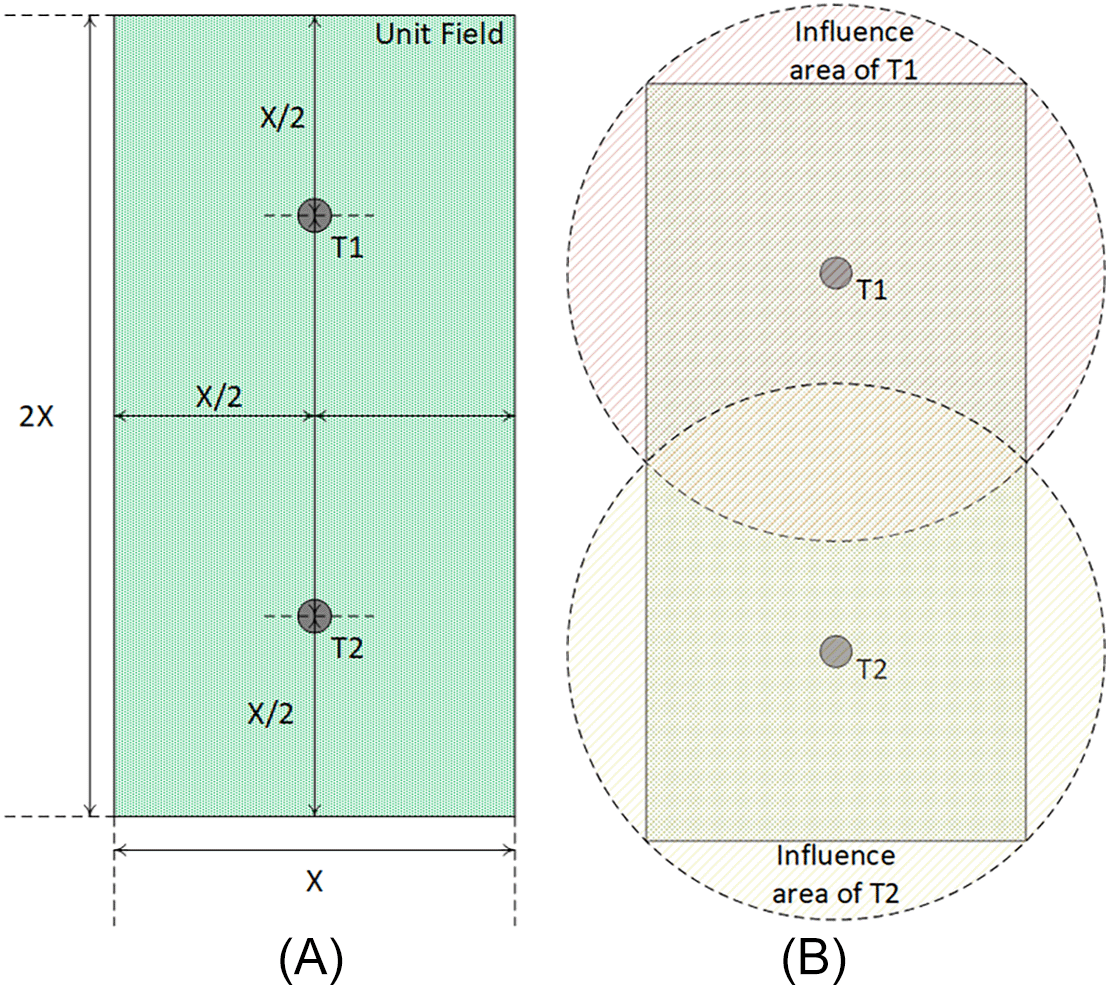
(A) A unit field (UF) with parameterized dimensions.
(B) A unit field (UF) with regions of influence shown.
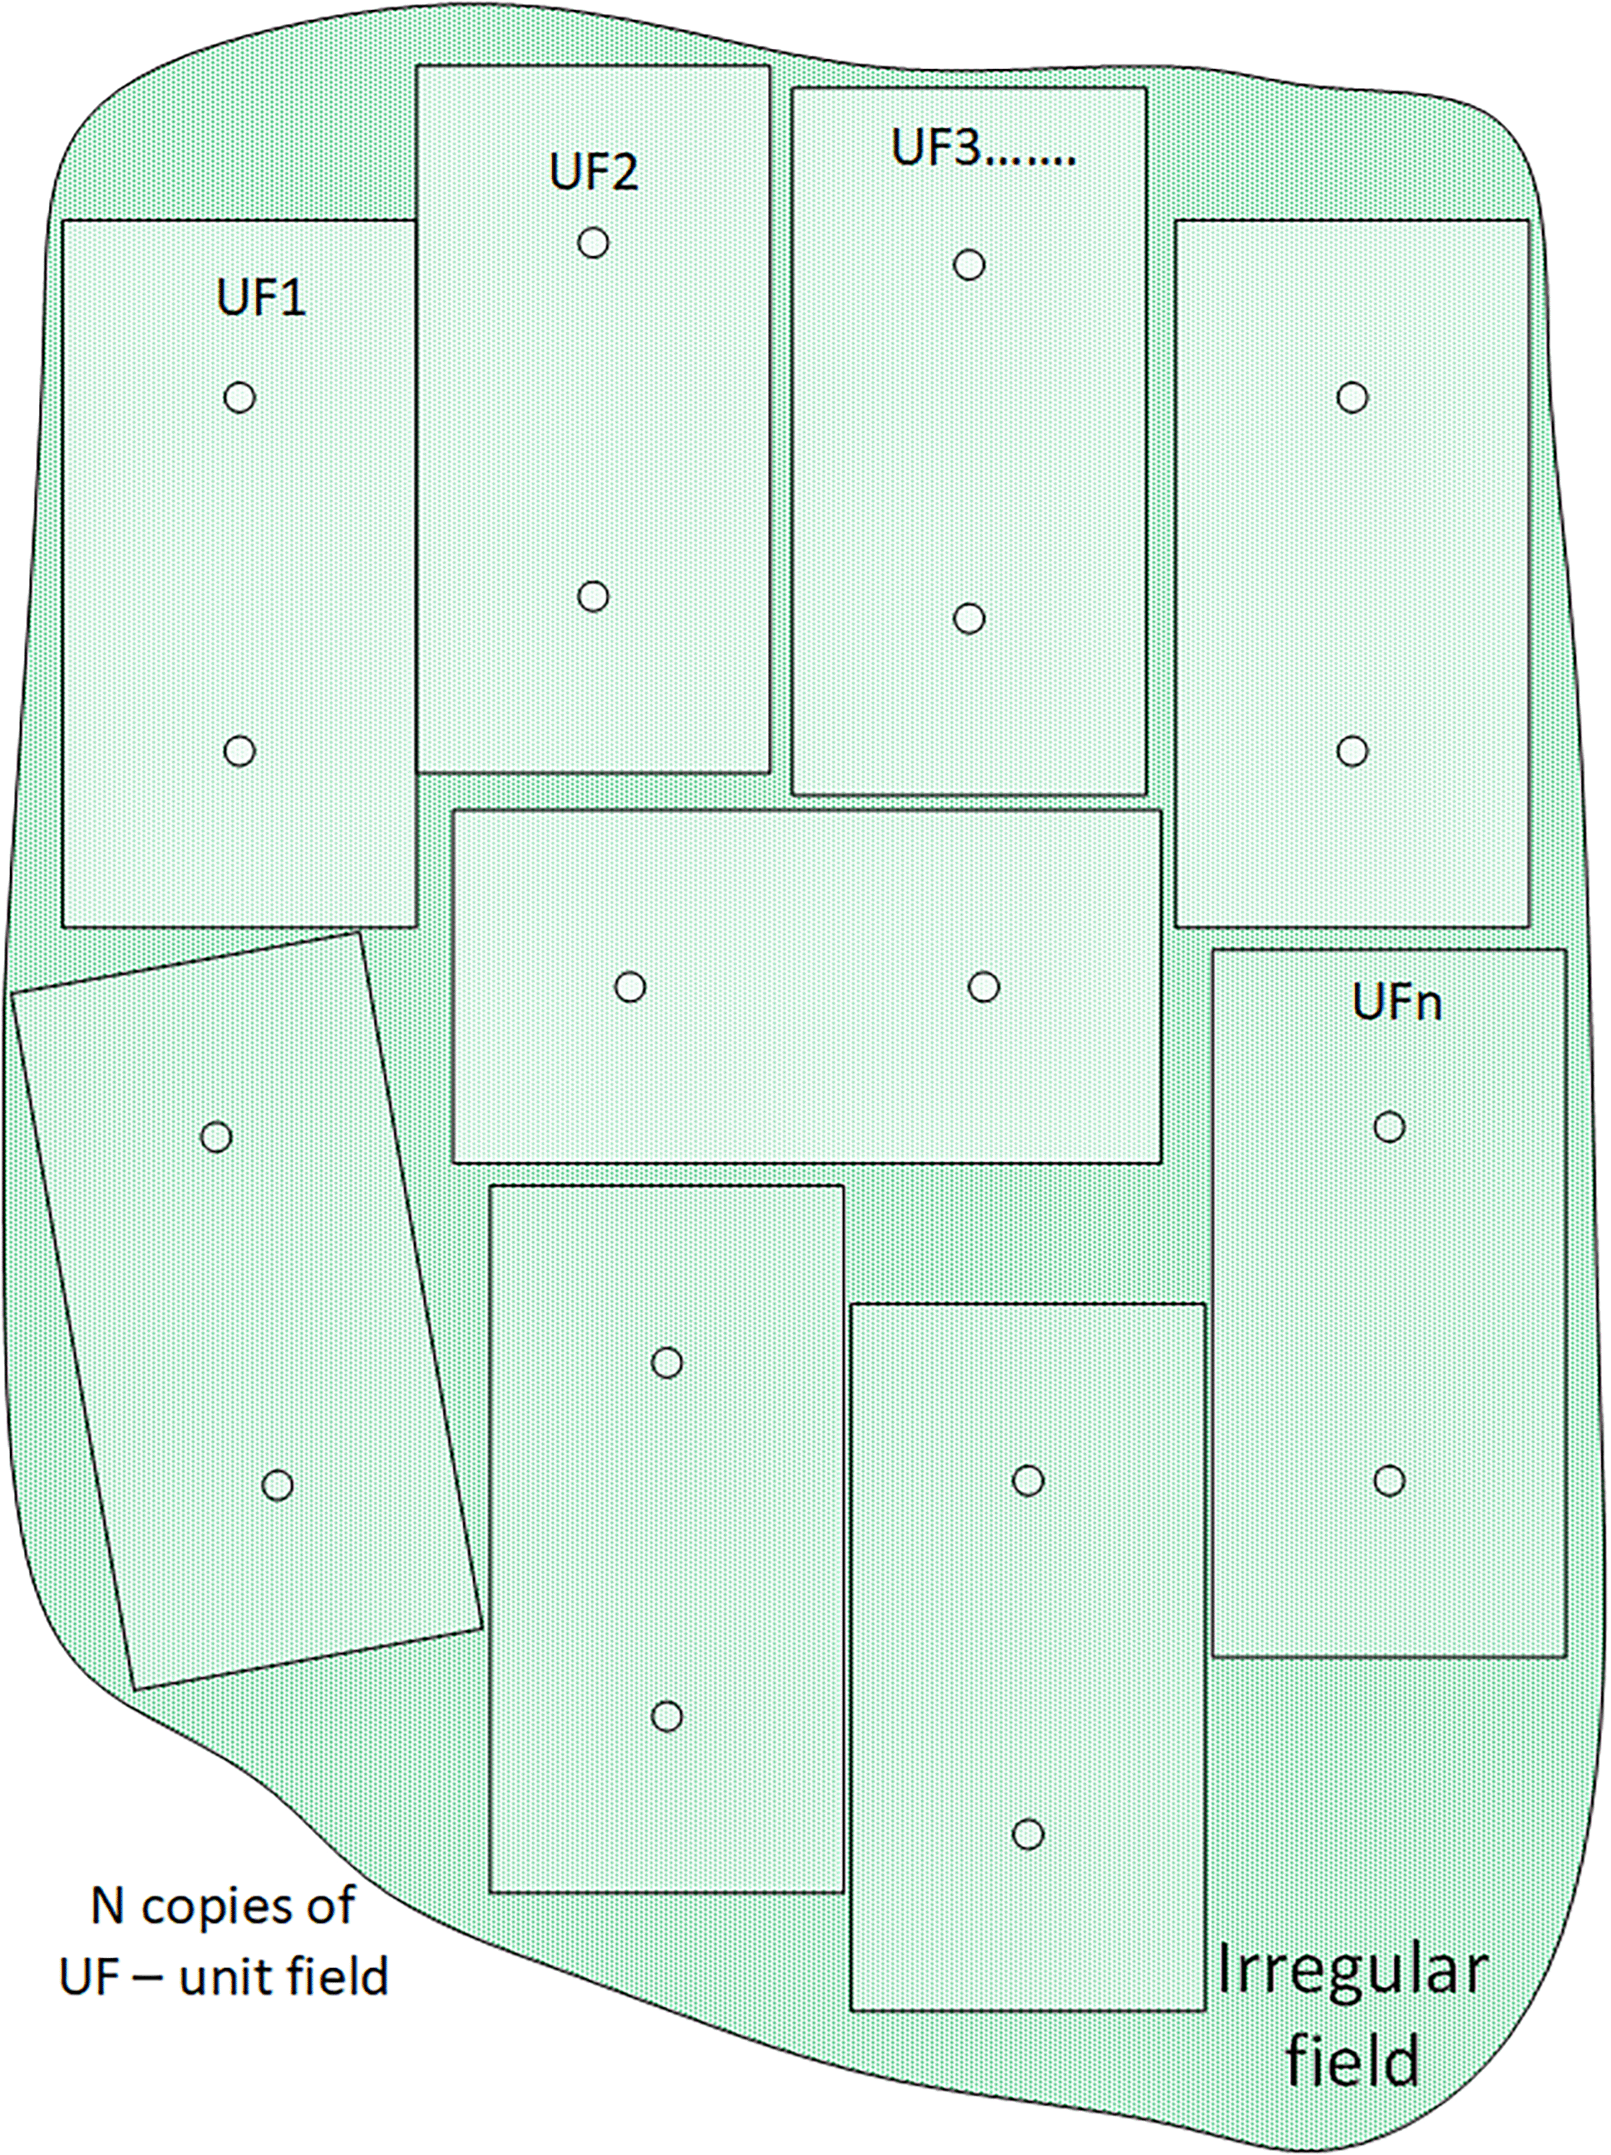
The smallest average farm size in any US state according to the United States Department of Agriculture Farm Labor Survey (USDA FLS, 2022) is 55 acres. Hence, the case described by Equation 1B (i.e., when x = 100) for a UF area of ≈5 acres, offers a reasonable multiple (10-11) to represent the smallest average US farm size. Therefore, this case will be considered as the standard UF dimensions for analysis throughout the rest of this work. Area of influence is defined as the region of a UF an individual tower is expected to serve, this is illustrated in Figure 1B. If the land available is larger than a single UF, then multiple UFs can be fit into the available land as shown in Figure 2 for analysis purposes.
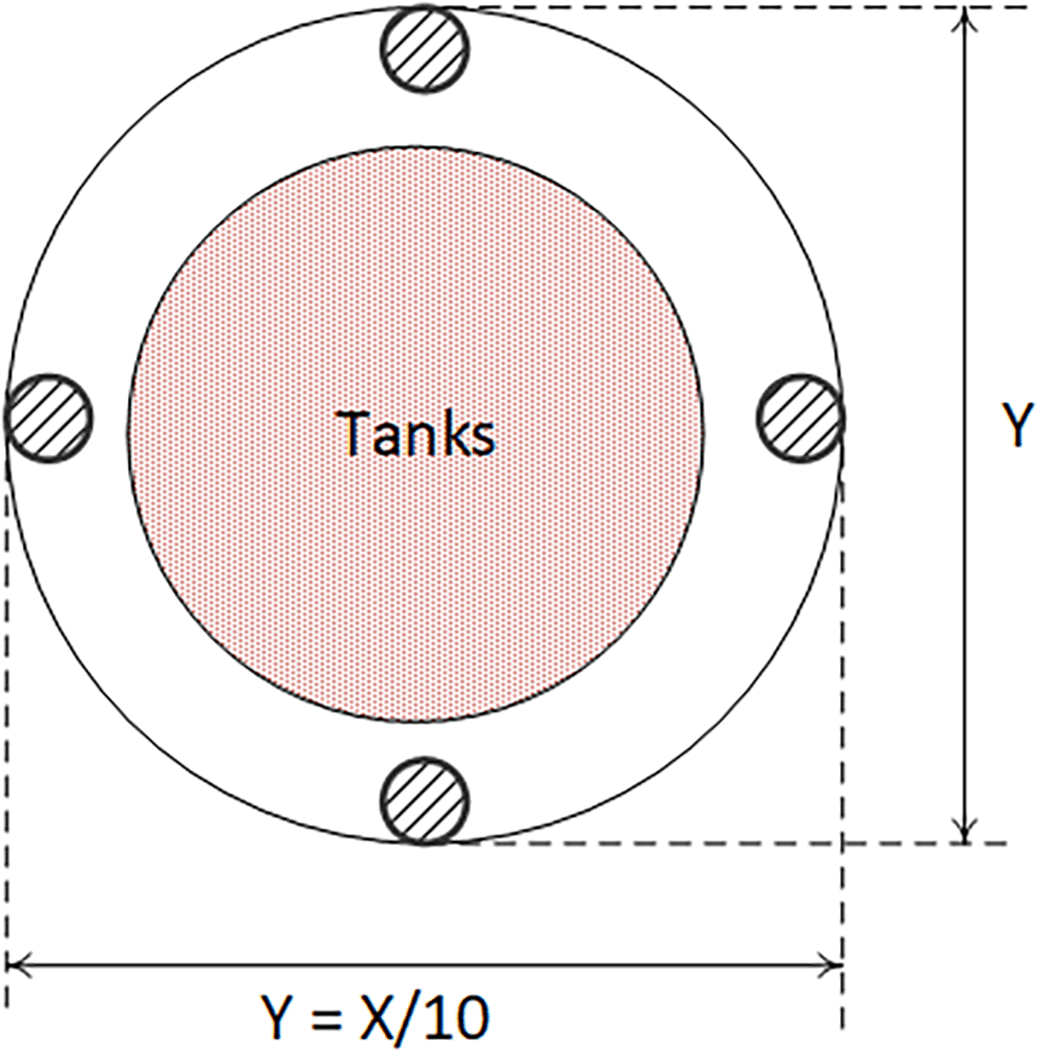
There are two identical towers per UF. These towers are placed on circular concrete pads with a radius of (x/20). Each tower will have an above ground steel structure that will be angled to support a water storage tank. The tower base will consist of an underground concrete structure with built in water tank and contains usable space for additional utilities, if desired. The conceptual top view and side view of such a tower is shown (not to scale) in Figures 3 and 4, respectively.
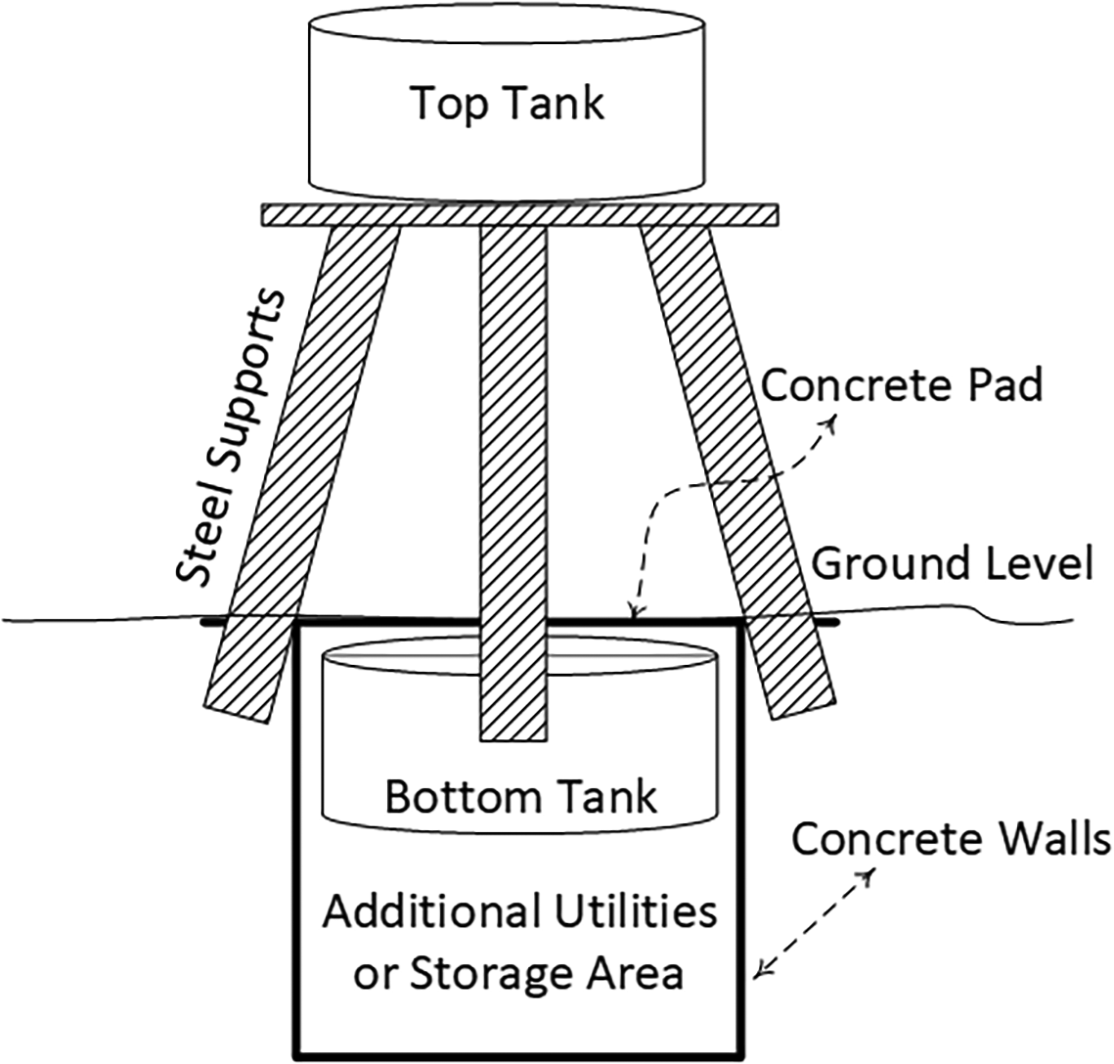
The two tanks will play a significant role in irrigating the influence area, provide drinkable water to any life stock and for use as a pumped storage energy harvesting/demand offset system (more in Section 3). The steel structure also can serve as mounting frame for:
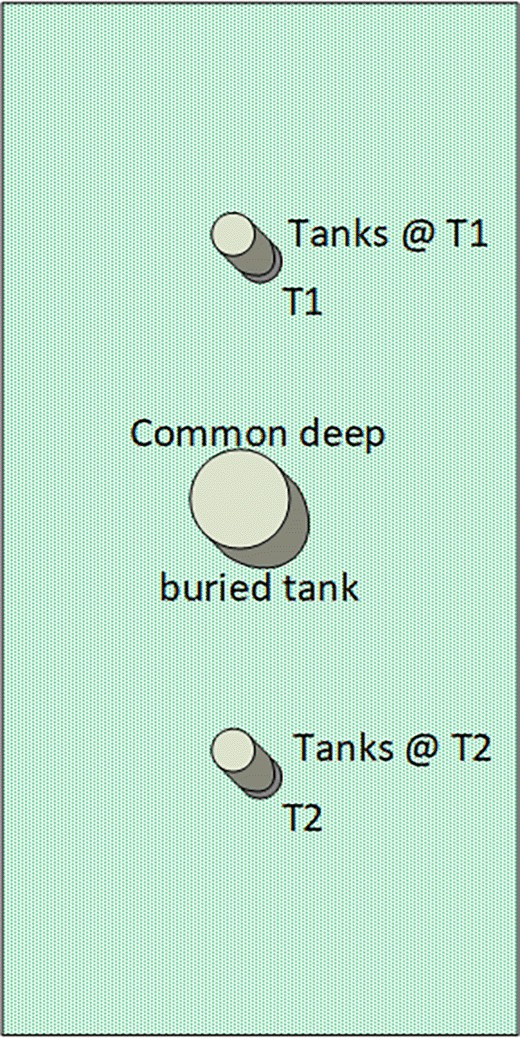
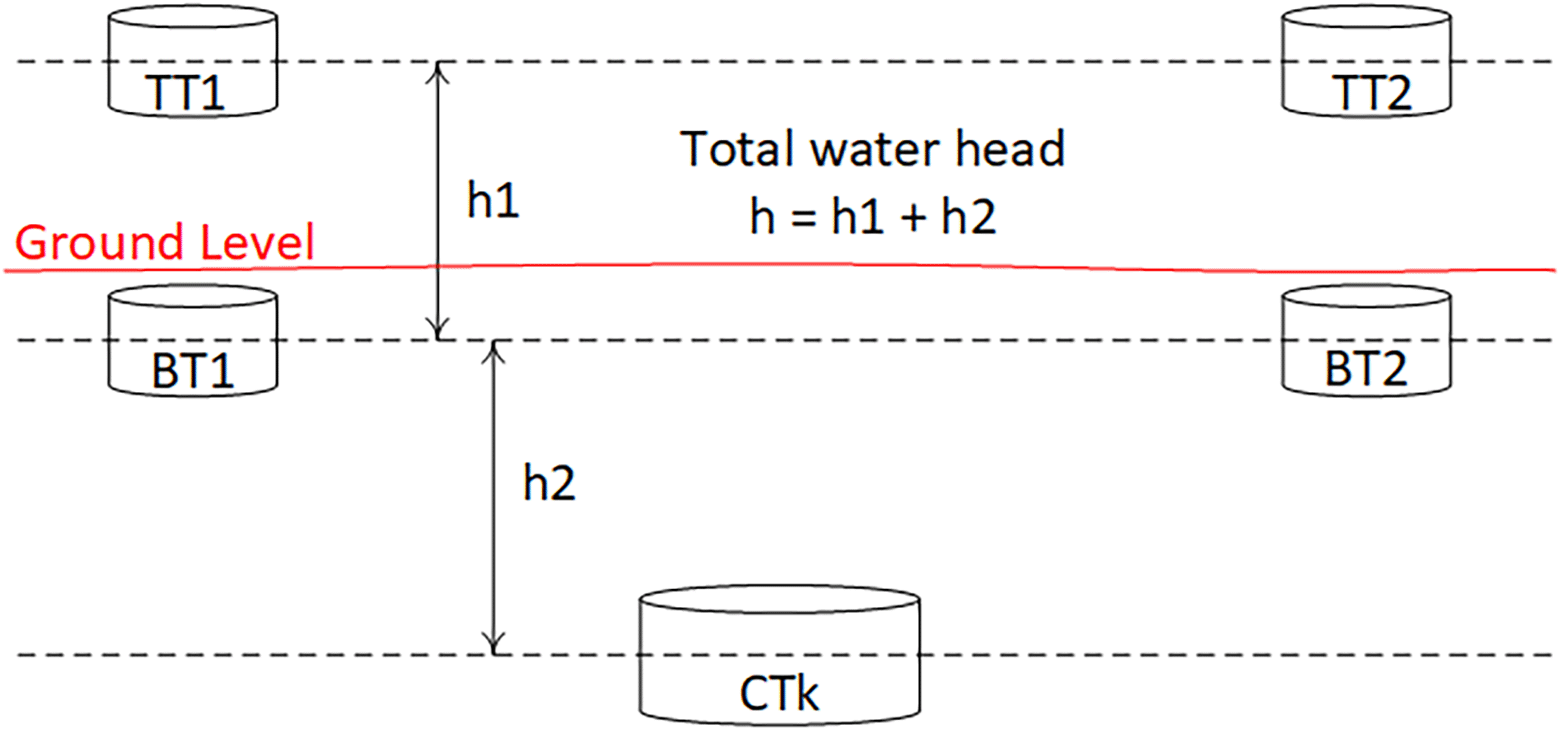
In every UF there are two towers; T1 and T2. At tower T1 there are two tanks, TT1 as the top tank at T1 and BT1 as the bottom tank at T1. Similarly, at tower T2, TT2 is the top tank at T2 and BT2 is the bottom tank at T2. In addition to these, there is a deep buried common tank (CTk) which will be located centrally to both the towers (T1 and T2). Figures 5 and 6 show the top and side views of the tank locations, respectively. Figure 6 also shows the water head definitions used in potential energy offset capability calculations done in Section 3.
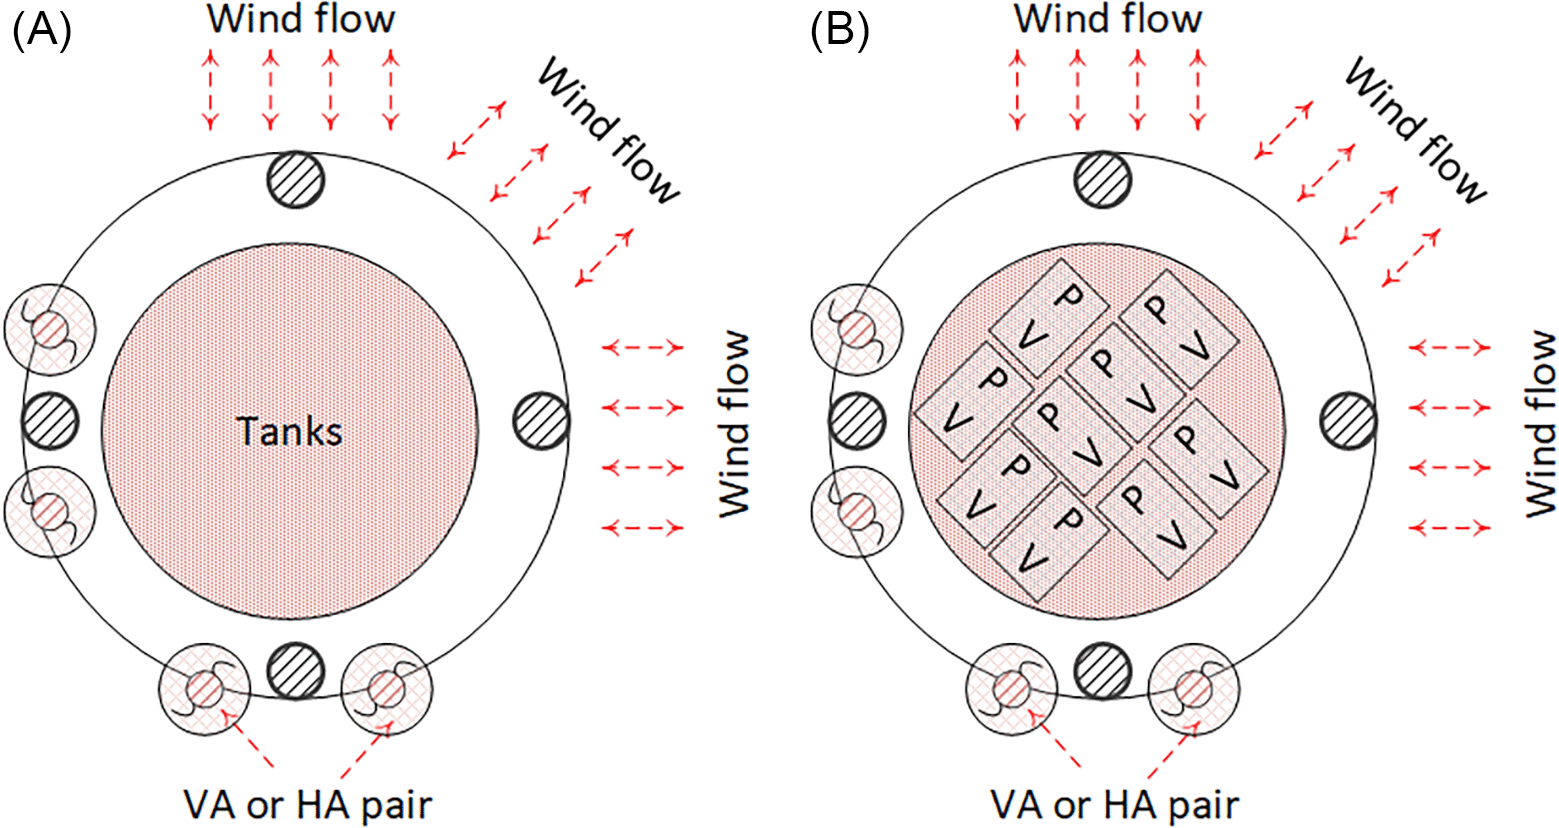
The towers can be equipped with wind and solar power generation systems to en- able grid energy offsetting. Here the focus is on using multiple relatively inexpensive vertical or horizontal axis wind turbines (VAWT or HAWT) along with similarly in- expensive flexible mount solar photovoltaic panels (PV). Using multiple inexpensive units can improve serviceability and improve long term reliability, however other components such as power conditioners can become more complex and thus expensive. Consequently, achieving a balanced mix of sub-units will be critical. Also, a critical concern for using wind generation, particularly in suburban or exurban locations is its impact fatality of wild and specifically avian life. A simple solution is to use a mesh surround or shroud to shield the spinning parts from direct bird or wildlife hits, as illustrated in Figures 7 and 8.
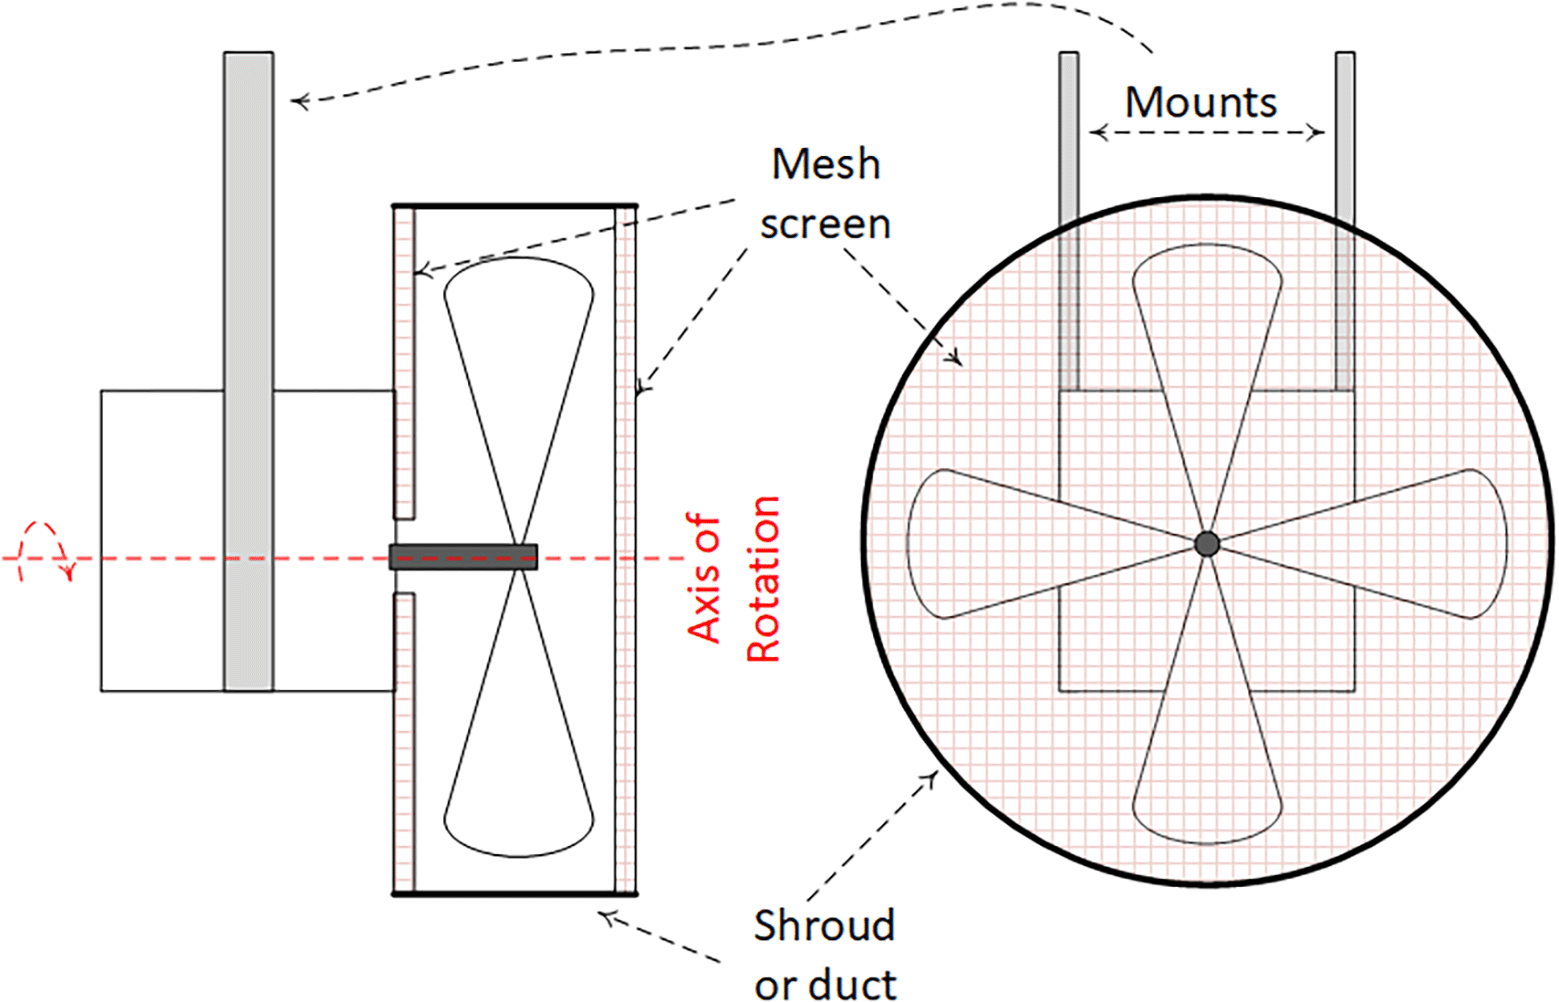
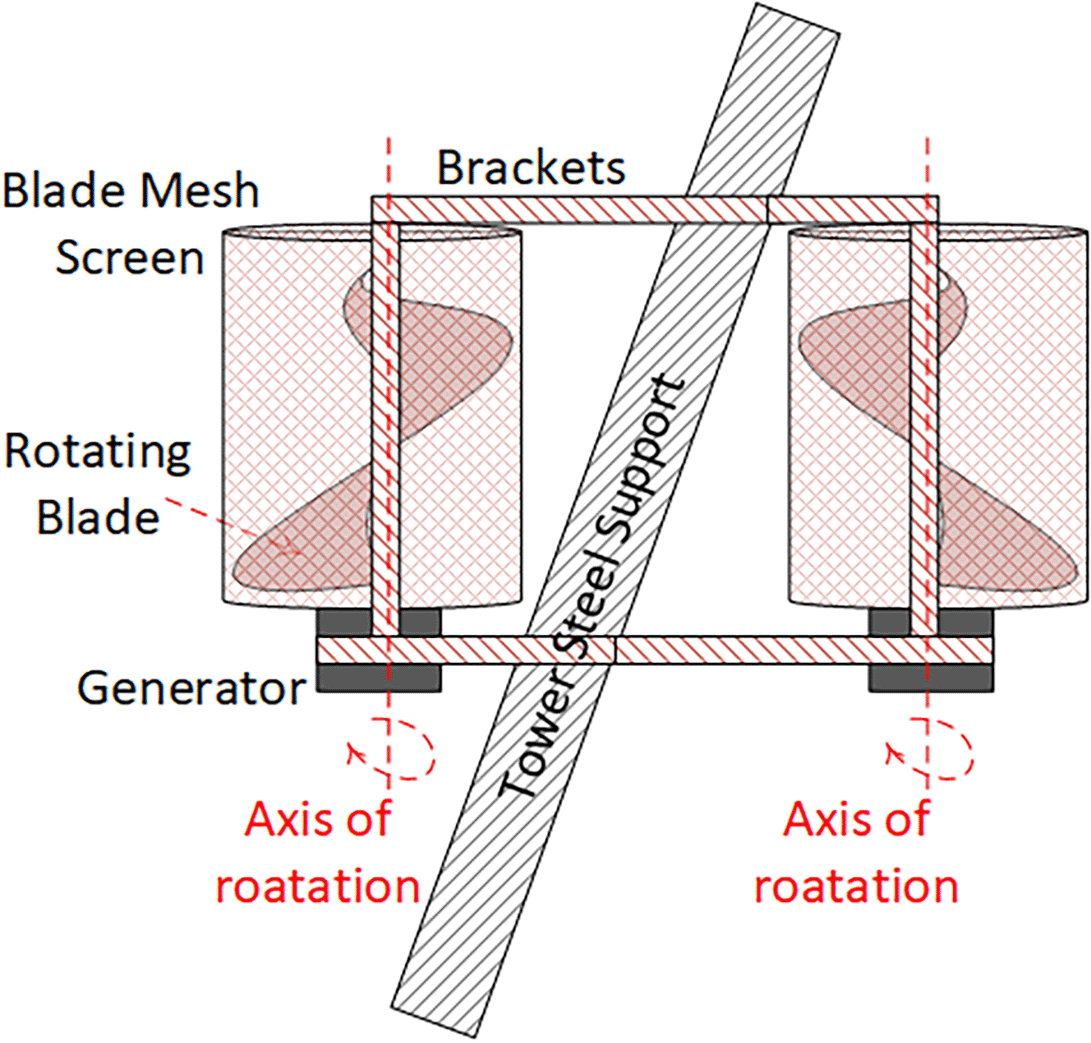
Peak efficiency and maximizing energy generation are not the key motivators in this application, rather, a lowering capital and maintenance costs, increasing replace-ability and serviceability, and reducing downtime cost of the subsystems are paramount. Therefore, any losses that may result as a consequence of including wild-life protection features should be considered reasonable and acceptable. Figure 9A shows the top view of an UF tower where two sets of wind generators are used to capture winds in both perpendicular (north-south and east-west) directions. Winds at any angles can be captured by a VAWT, however when a HAWT is desired (due to simplicity) it should be mounted on a swivel to capture winds in any directions. When photovoltaic panels are included, they can be easily mounted on the top surface of the top tank, as shown in Figure 9B.
(a) Top view of a tower showing wind generators and wind capture directions.
(b) Top view of a tower showing wind generators, wind capture directions and photovoltaic panels.
Energy demand offsetting can be achieved with in an UF when the energy requirements for operations within the UF is met partially or fully with energy that has been generated or (previously generated) and stored within the UF for later use. The primary and key feature the UF based farming proposes is the use of simple water storage tanks to store the excess energy production. The proposed scheme is therefore a modified pumped (potential energy) energy storage scheme where the energy generated is minimally conditioned and used directly to power pumps to pump water from the deep common CTk to each of the bottom tanks (BT1 and BT2). Then once they are full, it will continue to pump from the bottom tanks to the top tanks (TT1 and TT2) respectively. When the top tanks are full, gravity assist is used to irrigate, supply drinking water, or for other utility purposes. A small battery backup can be included for remote operation communication system, but batteries are not used for bulk energy storage.
The proposed scheme has the following distinct advantages;
• Irrigation is a normal and necessary farm operation powered entirely by local energy generation.
• Drinking use, particularly filtering, purification, and or heating/cooling is also a normal and necessary farm operation powered by local energy generation.
• Even without wind or solar generators, when connected to the electric grid, UF tanks can serve as one way distributed grid storage to buffer any generation surplus (constant load for solar and wind producers) and help regulate the grid metrics. There is no need to idle generations facilities or use dump loads to dissipate generation surplus, which has both short and long term maintenance and economic benefits.
• Unlike battery storage, there is no cyclic storage capacity loss. That is, the tanks can be filled and emptied infinitely without any loss of capacity, multiple times a day.
• Unlike battery storage, operating temperature range, cold and heat tolerance is much higher.
• Unlike battery storage, there are no toxic or hazardous chemicals involved.
• Unlike battery storage, replacement cost and end of life cost are minimal.
• Unlike battery storage, life cycle cost, environmental impact and carbon footprint for the entire system during construction, operation and decommissioning are smaller.
The proposed UF based approach to farming is mainly focused on exurban cultivation, although it can be applied to suburban and even urban agriculture (UA) under the right conditions such as land availability and zoning laws permitting. At the present, UA has gained support among non-governmental organizations (NGOs), community developers, urban planners, and politicians, as several examples both in formal academic and informal online literature can be found. Some examples are (Precker, 2021; Siegner et al., 2018; UGC, 2017; McCauley, 2021; Sustainability, 2019). However exurban agriculture (EA) concept as its own entity is not well developed and it is lumped together with UA.
Notwithstanding the minutia, an UF based approach to EA will improve land utilization by;
• Encouraging mixed use of lands for both traditional farming and energy offsetting and load stabilization applications.
• Reclaiming contaminated land or land not suitable for agriculture, for food cultivation using more (than traditional) energy and labor intensive green house/hydroponics based techniques where the farm is mostly or fully energy self-sufficient.
• Repurposing off-grid wet and coastal lands to become energy self-reliant aqua- phonics farms for oysters, seafood and fish.
A food desert (FD) is defined as a neighborhood that lacks supermarkets, grocery stores, or other local food outlets offering healthy and affordable options (Dutko, Ploeg, and Farrigan, 2012). Criteria for designating food deserts include low-income and low-access census tracts, where food establishments are more than one urban or 10 rural miles away. Figure 10 shows the areas in the US designated as food deserts using this criteria (USDA FARA, 2010). When inspecting Figure 10, it is clear that FD (Rhone, Williams and Dicken 2022) are spread through the US. Large area FD in the southwest and western regions also coincide with low population density regions but are sufficiently close to densely populated urban regions. This means there is an abundance of cultivatable exurban land available and is underutilized for food production. According to Kaili (2021) economic opportunity zones (OZs) are located throughout the US, however there is only a 30% overlap between OZs and FDs regions. This means there are federally administered programs that can assist in setting up new businesses in these overlapped regions. For example, a newly setup downtown food co-op or a community restaurant can source all of their produce from a just-outside-the-OZ exurban farms. Such partnership will help address both food insecurity through local farming and economic insecurity through local jobs creation. Sustained access to nutritious food would likely result in better health outcomes (Gundersen and Ziliak, 2015), high school completion rates and regional economic outlook (USHHS, 2030).
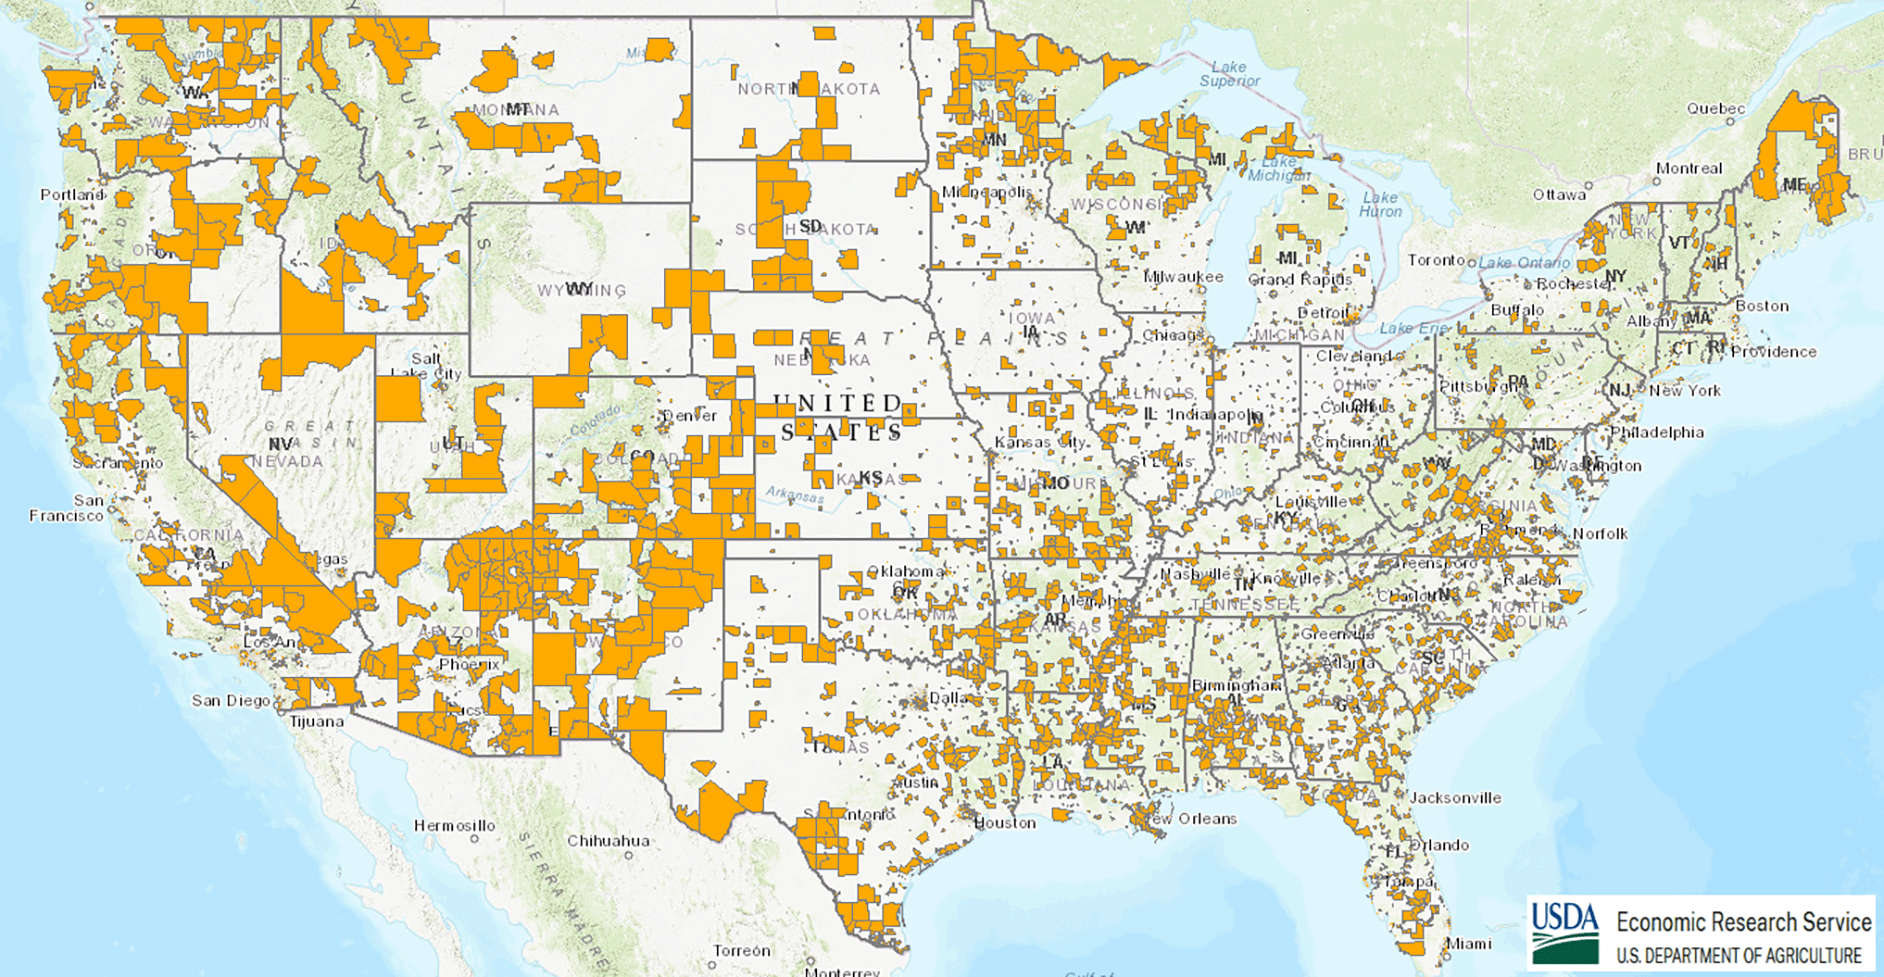
This figure has been reproduced with permission from (USDA FARA, 2010).
Estimating the capital needed to set up a new farm with or without using the proposed UF approach, is generally considered difficult. Mainly due to opportunity cost for the capital used towards farm setup and the expected return from the farm both cannot be predicted accurately and the price for land varies based on location. However, we can attempt to quantify the present worth of the cost of energy saved using the proposed UF design approach over a period of time. This amount would serve as a baseline for setting the boundaries for investment in long term infrastructure i.e., setting up an UF.
As land is not considered a depreciating asset, we will not consider the cost of land in capital investment calculations. All the rest of the UF equipment such as towers, tanks, wind, solar generators and power electronic systems, irrigation systems, pumps, and motors are considered to be 10 year depreciating asset (as classified by the US tax agency, the internal revenue service - IRS) and so the calculations will be done over a 10-year period. Interest rate and inflation rate will be fixed for the entire duration and the calculations done on a monthly basis. Fixed interest and inflation rates are used to simplify the calculations, and it is a standard technique in economic analysis. Monthly time interval is chosen as most consumer and or small business (small farms) level economic activity is represented in monthly time frames (rents, loan payments etc.). The calculations are shown below in steps #1 through #6.
Water head from Figure 6.
Step #2: Estimating irrigation water usage and tank sizing
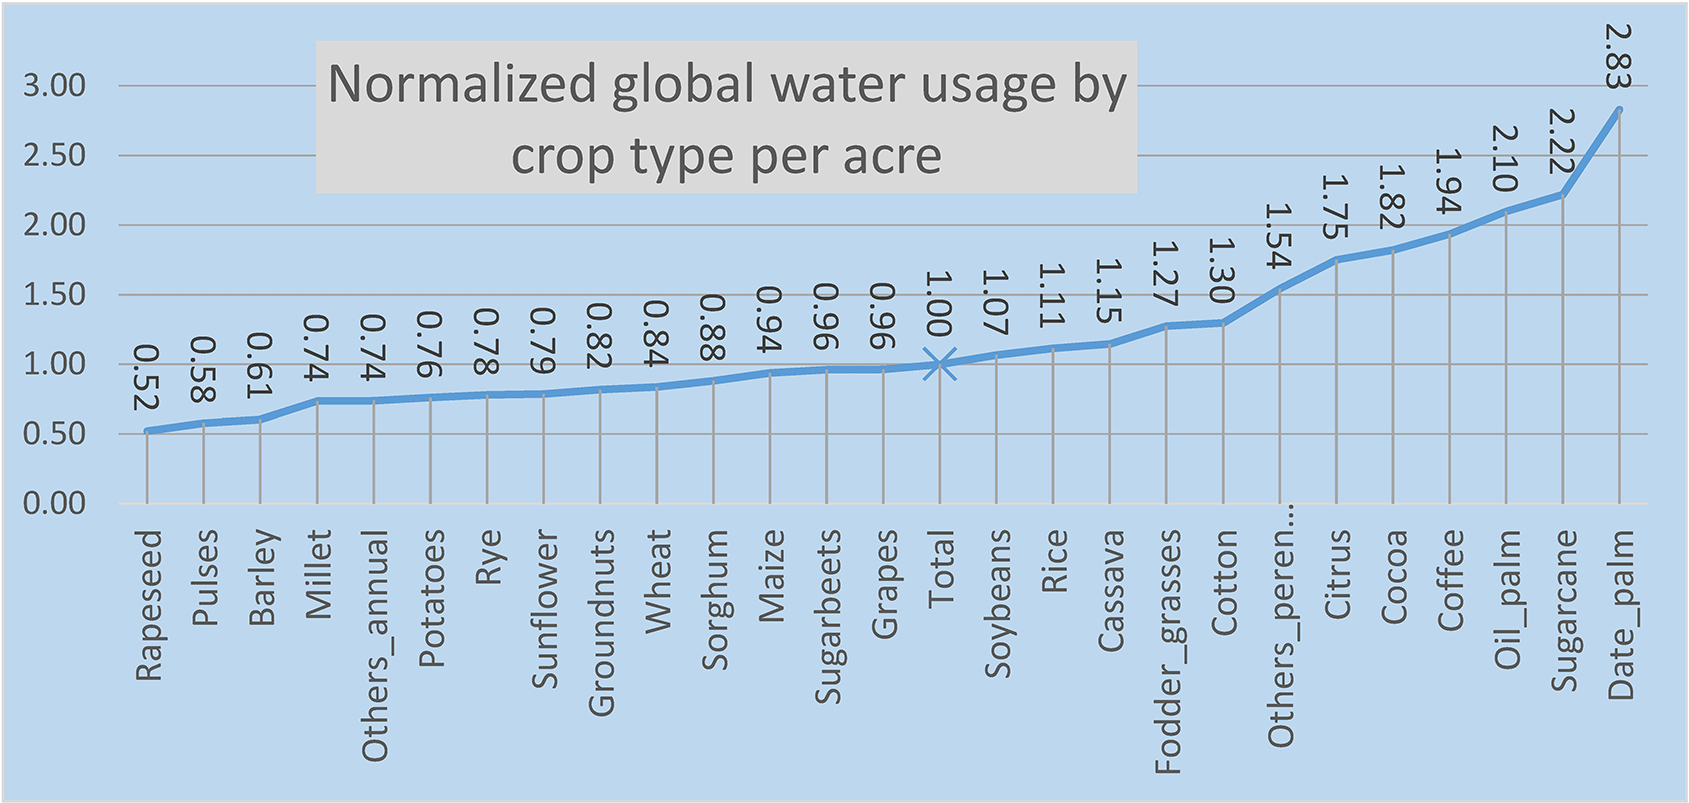
According to the UDSA’s 2017 Census of agriculture, total irrigated acreage and water use per acre are 55.9 million acres and 1.5 acre-foot, respectively (USDA AgCensus, 2019). Acre-foot is the amount of water required to cover one acre to a depth of one foot. This is equivalent to 43,560 cubic feet or 325,851 gallons of water for one acre of land. In Figure 11, using data from Chiarelli et al., (2020), the relative water usage per acre of cultivated land is shown. It can be inferred that crops intended for food relatively consumed close to the average. Thus, average water usage is assumed for calculations.
Total available area in a UF is;
Total cultivatable area in a UF is, Auf tot - (area lost to tower concrete pads) here X = 10 m.
Total water consumption for an UF will be,
If the irrigation is done over a period of 300 days/year, the water consumption per day for an UF is;
The tower tanks (TT1, TT2, BT1, and BT2) should at minimum have a radius of 2.5 meters and height of one meter, for a cylindrical tank shape. A wider tank shape will be beneficial for stability purposes and also for providing surface are for the photovoltaic panels. Therefore, the tank volume with these dimensions is;
When the top two (TT1 and TT2) tanks are full the entire UF can be irrigated and then the excess can be used for life stock drinking, cleaning, or for other utilities. The tank dimensions are well within the radius of the concrete pad size for the towers. The total overhead storage capacity is;
The buried common tank (CTk) should at minimum have a radius of 3.6 meter and a height of one meter.
Step #3: Estimating potential energy storage capacity
The total water head available was shown in Figure 6 and the values assumed for h1 and h2 in Equation 2d. Energy needed to raise 39.26 m3 of water from the common tank CTk to the two bottom tanks BT1 and BT2 are;
Total energy storage capacity assuming an 80% pump efficient (η = 0.8) is;
Step #4: Estimating size and cost of wind and solar generators
The total energy needed to irrigate a fully gravity fed UF a day is 2.4 kWh (Equation 12). If drip irrigation or pressurized irrigation are used, then the energy needed will be higher. Let us assume an irrigation overhead γ of 25%, and power electronics (for wind and solar energy conditioners and converters) efficiency ηpe of 90%, these are reasonable values sources from several manufacturer’s product documentation.
Let us assume that pressurized irrigation is used and the duration of irrigation is one hour i.e., the tanks are already full and only the irrigation pumps are operating. This means that the solar and wind generators have to generate at a minimum 535 W of power, combined. Also, the time taken to fill the tanks can be several hours (but must be done within 23 hours). Therefore, with a generating capacity of 535 W, the tanks can be filled in 2.4 kWh/0.54 kW = 4.5 hours. The tank can be filled and ready to irrigate every single day if needed, completely free of any demand on the grid. Therefore, the total energy to irrigate an UF with pressurized irrigation is;
Step #5: Estimating grid energy demand offset
If an UF is irrigated for 300 days a year, then the total energy demand on the grid would be;
At USD $0.15/kWh this means a total annual energy cost for an UF of;
According to UDSA’s 2017 Census of agriculture, (USDA AgCensus, 2019), energy cost per farm on average was USD $15,289 for a total of 231,474 farms irrigating a total of 55.9 million acres.
This higher USDA figure is due to energy + transmission costs typically assessed by electric utilities and it included pumping from wells and pressurized irrigation systems. It is consistent with the estimates presented in this paper.
Step #6: Estimating capital for setting up an UF
Using the estimate from USDA (Equation 18) and assuming the usage if uniform over the year, the monthly cost of energy for a UF is;
Assuming the cost of electricity keeps with inflation and less than the interest rate, the present value of the cost of grid power can be calculated as;
For an UF or an UF sized farm, irrespective of the cost and source of energy used to operate it;
• the cost of land is fixed
• the cost of water for irrigation and farm use is fixed
• the cost (some not all) of water storage tank(s) is fixed
• the cost of irrigation sub-systems are all fixed
Thus, the equivalent present worth of the cost of purchasing grid power for a 10-year period, is sufficient (and greater than) the immediate cost of setting up wind and or solar generation systems. Even at twice the required generation capacity i.e., 1 kW (≈ 2× Equation 13), the cost of generating equipment needed is well under USD $2,500, at the time of writing this paper.
However, the cost of materials and installation of the tanks, support structures, pumps, and concrete, should also be considered. Here the analysis is more nuanced. These structures have multiple purposes, they can be used for irrigation, for shading, as open barns, watering areas, and nursery etc. Therefore, the added cost of installing these structures should be considered as marginal or additional expenses to standard farm setup costs, which is difficult to estimate without detailed knowledge of the type and location of the standard structures.
To continue with the capital analysis, an unconventional approach would be to consider the cost of energy lost due to food wastage. Energy loss was estimated in Section 1 to be equal to USD $21.6 Billion per year in natural gas energy cost equivalent. Now, assume a portion of this loss is reduced due to local farming using UFs, let this loss reduction be 20%. That would imply an additional capital (monies not spent) availability of roughly USD $4.32 Billion in natural gas energy cost equivalent per year. The present value of total capital availability using the interest rate from Equation 2b, over a 10-year period is equivalent to USD $ 31.8 Billion. If this capital is made available as annualized capital infusion, loans or grants via some form of governmental program. For example, an initiative to promote 1,000,000 new exurban UF farms to solve food insecurity and reduce wastage, where each farm gets a voucher for USD $31,800 to be used and redeemed as capital investments are made within the 10-year period. Such an infusion of capital can completely reshape the national food landscape, realizing its many hidden health and economic benefits.
The calculation presented in Section 3 mainly focuses on irrigation to estimate tank sizing and making the economic case for solar wind augmentation at the smallest minimum dimensions, generation and storage capacities. However as mentioned earlier, infrastructure such as towers, concrete pads, irrigation lines etc. are fixed cost capital assets, irrespective of installed generation capabilities. Therefore, an UF or a collective of neighboring UFs can realize additional revenue by;
• Installing additional and operating photovoltaic panels and or wind generators to produce excess energy that can be directly exported to the grid operator for additional revenue
• Installing additional photovoltaic panels and or wind generators to produce excess energy that can be used to service loads with in the UF(s) such as living accommodations, grid backed refrigeration units, sterilization and food processing equipment etc; reducing overall grid demand, lowering operating costs and improving revenue of agri-businesses
• Leasing the tank surface areas for third party virtual net-metering energy companies
• Leasing the tank top for 5G network installations
• Operating a private EV charging stations powered (partially or fully) by on premises wind and solar generation
All of the above mentioned activities inherently involve additional labor requirements for maintenance, operation and repair services. Thus, directly improving the farm economics and indirectly improving derived demand and local economic activity.
In 2021, 28% of the total energy used was for transportation of people and goods according to the U.S. Energy Information Administration (USEIA, 2022). Of the total transportation energy mix, biofuels accounted for a mere 5%. Which further breaks down as ethanol’s share around 4%; biodiesel, renewable diesel, and other biofuels making up the remaining 1%. Therefore, transport fuels are a major part of the total energy use mix and any reduction in the demand for fossil fuel derived transportation fuels will have a positive environmental and economic benefit.
The US Department of Energy (DOE), lists hydrogen H2 as an excellent choice for use as transportation fuel (USDOE H2, 2022). H2 has roughly 2.8 times the energy dense per kg weight of regular gasoline. However, due to its low volumetric efficiency (energy contained per unit volume), a centralized production model utilizing large storage containers (at very high pressure) and long distance transportation and distribution to end users (which is energy intensive); at the moment seriously limits the use of H2 as a mass transportation fuel.
At the same time, H2 is an excellent candidate fuel when its transportation and distribution is removed from the supply chain. This means H2 must be produced close to where it is needed and consumed. That is, H2 must be produced where it is needed almost on demand. Consequently, the US DOE recognizes the following as feasible pathways for local green H2 production (USDOE,2022).
• H2 from Electrolysis: by splitting water into hydrogen and oxygen. Where the electricity is produced by excess solar or wind generation.
• H2 from Renewable Liquid Reforming: by reacting a renewable liquid fuel, such as ethanol, with high-temperature steam to produce hydrogen gas.
• H2 from Biomass Fermentation: by converting biomass into sugar rich feedstock for fermentation to produce H2 gas.
• H2 from Biomass Gasification: by combining biomass with high-temperature steam and oxygen in a pressurized gasifier to generate H2 gas.
Of these techniques, electrolysis is the most commonly used for low-volume H2 production. Making this pathway the most suitable for small scale production such as in the case of an UF. Also, this technique is relatively simple with least raw materials and equipment needed. However, it is more energy intensive and utilizes only one aspect of solar radiation i.e., photon intensity for H2 production. A commercial example of such an electrolysis based H2 production turn-key system is found here, (MRE LLC, 2022). Academically, a 2020 study quantified the benefits of using both solar and solar-heat for H2 production and found that the addition of heat improves the overall production volume and system efficiency (Gul and Akyuz, 2020).
Renewable liquid reforming can also utilize energy from wind, solar photon intensity, and solar thermal energy to generate the electricity and heat needed in areas where alcohol production is readily available. While ethanol can be used directly as a transportation fuel, it had a limited shelf life due to its hydrophilic nature. Additional processing is required to extend its shelf life. Conversion of feedstock alcohol to H2 not only extends the shelf life and also improves energy density (per kg or per gallon) for use as a transportation fuel. The specific energy (energy per unit mass) of ethanol is approx. 25 MJ/kg, regular gasoline is approx. 46 MJ/kg and H2 is approx. 130 MJ/kg.
Electrolysis and liquid reforming pathways both do not directly use or consume low-grade agricultural waste or biomass. Food waste is a major problem both for energy loss during production and transport phases, and during its final or post-consumption phase in terms of landfill use, decomposition and methane (landfill gas) escape into the atmosphere. Food waste can be considered biomass and it can be separated from landfill waste and used as feedstock for H2 production. Doing so further reduces overall energy wastage in the food cycle, in addition to the reduction realized through local farming.
Therefore, up-cycling local food refuse, waste, farm refuse and byproduct (collectively biomass) and using it as the feedstock for biomass fermentation (Satinover et al., 2020) or gasification (Meramo-Hurtado et al., 2020) processes is an excellent way to minimize waste and capture otherwise wasted latent energy as useful transportation fuel. Furthermore, these processes can use the energy generated from wind, solar photon intensity, and solar thermal for H2 production. The produced H2 can then be used as transport fuel locally. Or a collective of local farms can join together to become an off-grid H2 producing center capable of satisfying and off-setting some regional transportation fuel needs. Such centers would greatly be benefiting their local environment and economy.
An example techno-analysis for a small to medium scale farm is presented in (Janke et al., 2020). They show that sharing production among farms can reduce H2 production costs by up to 28% and when local delivery vehicles were modified to run on H2, overall cost further reduced by 35%. Strengthening the case for local H2 production and consumption in agriculture, similar to the UF based approach proposed in this paper.
Biomass fermentation/digestion pathway to H2 production can be further improved by the use of Microbial electrolysis cell (MEC) technology, where a selected electrochemically active bacteria oxidize organic matter to generate CO2, electrons and protons. MEC require external energy in the form of an electric current as an input to force ion movement in solution to produce H2. This current can be supplied by solar or wind energy generators making the process more energy neutral. The main challenges to use MEC technology are the reactor design and the need for membranes. Although, membrane free designs have been developed and are being tested currently; with large scale commercialization is still a few years away (Kadier et al., 2016; Dange et al., 2021). However, small scale reactors have been shown to be effective and can be readily incorporated into a distributed small scale farms for H2 production. Therefore, multiple successful demonstration of distributed small scale adoptions can bring about quicker large scale commercial adoption. Moreover, a favorable lending scheme or governmental assistance would also encourage commercial large scale adoption of such technologies earlier than when market economics could meaningfully support such adoptions.
Potential future work
This paper presented a design methodology and framework for approaching ex- urban agriculture. The reader would notice that the proposed approach has not been implemented or tested. Doing so would require capital that the author does not currently possess. Moreover, local business and governmental support is also vitally needed. In order to obtain these and to begin the next phase of this research i.e., to setup and test the proposed approach, a publicly read, peer reviewed, and well flushed out proposal is essential. This is the desired fundamental outcome for the phase one theoretical work presented in this paper. The feedback obtained will guide the direction of subsequent work and to establish research partnerships, particularly in developing regions with acute food insecurity.
Energy and food security are increasingly becoming principal concerns which can threaten economic and national security. With the COVID-19 pandemic exposing existing food supply chain weaknesses, pandemic driven exurban population growth, and ever increasing energy and food demands, local urban, suburban, and exurban agriculture have gained importance as a potential solution to both reducing grid energy demand and servicing local food needs via local production. In this paper, a modular land parcel i.e., unit field, based approach to exurban agriculture was presented. The unit field included a modified pumped storage design to reduce grid energy demand for standard farm operations by wind and solar augmentation.
The saving in energy costs over a 10-year period was shown to be economically equivalent to capital investment in solar and wind generation systems, even at minimal system size. When considering the cost of energy savings due to reduction in food waste over 10 years, it was determined that one million new farms could receive capital infusion of USD $31,800 to cover initial setup costs. Furthermore, additional avenues for revenue generation with and without new investments and capable of being operationalized in a short time, were also identified. Looking further into the future where new and renewable transportation fuels will be needed, several pathways which utilize the excess energy produced by the unit fields and the biomass generated locally to produce H2 were also identified. The produced H2, when used as transportation fuel, locally generates additional benefit both to the producers and the local energy and labor markets.
| Views | Downloads | |
|---|---|---|
| F1000Research | - | - |
|
PubMed Central
Data from PMC are received and updated monthly.
|
- | - |
Provide sufficient details of any financial or non-financial competing interests to enable users to assess whether your comments might lead a reasonable person to question your impartiality. Consider the following examples, but note that this is not an exhaustive list:
Sign up for content alerts and receive a weekly or monthly email with all newly published articles
Already registered? Sign in
The email address should be the one you originally registered with F1000.
You registered with F1000 via Google, so we cannot reset your password.
To sign in, please click here.
If you still need help with your Google account password, please click here.
You registered with F1000 via Facebook, so we cannot reset your password.
To sign in, please click here.
If you still need help with your Facebook account password, please click here.
If your email address is registered with us, we will email you instructions to reset your password.
If you think you should have received this email but it has not arrived, please check your spam filters and/or contact for further assistance.
Comments on this article Comments (0)