Keywords
GNSS, Equatorial Plasma Bubble, International GPS Service, Rate of TEC Index, Total Electron Content
This article is included in the Computational Modelling and Numerical Aspects in Engineering collection.
GNSS, Equatorial Plasma Bubble, International GPS Service, Rate of TEC Index, Total Electron Content
Global Navigation Satellite System (GNSS) is a satellite system that is used to pinpoint the location of a user’s receiver anywhere in the world. International GPS Service (IGS) is a worldwide network of receivers tracking the transmissions of GNSS satellites is a valuable source of ionospheric data that is globally distributed and continuously available.1 The services provided by GNSS are used in massive number of applications, both civilian and military. However, these signals are prone to several sources of disturbances, causing errors which result in degradation of positioning accuracy.
Ionosphere is the layer of the earth’s atmosphere extending from 80 to 1,000 km above the earth’s surface containing a high concentration of ions and free electrons and is able to reflect radio waves. Free electrons and ions are produced by solar radiation which causes group delay and phase advancement of GNSS signals resulting in positioning errors in order of tens of meters. Ionosphere is the highest contributor of GNSS positioning error.2 The ionospheric F-region extending from 250 to 400 kms contains the greatest concentration of free electrons. The plasma disturbances in the F-region scatter radio waves and generate rapid fluctuations in the amplitude and phase of GNSS signals called scintillations. The disturbances in ionospheric plasma are most frequent and severe in the geomagnetic equatorial belt from 20°N to 20°S, particularly during the post-sunset hours. These scintillations depend on the ionospheric Total Electron Content (TEC) which is the total number of free electrons in a cylindrical volume of one square meter cross section, extending from the receiver to the satellite.3
Low-latitude ionospheric scintillations are season- dependent and are primarily limited to local night-time hours.4 The ionospheric plasma irregularities vary greatly in spatial extent and drift with the background plasma at speeds of 50 to 150 m/sec. Ionospheric effects on GNSS signals are complex and difficult to mitigate given the inhomogeneous and anisotropic nature of the medium.5
Equatorial Plasma Bubbles (EPBs) represent plasma depletions with respect to the background ionosphere and are the most important sources for electron density irregularities in the F-region.6 EPBs are the ionospheric phenomenon near the earth’s geomagnetic equator which makeup one of the distinguishing phenomena that disrupt radio and satellite communications. EPBs are generated through the nonlinear evolution of the Rayleigh-Taylor instability (RTI). These EPBs form post sunset when the solar radiation ceases to ionise the ionosphere. During post-sunset period in the ionosphere, the absence of solar radiations causes rapid decay of the lower ionosphere, and a steep vertical density gradient develops on the bottom side of the raised F-layer.7
The EPB occurrences may be affected by inter-hemispheric neutral winds (meridional winds) blowing from summer hemisphere to winter hemisphere. Apart from the night-time EPBs occurrences, the daytime occurrence also happens but their cases are very exceptional. The daytime plasma density irregularities is expected to be caused by the irregularities associated with the sporadic E layers. Using the spread-F data has found a small percentage of occurrences of plasma bubbles between sunrise and local noon time.
The presence of EPBs can degrade the quantity and quality of the user and reference station measurements thereby disrupting the communication from GNSS.8,9 The EPBs can affect the radio-based technologies by scattering and diffracting radio wave signals that pass through them resulting in amplitude and phase scintillations in GNSS signals.5
There have been many studies on the occurrence characteristics of EPBs using localized observational data such as ionosondes, topside sounders, radio scintillations and in situ measurements.8 A new observational technique of EPBs is ground-based GNSS receiver’s data due to its wide coverage. The time derivative of TEC is often used to measure small-scale ionospheric fluctuations. Time differential TEC is called Rate of TEC (ROT).8 The standard gradient of ROT gives us the Rate of TEC Index (ROTI). In this paper, ROTI is used to identify the occurrence of plasma bubble using the ground-based GPS-TEC data. Hence by using the data from IGS website and by finding the corresponding ROTI values, the EPBs occurrence has been identified.
A solar cycle is the amount of magnetic flux that rises up to the Sun’s surface varies with time in a cycle. This cycle lasts 11 years on average. This cycle is sometimes referred to as the sunspot cycle. Our Sun is a huge ball of electrically-charged hot gas. This charged gas moves, generating a powerful magnetic field. The Sun’s magnetic field goes through a cycle, called the solar cycle. Every 11 years or so, the Sun’s magnetic field completely flips. This means that the Sun’s north and south poles switch places. Then it takes about another 11 years for the Sun’s north and south poles to flip back again. The solar cycle affects activity on the surface of the Sun, such as sunspots which are caused by the Sun’s magnetic fields. As the magnetic fields change, so does the amount of activity on the Sun’s surface. This period of time is considered as cycle 24 which have started in the year 2008 and might end between mid-2019 and late 2020.
GNSS data from IISC station Bangalore, Karnataka, India (latitude- 13.0219°N, longitude-77.5671°E) is collected from SOPAC (SCRIPPS ORBIT AND PERMANENT ARRAY CENTER) archives for the duration 1st January, 2014 to 31st December, 2019 of the 24th solar cycle. SOPAC is a major participant in association with the International GPS Service (IGS), serving as a Global Data Center and a Global Analysis Center. The data is downloaded one day at a time in RINEX (Receiver Independent Exchange) format.10 RINEX is a data interchange format for raw satellite navigation system data in a compressed form. The downloaded RINEX data file is converted to an easily understandable.cmn format using the GPS-TEC application software developed by Dr. Gopi Krishna Seemala.11 The converted data consists of time, PRN, Slant TEC (STEC), Vertical TEC (VTEC), elevation angle and azimuth angle. Only data corresponding to elevation angles greater than 40° were considered as lower elevation angles are associated with increased multipath error. The ROTI based EPB detection algorithm is discussed in section 3.
The occurrence of EPBs depends on factors such as local time, PRN, Slant TEC (STEC), elevation angle, etc. These parameters refer to occurrence rate, intensity of depletion, depth of depletion and size of EPBs.
TEC can be monitored for identifying possible space weather impacts for the ground to satellite communication and satellite navigation.3 The Rate Of TEC Index (ROTI), defined as the standard deviation of the Rate of change of TEC (ROT). The computation of ROTI involves the time derivative of TEC which automatically eliminates the unknown TEC biases, mitigates the slowly varying background trend of TEC, and emphasizes the high frequency components of TEC fluctuations. ROT is given by equation (1)
and are slant TEC at consecutive epoch times and , respectively, where > .
ROTI is given by equation (2).
N is the number of samples.
=mean of all N ROT values
In this paper, one 30 min ROTI was derived from the average of six values of 5 min ROTI.8 Daytime ROTI (Rday) is the average value of ROTI computed over a 3 hour time period from 12 hours to 15 hours local time. Evening ROTI (Reve) is the average value of ROTI over a duration of 6 hours from sunset to midnight (i.e., 18 hours to 24 hours) local time. The difference Reve -Rday, on a given day is considered as the decision criterion for EPB detection activity that one day. EPBs are considered to be detected on a given day, if (Reve -Rday) >0.05 TECU/min.12 In this paper, detection of EPBs has been done using ROTI for the waning phase of solar cycle 24.
This proposed algorithm has been deposited in protocols.io. as “Protocols.io.swapna.karnam”, with the title “Detection of Equatorial Plasma Bubbles”. The detailed protocol with description is available in the following weblink - https://protocols.io/view/detection-of-equatorial-plasma-bubbles-civeue3e with DOI dx.doi.org/10.17504/protocols.io.rm7vzbb12vx1/v1
The processing and analysis of ROTI algorithm was carried out in MATLAB version 2019a software using the tool Research Resource Identifier (RRID) SCR_001622.13
The data was collected from IGS receiver located at IISC Bangalore, Karnataka, India of year 2016. The time, PRN, STEC, elevation angle were extracted from the collected data. ROTI values were found to detect EPBs as explained in the Methodology section. Figure 1 shows the process flow of the EPB detection algorithm. This study investigates the casual linkage between EPB’s and TEC using solar maximum and minimum period.14
The analysis of EPBs has been demonstrated for two geomagnetically quiet days and two geomagnetically distributed days. IGS data collected from IISC station on the 6th and 7th February, 2016 were considered to demonstrate the performance of the ROTI based EPB detector for geomagnetically calm days as the average Kp index on those days was 2.
Kp is an excellent indicator of disturbances in the Earth’s magnetic field and is used by Space Weather Prediction Centre (SWPC) to decide whether geomagnetic alerts and warnings need to be issued for users who are affected by these disturbances. The Kp-index or Planetary K-index characterizes the magnitude of geomagnetic storms.3 The total day is divided into 8 slots of 3hours each. Figure 2 has been taken from www.magneticstormsonline.com, which depicts the Kp index values on 6th and 7th February, 2016. The average value of Kp index is 2 for both the days indicating geomagnetic calm. Kp index values exceeding 5 indicate a geomagnetic storm.
Figure 3 shows the STEC, ROT and ROTI values on 6th February, 2020 at IISC station for PRN 7. The data from PRN 7 was available from 19.40 hours to 22.40 hours local time. From Figure 3, it can be observed that the STEC values showed a very smooth variation during the entire period with no abrupt variations with a maximum value of 50 TECU. The calculated value of ROT reached a maximum value of 0.6 TECU/min and ROTI values varied from 0 to 0.05 TECU/min. From the smooth curve of STEC and small values of ROTI and ROT it can be hypothesised that 6th February, 2016 was a geomagnetically quiet day.
The Figure 4 and 5 show the Reve, Rday, (Reve - Rday) values and the threshold of 0.05 TECU/min for 6th and 7th February, 2016 respectively at the IISC station, Bangalore. It can be seen from Figures 4 and 5 that the (Reve -Rday) on both 6th and 7th February, 2016 did not exceed the threshold of 0.05 TECU/min, hence declaring them as EPB free days. The results shown in Figures 4 and 5 are in perfect correlation with the Kp index values of Figure 2.
Figure 6 depicts the Kp index values on 16th and 17th February, 2016 at IISC station, Bangalore. The average value of Kp index on 16th and 17th February, 2016 was found to be 5 which indicates the occurrence of a geomagnetic storm on those two days.
Figure 7 shows the STEC, ROT and ROTI values on 16th February, 2020 at IISC Station, Bangalore from PRN 7. The data from PRN 7 was available from 18.70 hours to 21.70 hours, local time. From Figure 7, it is apparent that the STEC curve depicts ups and downs unlike the smooth curve in Figure 3. The maximum value of STEC recorded on 16th Feb, 2020 was 80 TECU. The STEC value decreased to 0 TECU at 20.40 hours followed by an increase and decrease. The ROT values varied from 0 to 2 TECU/min reaching the maximum at 20.40 hours. The ROTI value reached a maximum of 0.6 TECU/min at 20.40 hours. The variations in STEC, ROT and ROTI during the post sunset hours evidently indicate geomagnetic disturbances on 16th February, 2020 which is in correlation with Figure 6.
Figures 8 and 9 illustrate the Reve, Rday, (Reve - Rday) values along with the threshold of 0.05 TECU/min. It is evident from the Figures 8 and 9 that the Reve values on both 16th and 17th February, 2016 are considerably higher than the Rday values such that the difference (Reve - Rday) exceeded 0.05 TECU/min, thus declaring the presence of EPBs on both the days.
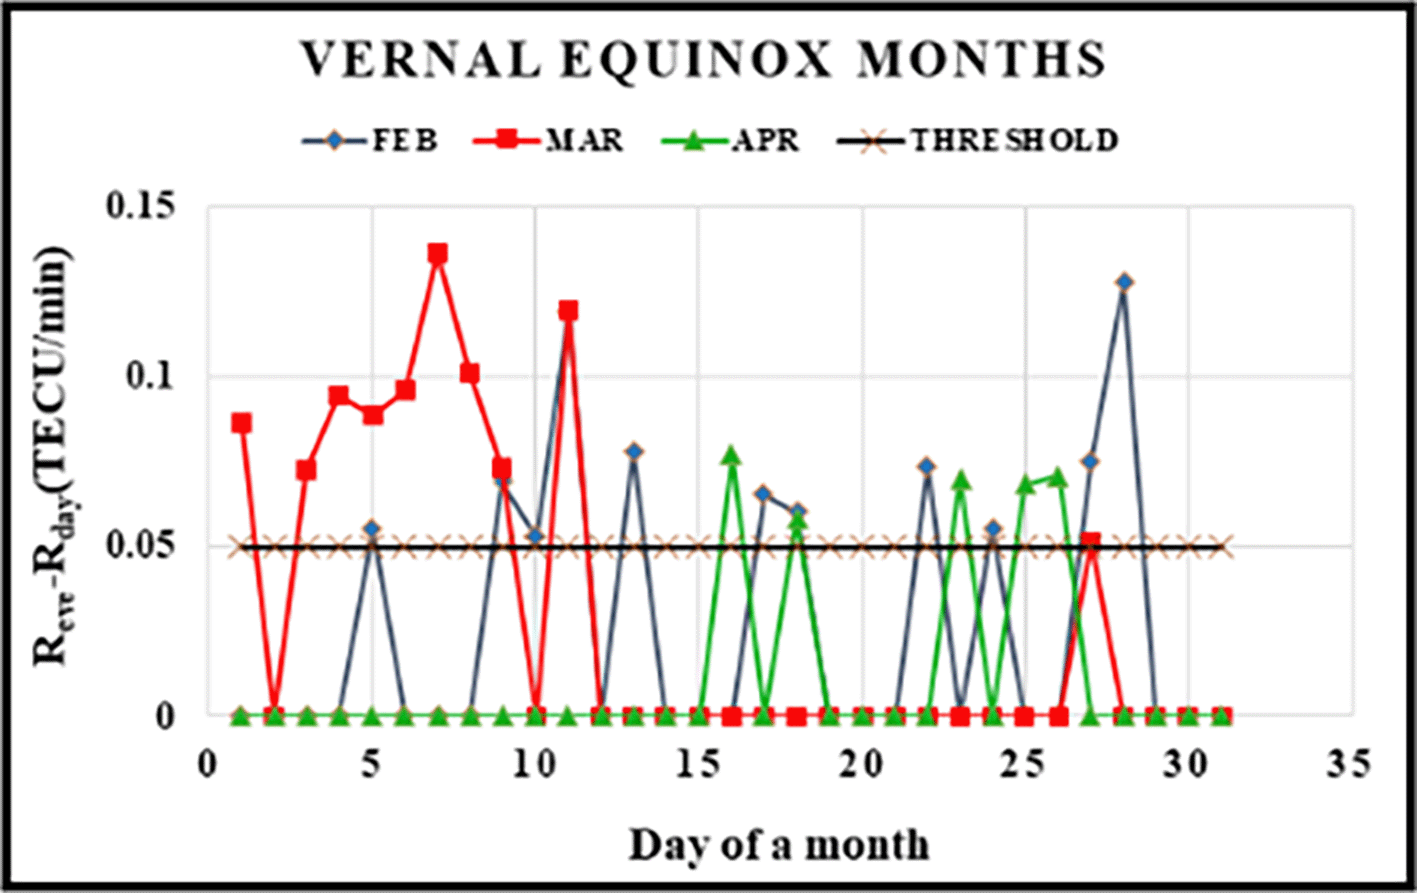
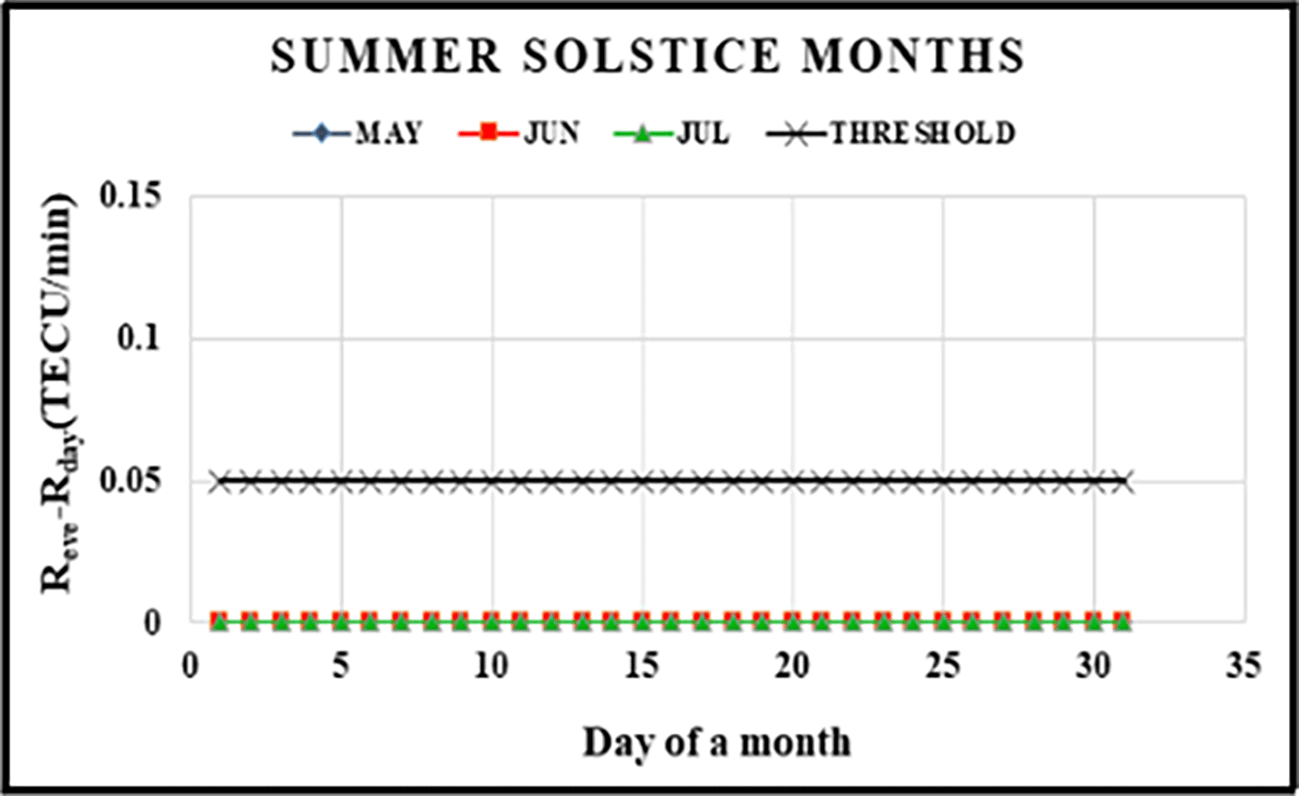
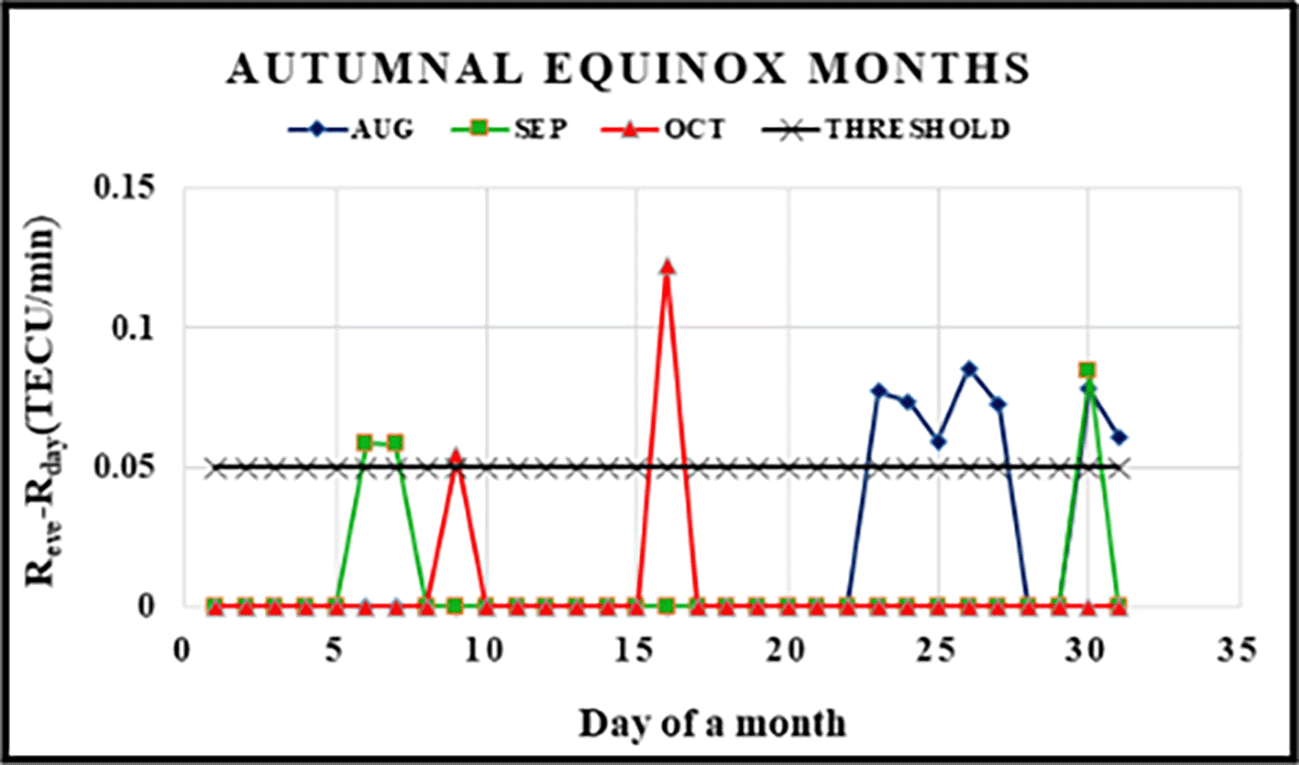
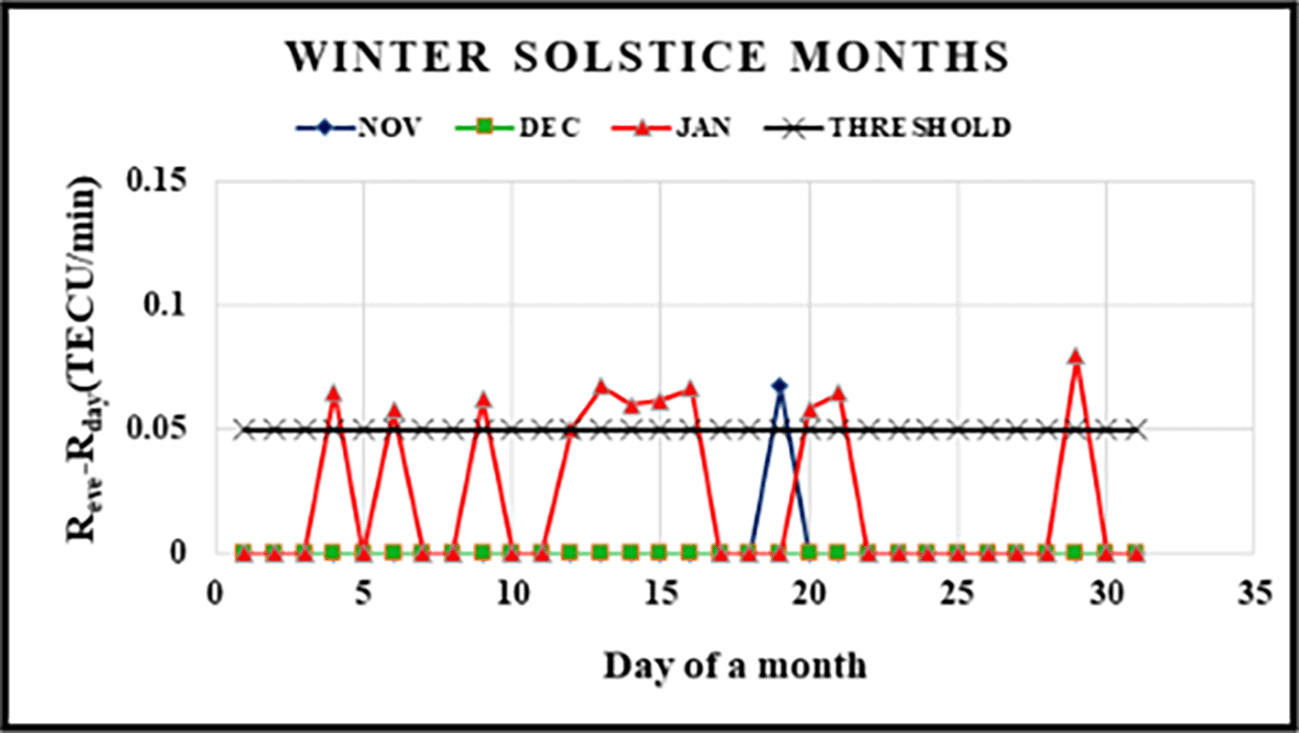
To study the seasonal EPBs occurrence, the monthly occurrences of 2016 year have been grouped into four seasons namely Vernal/Spring equinox months (February to April), Summer solstice months (May to July), Autumnal equinox months (August to October) and Winter solstice months (November to January).
The decision criterion (Reve -Rday) values, for the detection of EPBs, for every day of the four seasons, Spring, Summer, Autumn and Winter are shown in Figures 10 to 13 respectively.


It can be observed from Figure 10, that the number of disturbances in the month of March is more when compared to those in February and April.
Figure 11 shows the days on which EPBs were detected during the summer solstice months of May, June and July. It is apparent from Figure 11 that there were non EPBs detected during the summer solstice months. During these three months, the decision criterion (Reve-Rday) equal to zero.
Figure 12 depicts the (Reve-Rday) values during the Autumnal equinox months of August, September and October. As can be noticed in Figure 12, the number of days on which EPBs were detected is less than those detected during the Vernal equinox months indicating an equinoctial asymmetry.
Figure 13 shows the decision criterion values during the Winter solstice months of November, December and January of the year 2016 at IISC station, Bangalore. From Figure 13, it can be observed that the month of January recorded the maximum number of EPB events in 2016. As per the pre-established EPB climatology, the ionospheric disturbances during equinoctial months are greater than those during the solstice months.15
However, an increased number of EPB detections in January indicate a winter anomaly, which also is quite common in low latitude ionosphere.
The analysis of monthly EPBs occurrences for half of the 24th solar cycle has been carried out, which are shown in Figures 14 to 19. The observed EPBs occurrences were found maximum during month of January, February, March, April, August.
Figure 14 indicates the month wise EPB detection of year 2014 of IISC Bangalore Station. It is observed that the maximum detection of EPBs were in the months of March, February, April and January.
Figure 15 indicates the month wise EPB detection of year 2015 of IISC Bangalore Station. It is observed that the maximum detection of EPBs were in the months of March, April, January, September, August, February, and May.
Figure 16 indicates the month wise EPB detection of year 2016 of IISC Bangalore Station. It is observed that the maximum detection of EPBs were in the months of March, January, February and August.
Figure 17 indicates the month wise EPB detection of year 2017 of IISC Bangalore Station. It is observed that the maximum detection of EPBs were in the months of February, March, April and November.
Figure 18 indicates the month wise EPB detection of year 2018 of IISC Bangalore Station. It is observed that no EPB is detected in this year.
Figure 19 indicates the month wise EPB detection of year 2019 of IISC Bangalore Station. It is observed that October, November and December are the months detected with EPBs.
During this half solar cycle period, maximum EPBs occurrences were observed during January. Moreover, the EPBs occurrences during February, March, April and August were also found to be significantly larger than in September, October, November.
There are no EPBs occurrences for the month May, June, July, December. Occurrence rate of EPBs are expected to be high during the period when the sunset time lag is small, in other words, when the sunsets of the geomagnetic conjugate points are synchronized. This is “magnetic equinox”. The solstice periods are detected with zero and less EPBs. The asymmetric equinox periods are detected with more EPBs. The sunset time lag effect plays an important role for the monthly variation.
In this paper the IGS data has been analysed for half solar cycle period from 2014-2019 year for IISC Bangalore, Karnataka, India. The ionospheric errors over low-latitudinal regions has been discussed. The algorithm which can be used to detect the EPBs over low-latitudes has been discussed. The proposed ROTI algorithm detects the occurrence of EPBs using IGS data. Here, we have considered two quiet days and two disturbed days and plotted them. SWPC data is used for comparison of whether geomagnetic alerts and warnings need to be issued for users who are affected by these disturbances and can be concluded that the particular days have geomagnetic disturbances (storms) or not. As the solar cycle is of 11 years, we have considered a half solar cycle for detection of EPBs using ROTI algorithm. The middle years of the solar cycle are detected to have more solar spots and hence years 2014 and 2015 are detected with more no. of EPBs. And the no. of EPBs detected reduced by the end of the solar cycle. This shows that ROTI algorithm is beneficial in detecting EPBs. This ROTI algorithm can be used over GAGAN data to detect EPBs.
Swapna Raghunath and Ch. Ushakumari: Conception and design of study. Swapna Raghunath, T Padma: Acquisition, analysis and/or interpretation of data. Swapna Raghunath, T Padma, Ch. Usha Kumari: Drafting the manuscript and revising the manuscript critically for important intellectual content.
Hereby, we Swapna Raghunath and Ch. Usha kumari consciously assure that for the manuscript Equatorial Plasma Bubbles Identification with Single Frequency GNSS Receiver Data is the authors’ own original work, which has not been previously published elsewhere and the paper is not currently being considered for publication elsewhere.
Figshare: [Equatorial Plasma Bubbles Identification with Single Frequency GNSS Receiver]. https://doi.org/10.6084/m9.figshare.21310275.v1
This project contains the following underlying data:
- Data.zip. The data is considered for finding Equatorial Plasma Bubbles Identification with Single Frequency GNSS Receiver
Data are available under the terms of the Creative Commons Attribution 4.0 International license (CC-BY 4.0).
| Views | Downloads | |
|---|---|---|
| F1000Research | - | - |
|
PubMed Central
Data from PMC are received and updated monthly.
|
- | - |
Is the work clearly and accurately presented and does it cite the current literature?
No
Is the study design appropriate and is the work technically sound?
Partly
Are sufficient details of methods and analysis provided to allow replication by others?
Partly
If applicable, is the statistical analysis and its interpretation appropriate?
No
Are all the source data underlying the results available to ensure full reproducibility?
Partly
Are the conclusions drawn adequately supported by the results?
No
References
1. Briggs B, Parkin I: On the variation of radio star and satellite scintillations with zenith angle. Journal of Atmospheric and Terrestrial Physics. 1963; 25 (6): 339-366 Publisher Full TextCompeting Interests: No competing interests were disclosed.
Reviewer Expertise: Space Sciences, Earth & Environmental Sciences, Atmospheric Sciences
Is the work clearly and accurately presented and does it cite the current literature?
No
Is the study design appropriate and is the work technically sound?
Partly
Are sufficient details of methods and analysis provided to allow replication by others?
No
If applicable, is the statistical analysis and its interpretation appropriate?
Not applicable
Are all the source data underlying the results available to ensure full reproducibility?
No
Are the conclusions drawn adequately supported by the results?
No
Competing Interests: No competing interests were disclosed.
Reviewer Expertise: Ionospheric weather, equatorial plasma bubbles study, GNSS positioning
Is the work clearly and accurately presented and does it cite the current literature?
Yes
Is the study design appropriate and is the work technically sound?
Partly
Are sufficient details of methods and analysis provided to allow replication by others?
Partly
If applicable, is the statistical analysis and its interpretation appropriate?
Partly
Are all the source data underlying the results available to ensure full reproducibility?
Yes
Are the conclusions drawn adequately supported by the results?
Partly
Competing Interests: No competing interests were disclosed.
Reviewer Expertise: GNSS ionospheric scintillation.
Is the work clearly and accurately presented and does it cite the current literature?
No
Is the study design appropriate and is the work technically sound?
Yes
Are sufficient details of methods and analysis provided to allow replication by others?
Yes
If applicable, is the statistical analysis and its interpretation appropriate?
Partly
Are all the source data underlying the results available to ensure full reproducibility?
No
Are the conclusions drawn adequately supported by the results?
No
Competing Interests: No competing interests were disclosed.
Reviewer Expertise: Equatorial Plasma bubbles, Scintillations, Plasma irregularities
Alongside their report, reviewers assign a status to the article:
| Invited Reviewers | ||||
|---|---|---|---|---|
| 1 | 2 | 3 | 4 | |
|
Version 1 11 Jan 23 |
read | read | read | read |
Provide sufficient details of any financial or non-financial competing interests to enable users to assess whether your comments might lead a reasonable person to question your impartiality. Consider the following examples, but note that this is not an exhaustive list:
Sign up for content alerts and receive a weekly or monthly email with all newly published articles
Already registered? Sign in
The email address should be the one you originally registered with F1000.
You registered with F1000 via Google, so we cannot reset your password.
To sign in, please click here.
If you still need help with your Google account password, please click here.
You registered with F1000 via Facebook, so we cannot reset your password.
To sign in, please click here.
If you still need help with your Facebook account password, please click here.
If your email address is registered with us, we will email you instructions to reset your password.
If you think you should have received this email but it has not arrived, please check your spam filters and/or contact for further assistance.
Comments on this article Comments (0)