Keywords
Sustainable Supply Chain, Reuse, Waste, SUSTAINABLE SUPPLY CHAIN, CLOSED-LOOP SUPPLY CHAIN, MATH PROGRAMMING, OPERATIONS MANAGEMENT, OPTIMIZATION
Sustainable Supply Chain, Reuse, Waste, SUSTAINABLE SUPPLY CHAIN, CLOSED-LOOP SUPPLY CHAIN, MATH PROGRAMMING, OPERATIONS MANAGEMENT, OPTIMIZATION
The concept of a circular economy has garnered increasing attention from policymakers, academia, and industry, particularly in the pursuit of a more sustainable society. Additionally, it has become a significant subject of academic research, with a substantial increase in the number of articles and publications on the topic in recent years. Early pioneers introduced key aspects of the circular economy, focusing on waste prevention, job creation, and efficient resource utilization within the industrial economy (Yin et al., 2023). Others discussed the term ‘circular economy’ in the context of sustainability within the economic system. Subsequent articles elaborated on various aspects of the circular economy, including its requirements, scope and levels, comparisons with the linear economy, and related concepts. More recently, diverse perspectives on the circular economy and its relationship with sustainability have been provided. The circular economy is defined as a regenerative framework that restricts resources, waste, emissions, and energy consumption by closing and narrowing material and energy loops. This framework offers an alternative to the traditional ‘make-use-dispose’ approach adopted by many industries. The circular economy’s objectives can be achieved through principles such as sustainable design, reuse, repair, refurbishing, recycling, and remanufacturing (Liu et al., 2023; Wrålsen & O’Born, 2023). However, it is argued that recycling alone may not be a sustainable solution due to the loss of value incurred during the production of new items. Several researchers are now examining closed-loop supply chain strategies, particularly refurbishing (or remanufacturing), as a means to contribute to the circular economy’s objectives. Refurbishing stands out as the only circular business model that provides products with the latest features and warranties. To date, the literature has addressed various issues related to remanufacturing, including production planning and control, marketing, and competition.
Refurbishing stands out as a crucial procedure within sustainable production systems due to its capacity to diminish resource utilization, conserve energy, mitigate carbon emissions, and reduce production lead-time (Cesur et al., 2022; Singhal et al., 2020; Zhang et al., 2020). The refurbishing process entails acquiring used products from end-users once they reach the end of their current lifecycle, enabling the recovery of added value and the restoration of these products for functional use. Proficiently managing this procedure can yield substantial economic, ecological, and social advantages for manufacturing systems that are impossible to disregard. Consequently, the realm of refurbishing has become a pivotal focus of research for scholars on a global scale. In the refurbishing process, a used product undergoes a series of steps, including disassembly, sorting and cleaning, scanning, refurbishment or replacement, reassembly, and quality testing before re-entering the market. Refurbishing has the potential to deliver significant environmental, social, and economic advantages by extending the lifecycle of used products. Environmental benefits include a reduced carbon footprint and decreased energy and material consumption. For instance, refurbished products consume 85% less energy than the production of equivalent new products. Additionally, refurbishing engines can lead to a reduction of 565 kg of CO2 emissions and 55 kg of steel usage. It is possible to refurbish 7-11 more units using the same amount of energy and materials as manufacturing new ones. Furthermore, refurbishing benefits society by providing employment opportunities for both unskilled and skilled labor, while also offering economic benefits through the lower prices of refurbished products. Typically, refurbished items are sold at prices as low as 60% of the cost of new items (Singhal et al., 2020).
A multitude of original equipment manufacturers (OEMs), such as GE, Xerox, HP, IBM, and Caterpillar, have actively participated in refurbishing operations. While these manufacturers possess technological and brand advantages in refurbishing, the process of collecting used products incurs higher transportation and inventory costs when manufacturers are geographically distant from their product-selling locations. Nevertheless, some OEMs display reluctance in engaging directly in refurbishing or outsourcing to third-party refurbishers (TPRs) (Fang et al., 2023; He et al., 2020; Teng & Feng, 2021; Yang et al., 2022; Zou et al., 2019). This hesitancy often arises due to patent protection, as TPRs are obliged to pay fixed or variable technology authorization fees to the OEMs for obtaining the necessary authorization. A pivotal challenge for TPRs lies in attracting OEMs for collaboration, contingent on their refurbishing advantages. For instance, Flex received the “Sustainable Development Leadership Award 2020” for the third consecutive time, attributing its success to an Internet of Things (IoT) device known as Smartbin, developed by its subsidiary, Sinctronics. Smartbin facilitates the collection of electronic materials for refurbishing or remanufacturing, enabling the management of electronic waste and pollution in the IT industry. This innovation streamlines the electronic waste collection process and reduces return costs by 40% during testing. Consequently, TPRs’ refurbishing processes become more cost-effective and environmentally sustainable. Additionally, TPRs can attain superior return quality compared to OEMs by expanding their recycling channels through dedicated recycling platforms. Therefore, in practice, TPRs possess a distinct competitive advantage in refurbishing, marked by both cost-effectiveness and quality-effectiveness, which significantly impacts the choices made by OEMs, resulting in divergent outcomes.
Whether refurbishing takes place internally or is outsourced, it has a notable impact on the sale of new products since refurbished items, typically of lower quality, are consistently priced lower than their new counterparts. This reduced willingness-to-pay for refurbished products among consumers can provide Original Equipment Manufacturers (OEMs) with an opportunity to access a new market segment and expand their market share. For instance, Robert Bosch Tool ventured into the lower-end market segment, where Bosch did not have a significant presence, by offering refurbished products. This strategy also helps fend off competition from inexpensive imports. The lower price point of refurbished goods may attract price-sensitive consumers, leading them to prefer these options over new products. Auction results suggest that consumers are willing to pay 15.3% less for refurbished products compared to new ones. A manager at a global PC OEM is confident that for every four refurbished products sold, one new product sale is cannibalized. This price-based cannibalization issue fundamentally stems from the quality distinction between new and refurbished products. It is important to note that refurbished products are derived from the rejuvenation of end-of-life products or their components. Consequently, any improvement in the quality of new products also contributes, to some extent, to an enhancement in the quality of refurbished products (Atasu & Souza, 2013; Feng et al., 2020; He et al., 2020; Kleber et al., 2018; Örsdemir et al., 2014). Unlike quality distinctions observed among independent product categories, the quality of refurbished items is intrinsically linked to that of the original products. Therefore, in their efforts to access new market segments through refurbishing and address the challenges of cannibalization stemming from refurbished products, Original Equipment Manufacturers (OEMs) often leverage consumers’ preferences for varying product quality. For example, Lexmark adopted a strategy of rendering their end-of-life cores non-reusable for refurbishing to mitigate the issues associated with cannibalization from refurbished products. Conversely, intriguingly, to maintain and expand their foothold in new market segments, some OEMs have strategically invested in producing high-quality cores designed for reuse in refurbishing. For instance, Xerox invested in modular design to ensure the feasibility of refurbishing used cores. Likewise, numerous renowned OEMs, including Cummins, Caterpillar, and Electrolux, have undertaken initiatives to optimize and streamline the refurbishing process, thereby enhancing its overall efficiency.
Researchers have acknowledged the notable contrast in how consumers perceive the quality differentiation between new and refurbished products (McKie et al., 2018). As a result, consumer conduct regarding these goods assumes a pivotal role in the pricing matter, as it can affect the demand for both product categories (Belbağ & Belbağ, 2023; Ke & Yan, 2022; Wang et al., 2020). Many previous studies have operated under the assumption that consumer behavior is primarily influenced by their willingness to pay (WTP), implying that the demand for refurbished products diminishes as product prices rise. These studies generally adopt the conventional WTP-based demand assumption. In contrast, our paper expands upon previous cannibalization analyses by introducing a multi-segment cannibalization demand model. In this model, the firm’s decision-making process involves estimating the portion of consumers who, given a specific price difference, would transition from purchasing new products to opting for refurbished ones. We delve into the impact of market segmentation on the optimal strategy within this context. In line with the investigations conducted by Ovchinnikov (2011) and Kurdhi et al. (2023), the presence of refurbished products at reduced price points triggers concerns regarding potential sales cannibalization for higher-margin new products. Consequently, numerous companies opt not to introduce refurbished products alongside new ones. Nonetheless, by astutely integrating both refurbished and new products into their product range, firms can effectively target distinct customer segments and secure sales from individuals seeking cost-effective refurbished alternatives. Despite the potential for some attrition in sales of new products, diligently calibrated pricing strategies and refurbishing volumes can result in substantial overall financial benefits for the company. The consumer market is characterized by two distinct customer segments: high-end and low-end. High-end customers are open to purchasing new products but may also contemplate refurbished options. In contrast, low-end customers exclusively favor refurbished products. It is noteworthy that companies generally uphold consistent and unchanging pricing structures for their new products, and the refurbishing process typically exerts no observable influence on pricing, procurement, or other determinants related to new product offerings.
OEMs must also consider the presence of used products within a specific region when evaluating refurbishing programs. The degree of market presence significantly influences the collection efforts of third parties (3Ps) and can potentially restrict their access to used products. A national survey conducted by Saphores et al. (2009) revealed that, on average, each household in the United States had 4.1 small and 2.4 large electronic waste (e-waste) items stored, surpassing the estimates provided by the United States Environmental Protection Agency (US EPA). This suggests that the backlog of e-waste in the United States may be larger than previously believed. Sabbaghi et al. (2015) also noted that commercial consumers tend to accumulate more stored computers, regardless of brand or capacity, compared to household consumers. Furthermore, (Sabbaghi et al., 2016) highlighted that consumers often retain their unwanted electronic devices even after their last usage. According to the US EPA, e-waste has surged by 120% over the past decade, with only 25% of it being collected for recycling or reuse (PMR). Consequently, there exists a substantial reservoir of used products that could potentially be collected. In our investigation, we analyze refurbishing program strategies under two conditions: unrestricted access to used products and constrained access to them.
In this study, a model was devised to explore the dynamics of in-house refurbishing versus outsourcing refurbishing to third parties, as well as outsourcing refurbishing to retailers. The study also investigates consumer behavior and cannibalization functions within these models, distinguishing between two consumer segments: high-end customers and low-end customers. Furthermore, the research takes into account constraints on the supply of used products. The primary objective is to determine the optimal pricing and quantity strategies for new and refurbished products, aimed at maximizing profits from their sales based on the formulated model. By analyzing these factors comprehensively, this study contributes valuable insights into the strategic decision-making processes involved in product refurbishing, thereby providing a foundation for businesses to optimize their operations and enhance profitability in an increasingly competitive market environment.
This research delves into three distinct cases: Model In-House Refurbishing (Model I), Model Refurbishing Outsourcing to Third-Party (Model T), and Model Refurbishing Outsourcing to Retailer (Model R). We initiated the model construction process by outlining several key assumptions.
In Model I, manufacturers are the sole participants, while Model T comprises both manufacturers and third parties, and Model R involves manufacturers and retailers.
In the in-house refurbishing model, manufacturers are responsible for both the production of new products and refurbished products. In the outsourcing refurbishing model to third parties, manufacturers focus on the production of new products, while third parties take on the task of producing refurbished products. In the outsourcing refurbishing model to third parties, the third party receives a license fee from the manufacturer for their involvement. Moving to the outsourcing refurbishing model with retailers, manufacturers are primarily engaged in the production of new products, with refurbished products being manufactured by retailers. In this particular model, manufacturers exclusively sell new products to retailers. Additionally, retailers are responsible for selling both new products and refurbished products to consumers.
A quality choice is determined by the manufacturer.
The production cost per unit of a new product of a certain quality level is represented as a variable, denoted as , and it is defined as . If k is the unit price scaling parameter, the acquisition cost of refurbished devices is given by , with belonging to the interval . This cost function structure embodies several significant characteristics when both refurbished and new products are introduced simultaneously. Firstly, if there is an enhancement in the quality of new products, there will be a corresponding improvement in the quality of refurbished products to a certain degree. Thus, the cost of refurbished products is inherently linked to the quality of new products. Secondly, due to the fact that refurbishing products necessitates fewer raw materials and less energy compared to the production of new products, the cost function outlined above underscores that refurbishing a unit is more cost-effective than manufacturing a new one.
There exist constraints on the supply of remanufacturable products, denoted by , where represents the proportion of consumables that can be collected and subsequently transformed into refurbished products.
Refurbished products are derived from remanufacturable products, which means that the supply of these products is constrained by the quantity of new products sold to consumers. However, not all remanufacturable products are eligible for conversion into refurbished products due to quality standards. This variability in eligibility can result in production levels that are less stable. To efficiently utilize resources in the production process, manufacturers must conduct observations and analyses focused on optimizing production.
The demand functions for both new and refurbished products have been derived based on the segmentation of customer behavior when it comes to their preferences for purchasing either new or refurbished items, where
In this study, it is important to note that the values of (the price of new products) and (the price of refurbished products) are not considered constant. There exists a potential market denoted as , which represents a certain number of consumers interested in the products being offered. Additionally, there is a quality level associated with new products, determined by the manufacturer, which influences both the number of new consumers opting for refurbished products and the number of high-end customers who would switch to refurbished products if they were available. The demand for new products is determined by the number of high-end customers purchasing new products, denoted as minus the number of high-end customers switching to buying refurbished products, represented as . On the other hand, the demand for refurbished products is derived from the sum of consumers buying refurbished products and high-end customers transitioning to refurbished products. This description leads to the formulation of the inverse demand function, which can be expressed as follows:
The existence of new products and refurbished products that compete in the market causes a cannibalization effect.
The level of cannibalization in this study is influenced by the quality choice so that the cannibalization function becomes
The fundamental models are illustrated in Figure 1, and all related variables and parameters are presented in Table 1.

(a) Model I, (b) model T, and (c) model R.
Methodological Approach: Formulation and Resolution of Models This research centers on the refurbishing and quality choice models employed by manufacturers. In this subsection, we will develop a refurbishing model that incorporates the consideration of quality choice. The model is solved using the Stackelberg game with a backward induction procedureand Karush-Kuhn-Tucker (KKT). The Karush-Kuhn-Tucker (KKT) conditions are an extension of the Lagrange method. The KKT conditions can be applied in solving both maximum and minimum problems with inequality constraints. Solving problems using the Karush-Kuhn-Tucker method also requires the Lagrange multiplier factor, denoted by . Functions with inequality constraints pose the following problem:
where and are, respectively, the objective function and the constraint function. In this problem, is a multivariable function with representing the decision variables, and representing the inequality constraints. The inequality constraints can be transformed by adding non-negative slack variables , thus becoming , where and are sequential pairs. Consequently, the optimization problem becomes:The Lagrange function for solving these constraints is:
where is the Lagrange multiplier vector. The vector measures the rate of change of the optimum value with respect to small changes in the constraint function , mathematically expressed as . Therefore, for maximization problems, if , the necessary condition for optimization is that is non-negative (). Conversely, if the objective function is to minimize, then the necessary condition for optimization is that is less than or equal to zero (). This condition becomes one of the necessary conditions in the Karush-Kuhn-Tucker method. The necessary conditions for maximization in Karush-Kuhn-Tucker are as follows:In this case, if , then , and if , then . If the problem is to minimize the objective function, then conditions 2, 3, and 4 are also necessary conditions for the Karush-Kuhn-Tucker method, but condition 1, the Lagrange multiplier , must be negative.
In the in-house refurbishing model, producers derive their profits from the revenues generated through the production of both new and refurbished products. Producers make decisions regarding the quantity of new products and refurbished products to manufacture, oversee the production process, and subsequently sell these products to consumers. The manufacturer’s problem in this context can be outlined as follows:
The profit function represented by Equation (5) is subject to a single constraint, leading to two distinct cases: cases, and Through the utilization of Equations (3) and (4) and based on the underlying assumptions, we arrive at the formulation of the Lagrange function as follows:
In this context, the symbol denotes a Lagrange multiplier. The profit function is concave concerning the variables and , indicating the presence of a singular optimal solution. Consequently, we can establish the KKT optimality conditions as follows, which represent necessary conditions for optimality in constrained optimization problems, incorporating both equality and inequality constraints, thereby facilitating a comprehensive analysis of the model’s optimal solution.
Based on Equation (8)-(11), the optimal values for are computed for each scenario by applying the four Kuhn-Tucker conditions.
In the in-house refurbishing model there are two cases namely partial refurbishing when only part of the consumable product can be reprocessed into refurbished products (λ = 0) and full refurbishing when all consumable products can be reprocessed into refurbished products (λ > 0) so that there are two optimum solutions:
(i) In the in-house refurbishing model, the manufacturer performs partial refurbishing (λ = 0) when the production cost parameter scale . The optimum values for the price of new products, price of refurbished products, quality choice, quantity of new product production, production quantity of refurbished products, and manufacturer profit are as follows.
(ii) In the in-house refurbishing model, the manufacturer performs full refurbishing (λ > 0) when the cost parameter scale . The optimum value for the price of new products, prices of refurbished products, quality choice, production quantities of new products, production quantities of refurbished products, and manufacturer profits are as follows.
In the outsourcing refurbishing model to third parties, the manufacturer’s profit is generated solely from the production revenue of new products. Manufacturers are responsible for the production of new products, which are subsequently sold to both consumers and third parties. In this model, manufacturers exclusively make decisions regarding the quantity of new products to manufacture. The manufacturer also sets the license fees that third parties must pay when conducting the refurbishing process. On the other hand, the profits earned by third parties are derived from the sales of refurbished products. The problems faced by the manufacturer and third parties can be described as follows:
The profit function represented by Equation (5) is subject to a single constraint, leading to two distinct cases: cases, and Through the utilization of Equations (3) and (4) and based on the underlying assumptions, we arrive at the formulation of the Lagrange function as follows:
In this context, the symbol denotes a Lagrange multiplier. The profit function is concave concerning the variables and , indicating the presence of a singular optimal solution. Consequently, we can establish the Karush-Kuhn-Tucker (KKT) optimality conditions as follows:
Based on Equation (27)-(30), the optimal values for and are computed for each scenario by applying the four Kuhn-Tucker conditions.
In the refurbishing outsourcing to third-party model there are two cases namely partial refurbishing when only part of the consumable product can be reprocessed into refurbished products (λ = 0) and full refurbishing when all consumable products can be reprocessed into refurbished products (λ > 0) so that there are two optimum solutions:
(i) In the refurbishing outsourcing to third-party, the manufacturer performs partial refurbishing (λ = 0) when the production cost parameter scale . The optimum values for the price of new products, price of refurbished products, quality choice, quantity of new product production, production quantity of refurbished products, and manufacturer profit are as follows.
(ii) In the refurbishing outsourcing to third-party, the manufacturer performs partial refurbishing (λ = 0) when the production cost parameter scale . The optimum values for the price of new products, price of refurbished products, quality choice, quantity of new product production, production quantity of refurbished products, and manufacturer profit are as follows.
In the outsourcing refurbishing model to retailers, the manufacturer’s profit is derived from the revenue generated through the production of new products. Manufacturers produce new products and sell them to retailers. In this model, manufacturers exclusively make decisions regarding the quantity of new products to manufacture. Manufacturers also establish wholesale prices, which are the prices at which new products are sold to retailers for the purpose of refurbishing. On the other hand, retailers’ profits stem from the sales of both new products and refurbished products. The problems faced by the manufacturer and retailer can be outlined as follows:
The profit function represented by Equation (5) is subject to a single constraint, leading to two distinct cases: cases, and Through the utilization of Equations (3) and (4) and based on the underlying assumptions, we arrive at the formulation of the Lagrange function as follows:
In this context, the symbol denotes a Lagrange multiplier. The profit function is concave concerning the variables and , indicating the presence of a singular optimal solution. Consequently, we can establish the Karush-Kuhn-Tucker (KKT) optimality conditions as follows:
Based on Equations (49)-(52), the optimal values for and are computed for each scenario by applying the four Kuhn-Tucker conditions.
In the refurbishing outsourcing to retailers model there are two cases namely partial refurbishing when only part of the consumable product can be reprocessed into refurbished products (λ = 0) and full refurbishing when all consumable products can be reprocessed into refurbished products (λ > 0) so that there are two optimum solutions:
(i) In the refurbishing outsourcing to retailers, the manufacturer performs partial refurbishing (λ = 0) when the production cost parameter scale . The optimum values for the price of new products, price of refurbished products, quality choice, quantity of new product production, production quantity of refurbished products, and producer profit are as follows.
(ii) In the refurbishing outsourcing to retailers, the manufacturer performs partial refurbishing (λ = 0) when the production cost parameter scale . The optimum values for the price of new products, price of refurbished products, quality choice, quantity of new product production, production quantity of refurbished products, and producer profit are as follows.
In this section, our analysis will focus on investigating the equilibrium decisions within Models I, T, and R. Additionally, we will extend the scope of our research by incorporating considerations related to economic and environmental sustainability.
In Model I, Model T, and Model R the manufacturer produces and sells refurbished products ranging from
The profits earned by producers come from the sales of both new and refurbished products. Consequently, producers must sell a minimum of 0 new and refurbished products. In the case of in-house refurbishing, manufacturers produce and sell and new and refurbished products without the condition of the production cost parameter, . This demonstrates that the production cost parameter does not influence the quantity of products required for maximizing profits during the production and sale of both new and refurbished products. This condition similarly applies to refurbishing outsourcing to third parties and retailers. When it comes to producing and selling new and refurbished products, the production cost parameter does not impact the quantity of products that third parties and retailers need to produce to achieve maximum profit.
The optimum quantity of new product in Model T is higher than that in Model I and Model R with production cost parameter condition with
In refurbishing activities, manufacturers face competition from refurbished products. As a result, they tend to increase the production of new products to counteract this competition. In the context of outsourcing refurbishing activities to third parties, manufacturers strive to boost the production of new products to remain competitive with third-party providers. Conversely, in the in-house refurbishing model, even though there is competition between new and refurbished products, all operations are overseen by the manufacturers themselves, moderating competition for maximum profits. Similarly, in the refurbishing outsourcing model to retailers, the sale of both new and refurbished products is managed by retailers, resulting in reduced competition for profits.
The optimum quantity of refurbished product in Model T is higher than that in Model I and Model R with production cost parameter condition with
In this study, it is assumed that all new products can be reprocessed into refurbished products. However, there is , which is the proportion of the number of new products that can be processed into refurbished products or can be said there are constraints in the supply of consumable products. In accordance with Proposition 2 and Proposition 3, where the number of new products that , then the number of refurbished products because the higher the number of new products, the higher also refurbished products that can be produced.
Quality choice of new products in Model T is higher than that in Model I and Model R with production cost parameter condition .
In outsourcing refurbishing activities to third parties, the level of quality choice for new products is higher than in-house refurbishing and outsourcing refurbishing to retailers. This higher level of quality choice arises due to competition between third parties and manufacturers. Manufacturers enhance the quality of new products to enable them to compete effectively with refurbished products in the market. The presence of competition between manufacturers and third parties in product marketing results in a cannibalization effect. To mitigate the effects of cannibalization, manufacturers can increase the level of quality choice. As quality choice increases, both the price and quality of new products rise. Consequently, the price of high-quality refurbished products also increases. Some consumers prioritize quality when making purchase decisions, so increasing product quality can boost demand. In the outsourcing refurbishing model to retailers, the quality choice is determined by the manufacturer and remains the same as in the in-house refurbishing model. This is because in the outsourcing refurbishing model to retailers, producers exclusively sell to retailers, eliminating competition between producers and retailers for consumers.
The price of new products in Model I is lower than that in Model T and Model R under conditions of price elasticity with
Based on Proposition 5, it can be observed that both the outsourcing refurbishing model to third parties and the outsourcing refurbishing model to retailers feature higher prices compared to the in-house refurbishing model. This price disparity arises because third parties are obligated to pay licensing fees to manufacturers. Consequently, in order to turn a profit, third parties must raise the prices of new products. Additionally, in the outsourcing refurbishing model to retailers, despite manufacturers providing wholesale prices to retailers, the latter incur additional costs associated with the refurbishment process and marketing efforts for new or refurbished products. As a result, the overall costs incurred are higher.
The price of refurbished products in Model I is lower than that in Model T and Model R under conditions of price elasticity
Based on Propositions 5 and 6 it can be seen that the higher the price of new products, the higher the price of refurbished products. This is influential because the two prices are interconnected and the high price of new products causes high prices of refurbished products.
Manufacturer’s profits for Model I are higher than those for the Model T and Model R with production cost parameter condition .
In the in-house refurbishing model, the entire operation is under the producer’s control, allowing them to tailor the strategy for quantity and quality while effectively addressing the challenges of cannibalization. On the other hand, in the outsourcing refurbishing models to third parties and retailers, manufacturers delegate refurbishing operations to external entities, which can intensify the cannibalization effect and potentially foster competition between these parties. This increased competition can, in turn, result in reduced producer profits when engaging in outsourcing refurbishing activities, whether to third parties or retailers.
The profitability of manufacturer in Model I is higher than the combined profits of manufacturer and third-party in Model T and Model R ( with production cost parameter condition .
Based on Proposition 8, it can be observed that the profit of producers in the in-house refurbishing model exceeds the combined profits of producers and third parties in the outsourcing refurbishing model to third parties, as well as the combined advantages of manufacturers and retailers in the refurbishing model outsourcing to retailers. In the in-house refurbishing model, manufacturers obtain sales profits from both new and refurbished products. Conversely, in the outsourcing refurbishing model to third parties, sales are shared with third parties, intensifying the competition between new products and refurbished products. This heightened competition leads to a reduction in the quantity of new products and an increase in refurbished products due to the cannibalization effect. In the refurbishing model outsourcing to third parties, manufacturers impose license fees on third parties. However, the profits earned by third parties are not sufficiently high to cover the profits that should be earned by producers. Furthermore, in the refurbishing outsourcing model to retailers, manufacturers exclusively sell new products to retailers at reduced wholesale prices, while retailers sell both new and refurbished products to consumers. Similar to the outsourcing refurbishing model to third parties, cannibalization occurs, causing a decrease in the quantity of new products and an increase in refurbished products. The sales made by producers to third parties are naturally lower due to their wholesale pricing structure. Furthermore, the proceeds from retailer sales also fall short of covering the profits that manufacturers would otherwise receive.
The impact on the environment of the Model T is greater than that of Model I and Model R () with production cost parameter condition with
New products and refurbished products will have an impact on the environment. When carrying out refurbishing activities, it is not always beneficial for the environment. Even though refurbished products use less raw materials, when they reach above the threshold, the environmental impact of the product use phase in Model T is greater than Model I and Model R.
The application of the three refurbishing models that have been constructed and obtaining the optimum solution is to maximize profits. In this application, the product produced is an electronic product in the form of a laptop from Apple, namely the MacBook Pro Laptop M2. The consumer’s decision to buy refurbished products is 15.3 percent lower than new products, so it is assumed that there is a market potential when there are no refurbished products , and a market potential when there are refurbished products, namely . There is a production cost parameter. There are consumable product supply constraints, namely with . Furthermore, there is a proportion of the cost of refurbished products, namely and . In this study, it is assumed that the value of and . In market competition, there are two categories of consumers, namely high-end customers, namely consumers who only buy new products or refurbished products, and low-end customers, namely consumers who only buy refurbished products. Competition that occurs between new products and refurbished products causes cannibalization. The effect of cannibalization in this study was 2 and . In the outsourcing refurbishing model to a third party, the third party must pay a license fee of 500. Referring to Yan et al. [11 and . Following that, a graph depicting the difference in the variable values of the three models on the refurbishing costs is presented in Figures 2 to 7.
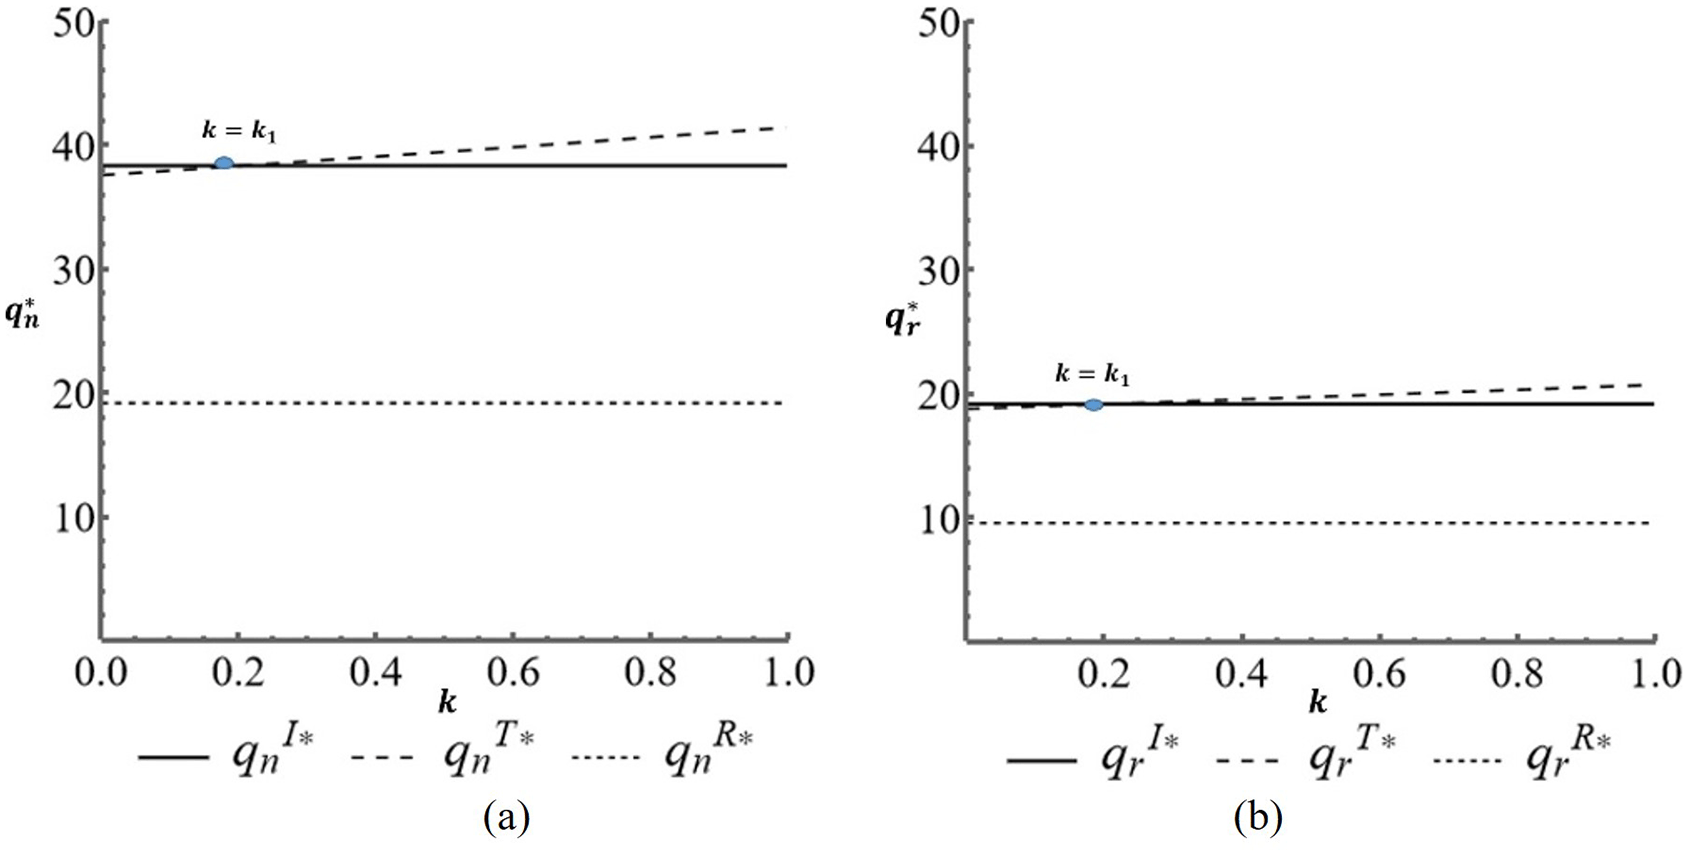
Figure 2(a) shows a comparison of the number of new products in the three models. Based on the figure, Model T shows that the greater the value of the production cost parameter , the greater the quantity of new products provided by producers. Whereas in Model I and Model R, an increase in the value of has no effect on the quantity of new products. In accordance with the Proposition 2, the figure shows that with the condition of the production cost parameter The intersection point in the figure shows the intersection of Model I and Model T, where the quantity of new products in Model T will be higher than Model I when the production cost parameter . The graph shows that the quantity of new product Model I is higher than Model R for all conditions of production cost parameter . Meanwhile, the quantity of new product Model T is higher than Model R for all conditions of production cost parameter .
Figure 2(b) shows a comparison of the number of refurbished products in the three models. Based on the figure, Model T shows that the greater the value of the production cost parameter , the greater the quantity of refurbished products provided by manufacturers. Whereas in Model I and Model R, the increase in the value of the production cost parameter has no effect on the quantity of refurbished products. According to Proposition 3, the figure shows that with the cost parameter condition The figure shows the intersection of Model I and Model T, where the quantity of refurbished products in Model T will be higher than Model I when . The graph shows that the quantity of refurbished products in Model I is higher than Model R for all conditions of the production cost parameter. Meanwhile, the quantity of refurbished products for Model T is higher than Model R for all conditions of production cost parameter .
Figure 3 is a graph showing the quality choices of Model I, Model T, and Model R. Based on the graph, the greater the value of , the greater the quality choice of each model decreases. The graphics also prove the Proposition 4 that when In the graph there is also an intersection point which shows that when the production cost parameter condition is

Comparison of new product prices in the three models is depicted in Figure 4(a). The figure shows that the higher the value of price elasticity , the lower the price of new products. This shows that when the price elasticity between the new product and the refurbished product is higher, the price of the new product decreases which then causes a decrease in the price of the refurbished product. The picture is proof of the Proposition 5 that with price elasticity that . Comparison of the price of refurbished products in the three models is depicted in Figure 4(b). The figure shows that the higher the price elasticity, the lower the price of refurbished products. This shows that when the price elasticity is between new products and refurbished products, the price of refurbished products falls. This assumption relates to the price of a new product where when the value of increases, the price of the new product decreases. The figure is a proof of Proposition 5 that with price elasticity that .

The profit obtained by the producers in the three models is presented in Figure 5(a). Based on the figure, the higher the value of the production cost parameter , the lower the manufacturer’s profit. The graph proves Proposition 7. The production cost parameter value contained in the graph is the intersection point which proves that with condition . The combined gains obtained in the three models are presented in Figure 5(b). Based on this figure, the higher the value of the production cost parameter , the lower the producer’s profit. The graph illustrates Proposition 8. The production cost parameter value contained in the graph is the intersection point which proves thatwith condition.
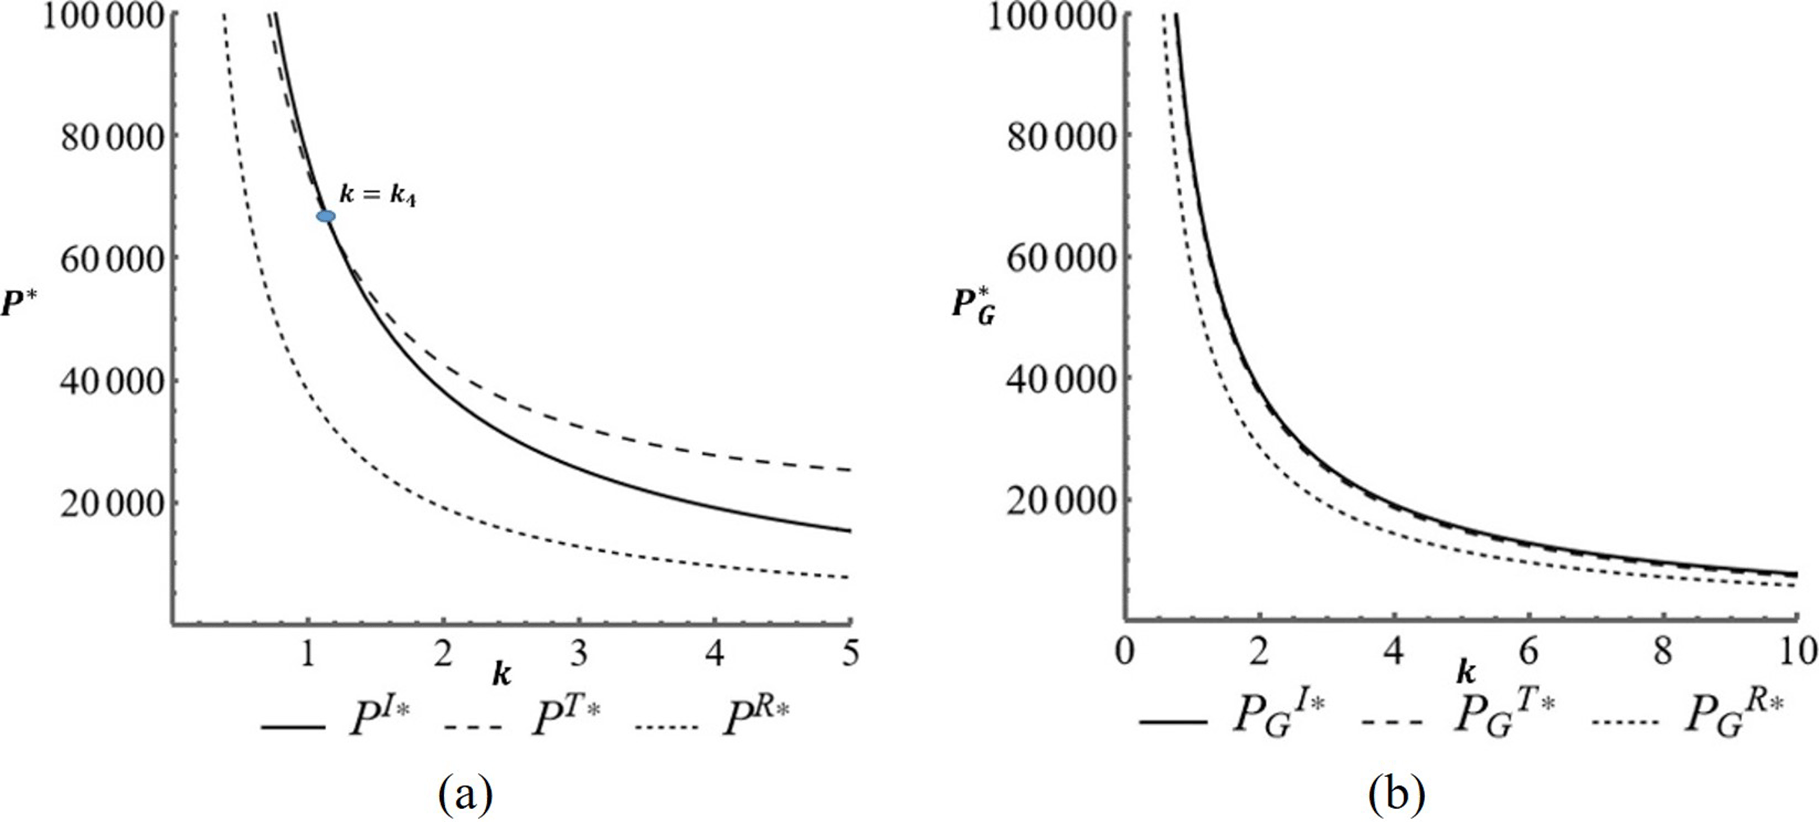
The impact on the environment caused by refurbishing activities depends on the number of new and refurbished products available. The environmental impacts of Model I, Model T, and Model R are presented in Figure 6. The figure illustrates Proposition 9 that . The intersection point on the graph shows the condition of the production cost parameter resulting in where the impact on the environment in Model T will be higher than Model I when . The graph shows that the environmental impact of Model I is higher than Model R for all conditions of the production cost parameter . Meanwhile, the impact on the environment model T is higher than Model R for all production cost parameter conditions . Model T shows that the greater the value of the production cost parameter , the greater the impact on the environment. Whereas in Model I and Model T, the increase in the value of the production cost parameter has no effect on the impact on the environment.

In this section, the parameter value of the potential market for refurbished products (), the demand for high-end customers when there are no refurbished products (), the parameter of production costs (k), the coefficient cannibalization (), price elasticity (), and the proportion of refurbished product production costs to new product production costs () will be changed. This is done to determine how changes in parameter values affect the choice variable in the profit function.
Changes in market potential include variations in product quantity, price, quality choices, and producer’s profits.
Based on the graphs in Figures 7(a) and 7(b), it can be observed that an increase in the potential market for refurbished products leads to an increase in the quantities of both new and refurbished products. Figure 7(a) illustrates the increase in new products when there is a change in the potential market for refurbished products. The quantity of new products in Model I has risen from 26.19 to 40.47, with an average increase of 0.54%. In Model T, the quantity of new products increased from 32.90 to 43.06, with an average increase of 0.3%, while in Model R, the quantity of new products increased from 13.09 to 20.20, with an average increase of 0.54%. In line with the increasing quantity of new products, the quantity of refurbished products has also risen, as shown in Figure 7(b). The quantity of refurbished products in Model I increased from 13.09 to 20.23, with an average increase of 0.54%. Model T saw an increase in the quantity of refurbished products from 16.45 to 21.53, with an average increase of 0.3%, while Model R experienced an increase in the quantity of refurbished products from 6.54 to 10.10, with an average increase of 0.54%.

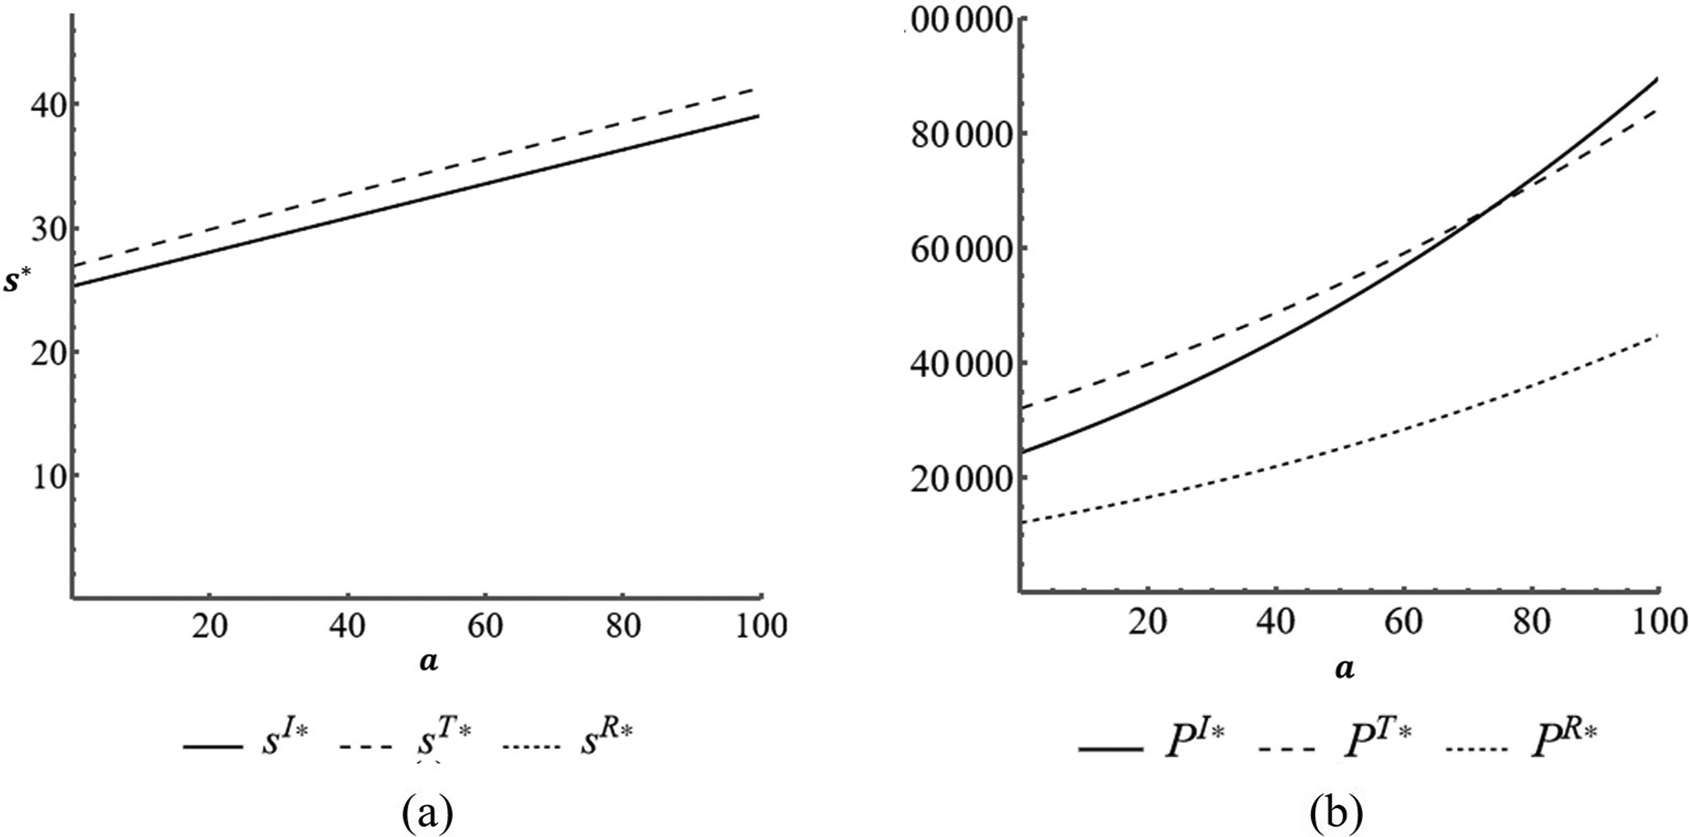
Figure 7(c) depicts the increase in the prices of new products in response to changes in the potential market for refurbished products. The price of new products in Model I rose from $1547.35 to $3340.45, marking an average increase of 1.15%. In Model T, the price of new products increased from $1447.48 to $3414.09, with an average increase of 1.35%. Model R experienced a rise in the price of new products from $1911.6 to $4210.45, reflecting an average increase of 1.2%. Moving on to Figure 7(d), it illustrates the increase in the prices of refurbished products in response to changes in the potential market for refurbished products. The price of refurbished products in Model I increased from $614.12 to $2,177.34, averaging a 2.5% increase. In Model T, the price of refurbished products rose from $544.96 to $2,237.83, with an average increase of 3.1%. Model R witnessed an increase in the price of refurbished products from $812.80 to $2,651.89, with an average increase of 2.2%.
The increase in market potential for refurbished products also results in a more significant increase in product quality choice. Figure 8(a) illustrates the increase in quality choice observed when there is a change in the potential market for refurbished products. In Model I and Model R, quality choice increased from 25 to 39, averaging a 0.56% increase. In Model T, quality choice rose from 26 to 41, with an average increase of 0.57%. Figure 8(b) demonstrates the increase in producer profits experienced when there is a change in the market potential for refurbished products. Producer profits in Model I rose from $24,283.9 to $89,636.9, marking an average increase of 2.6%. In Model T, producer profits increased from $32,040.6 to $84,272.5, with an average increase of 1.6%. Meanwhile, Model R experienced an increase in profits from $12,141.9 to $44,818.5, averaging a 2.6% increase.
The substantial volume of high-end customer requests in the absence of refurbished products (q) significantly influences quantity, price, quality choice, and producer profits.
Figures 9(a) and (b) illustrate the impact of high-end demand on the quantity of new and refurbished products. In Figure 9(a), it is evident that a higher level of high-end demand corresponds to an increased quantity of new products. For instance, in Model I, the quantity of new products rises from 25.2 to 51.4, averaging a 1.03% increase. Similarly, in Model T, the quantity of new products increases from 30.6 to 53.9, with an average increase of 0.76%. Model R also experiences an increase from 12.6 to 25.7 in the quantity of new products, representing an average increase of 1.03%. Figure 9(b) demonstrates that as high-end demand increases, so does the quantity of refurbished products. For Model I, there is an increase from 12.6 to 25.7, averaging a 1.03% rise. Model T shows a shift from 15.3 to 26.9, with an average increase of 0.76%. Meanwhile, Model R records an increase from 6.3 to 12.85, with an average increase of 1.03%.

Figure 10(a) illustrates that a higher value of high-end demand corresponds to higher prices for new products. Specifically, in Model I, the price of new products increases from $1248.56 to $5582.66, with an average price increase of 3.4%. In the Model T, it rises from $1026.49 to $6008.93, representing an average increase of 4.8%. Meanwhile, Model R experiences a price increase from $1586.81 to $6987.19, with an average increase of 3.4%. In Figure 10(b), it is evident that an increase in the value of high-end demand leads to higher prices for refurbished products. For Model I, prices increase from $946,864 to $3135.37, averaging a 2.3% increase. In the Model T, prices rise from $807,051 to $3377.26, with an average increase of 3.1%. Similarly, Model R sees prices increase from $1131.36 to $3901.48, representing an average increase of 2.4%. These price fluctuations are influenced by changes in high-end demand.

Figure 11(a) illustrates the increase in quality choice that occurs when there is a change in the value of high-end demand. Quality choice for new products in both Model I and Model R increases from 24 to 49, with an average increase of 1.04%. In the Model T, quality choice rises from 22 to 54, representing an average increase of 1.4%. Meanwhile, Figure 11(b) demonstrates the increase in producer profits that results from changes in high-end demand. In Model I, manufacturer profits increase from $21,729.9 to $183,866, reflecting an average increase of 7.4%. In the Model T, manufacturer profits rise from $23,376.2 to $175,664, with an average increase of 6.5%. Model R experiences a profit increase from $10,865 to $91,933, indicating an average increase of 7.7%. These changes in quality choice and profits are driven by shifts in high-end demand.

The production cost parameter (k) has a significant impact on the prices of both new and refurbished products.
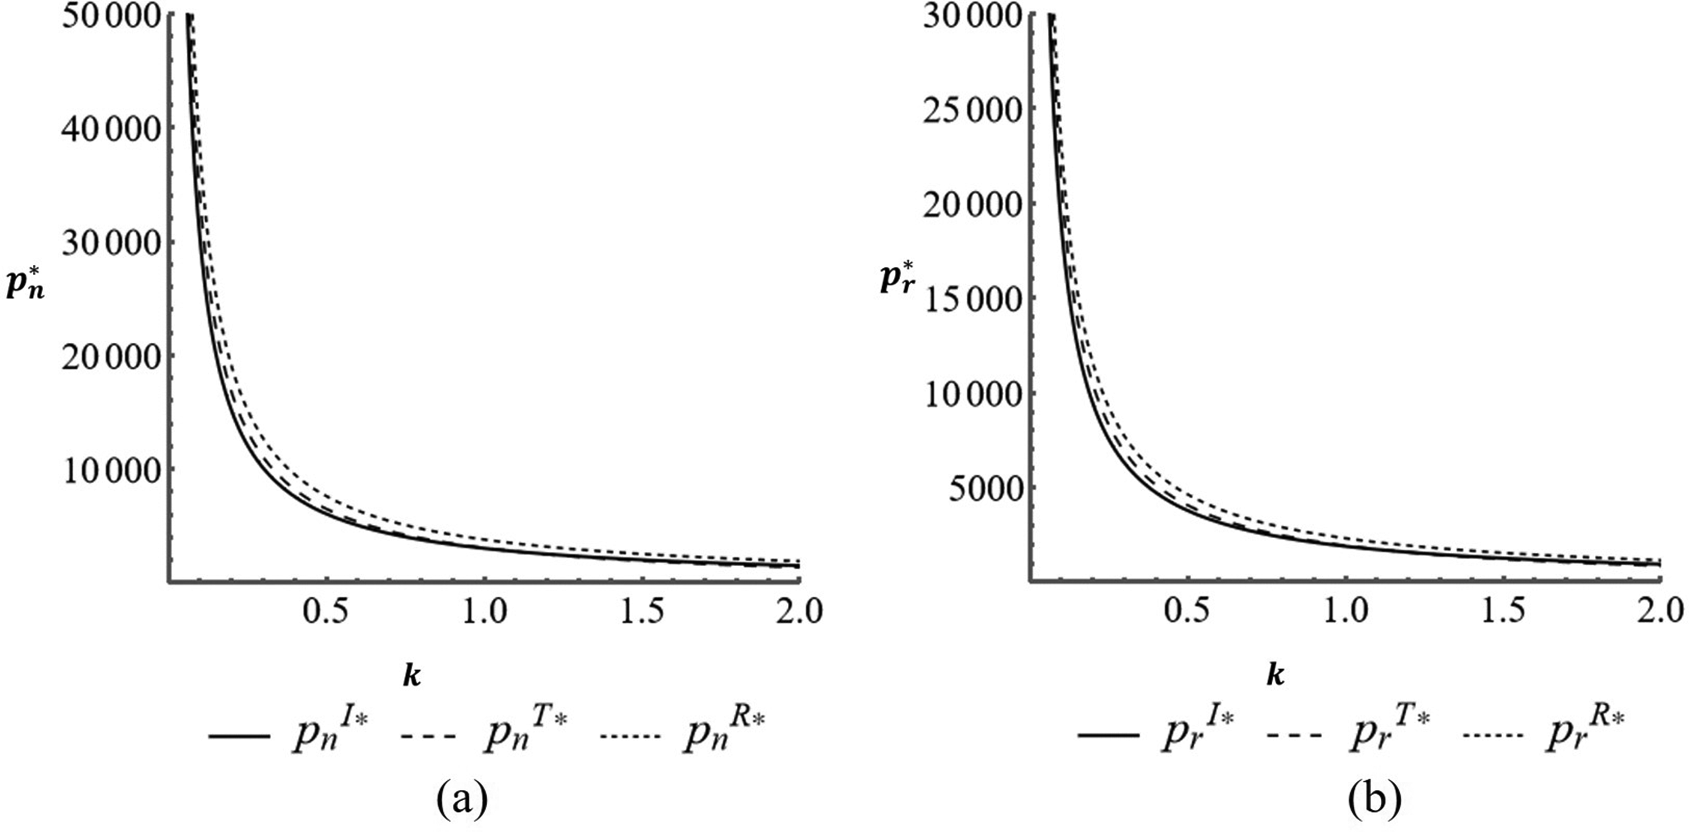
Figure 12(a) illustrates that as the production cost parameter’s value increases, the price of new products decreases. The graph covers a range of values from 0 to 2 for the production cost parameter. Starting at a production cost parameter of 0.1 and increasing to 2, the price of new products in Model I decreased from $30,287.7 to $1,514.39, with an average decrease of 0.9%. In the Model T, the price of a new product decreased from $33,834.7 to $1,354.6, averaging a 0.9% decrease. The Model R saw a decrease from $38,091 to $1,904.55, with an average drop of 0.95%. Figure 12(b) indicates that with higher production cost parameter values, the price of refurbished products decreases. In Model I, it dropped from $18,875.9 to $943.79, with an average drop of 0.95%, as the production cost parameter ranged from 0.1 to 2. In the Model T, the price of refurbished products decreased from $21,072.7 to $855.98, averaging a 0.95% drop. The Model R experienced a price reduction from $23,132.2 to $1,156.61, with an average depreciation of 0.95%.
Changes in price elasticity (l) lead to alterations in product quantity, price, quality choice, and producer’s profits.
Figure 13(a) illustrates how an increase in price elasticity affects the quantity of new products. When the price elasticity increases from 1 to 10, the quantity of products in Model I decreases from 39.6 to 35.7, with an average decrease of 0.09%. In Model T, an increase in price elasticity leads to an increase in the quantity of new products, with new products in Model T increasing from 40.24 to 49 at an average increase of 0.2%. However, in Model R, the quantity of new products decreased from 19.8 to 17.8, with an average decrease of 0.1%. This trend is mirrored in the quantity of refurbished products, as shown in Figure 13(b). In Model I, the quantity of refurbished products decreased from 19.8 to 17.8, with an average decrease of 0.1%. In Model T, the quantity of refurbished products increased from 20.12 to 24.5, with an average increase of 0.2%. Meanwhile, in Model R, the quantity of refurbished products decreased from 9.9 to 8.9, with an average decrease of 0.1%.

Figure 13(c) demonstrates the decrease in quality choice when there is a change in price elasticity. Quality choice for new products in Model I and Model R decreased from 75 to 17, with an average decrease of 0.7%. In Model T, quality choice decreased from 77 to 18, also with an average decrease of 0.7%. Figure 13(d) shows the decline in producer profits when there is a change in price elasticity. Manufacturer’s profits in Model I decreased from $326,264 to $16,558.9, with an average decrease of 0.9%. In Model T, manufacturers’ profits decreased from $250,257 to $28,704.6, with an average decrease of 0.8%. Meanwhile, Model R experienced a decrease in profits from $163,132 to $8,279.45, with an average decrease of 0.9%.
Changes in the cannibalization coefficient (b) have an impact on product quantity, price, quality choice, and producer’s profits.
Figure 14(a) illustrates the impact of the cannibalization coefficient on the quantity of new products. When the value of the cannibalization coefficient increases from 1 to 10, the quantity of new products in Model I increases from 37 to 40 with an average increase of 0.08%. In Model T, it also increases from 38 to 49.6 with an average increase of 0.3%. Meanwhile, Model R experiences an increase from 18.5 to 20 with an average increase of 0.08%. This demonstrates that a higher cannibalization coefficient leads to a greater quantity of new products being produced. In line with the increase in new products, refurbished products also see an increase, as shown in Figure 14(b). The image illustrates the changes caused by the increase in the cannibalization coefficient on the quantity of refurbished products. Model I experiences an increase from 18.5 to 20 with an average increase of 0.08%. In Model T, it also increases from 19 to 24.8 with an average increase of 0.3%. Whereas in Model R, the quantity of refurbished products has increased from 9.25 to 10 with an average increase of 0.08%.

Figure 14(c) reveals that the higher the value of the cannibalization coefficient, the lower the price of new products. Model I’s price decreased from $5567.1 to $1551.21 with an average decrease of 0.7%. Model T’s price decreased from $6390.32 to $1211.74 with an average decrease of 0.8%. The Model R’s price decreased from $7003.55 to $1943.88, reflecting an average drop of 0.7%. Figure 14(d) shows that the higher the cannibalization coefficient, the lower the price of refurbished products. Model I’s price decreased from $2512.09 to $1385.24 with an average decrease of 0.4%. The Model T’s price decreased from $2890.97 to $1087.87, indicating an average drop of 0.6%. Meanwhile, the Model R’s price decreased from $3050.76 to $1721.82, with an average decrease of 0.4%. Based on this analysis, the cannibalization coefficient in this study did not reduce the quantity of new products. Consumer demand for new products is also influenced by the price of new products. It can be seen that with an increase in the cannibalization coefficient, the price of new products decreases, potentially leading to an increase in demand for new products.
Figure 15(a) illustrates that the quality choice of Model I and Model R decreased from 48 to 27 with an average decrease of 0.4%. On the Model T, quality choice fell from 56 to 24 with an average decrease of 0.5%. Figure 15(b) shows that producer profits on Model I fell from $126,288 to $45,250.6 for an average decrease of 0.6%. On the Model T, manufacturers’ profits fell from $131,236 to $42,513.7 for an average decrease of 0.6%. Meanwhile, the Model R experienced a decrease in profits from $63,144 to $22,675.3 with an average decrease of 0.6%.

Based on the results of the sensitivity analysis, it was found that maximizing producer profits can occur when both market potential and high-end demand increase. However, producer profits will increase as the price elasticity decreases. Reducing the cannibalization coefficient can also lead to an increase in producer profits. This can be interpreted as follows: when fewer consumers switch to refurbished products, producers stand to gain greater profits. Moreover, producer profits can be augmented by maintaining a lower proportion of costs and a reduced supply of consumable products. This condition is applicable to all models, including Model I, Model T, and Model R. Model I, in particular, exhibits higher producer profits when there are changes in parameter values, while Model R shows the lowest producer profits when such changes occur.
In this comprehensive study, we have thoroughly examined and compared three distinct refurbishing models: in-house refurbishing (Model I), refurbishing outsourcing to third parties (Model T), and refurbishing outsourcing to retailers (Model R). Our rigorous mathematical modeling and optimization techniques have allowed us to pinpoint the optimal configurations for each model, optimizing profits across varying parameters, including product quantities, quality selections, and pricing tactics. Our findings have highlighted that the in-house refurbishing model tends to yield higher profits for companies primarily driven by profit motives, whereas the outsourcing refurbishing model to retailers aligns effectively with environmental sustainability objectives. Furthermore, our research has incorporated critical factors such as the constrained supply of manufacturable products and consumer behavior, particularly focusing on the preferences of high-end and low-end customers.
Looking ahead, future investigations within this domain could take a more intricate approach by delving deeper into the complexities of multi-segment cannibalization demand models. This exploration could shed light on how market segmentation influences optimal strategies and sustainability considerations for refurbishing models. Additionally, analyzing the influence of evolving consumer preferences and external market dynamics on these refurbishing models may offer invaluable insights for decision-makers within the manufacturing industry. This avenue of research holds the potential to enhance the adaptability and resilience of refurbishing strategies in an ever-changing market landscape.
| Views | Downloads | |
|---|---|---|
| F1000Research | - | - |
|
PubMed Central
Data from PMC are received and updated monthly.
|
- | - |
Provide sufficient details of any financial or non-financial competing interests to enable users to assess whether your comments might lead a reasonable person to question your impartiality. Consider the following examples, but note that this is not an exhaustive list:
Sign up for content alerts and receive a weekly or monthly email with all newly published articles
Already registered? Sign in
The email address should be the one you originally registered with F1000.
You registered with F1000 via Google, so we cannot reset your password.
To sign in, please click here.
If you still need help with your Google account password, please click here.
You registered with F1000 via Facebook, so we cannot reset your password.
To sign in, please click here.
If you still need help with your Facebook account password, please click here.
If your email address is registered with us, we will email you instructions to reset your password.
If you think you should have received this email but it has not arrived, please check your spam filters and/or contact for further assistance.
 in the § just before equation 3.
 and a
and a are not taken into account!
Comments on this article Comments (0)