Keywords
activities of daily living, geriatric assessment, mortality, prognosis, forecasting, Kaplan-meier estimate, proportional hazards models
activities of daily living, geriatric assessment, mortality, prognosis, forecasting, Kaplan-meier estimate, proportional hazards models
Risk prediction models are increasing being developed within the healthcare space1,2 for a variety of purposes including, for example, to predict an individual’s life expectancy, support the diagnosis of disease, or estimate the risk of experiencing adverse outcomes. This is largely due to the growth in the availability of routinely collected healthcare data as well as innovations in machine learning,3 which have led to increasingly complex models with potentially improved predictive accuracy.2 In clinical care settings, prediction models can be used to support clinical decision-making and ensure care is aligned with patients’ needs, preferences and goals.4 For policy makers, prediction models can also be used to forecast population-level needs and inform health system planning.5
Despite the number of available prognostic indices, few have been widely adopted into clinical practice6 and only a minority have been evaluated for their impact on clinical outcomes, including patient benefit.2,7,8 A variety of barriers continue to hinder adoption and evaluation, including the lack of model validation studies as well as failure to revise and update previously developed models.9 Model validation is a process that seeks to assesses a model’s performance and generalizability.10 Validation is necessary prior to considering model implementation into clinical practice. Likewise, regular re-assessments of model performance are needed to account for changes in, for example, patients’ characteristics, outcome prevalence, and health policies. Despite this, once a model has been developed, revisions are rare as are subsequent validation exercises.11
The Risk Evaluation for Support: Predictions for Elder-life in their Communities Tool (RESPECT) is a risk communication tool powered by a prediction algorithm that estimates an older adults’ risk of death within 6 months.12 RESPECT is presently used in home and community settings in Ontario, Canada, to support earlier identification of palliative care needs among older community-dwelling individuals, goals of care conversations, and health system planning. It is also available as a web calculator on ProjectBigLife.ca. RESPECT was initially developed and validated using routinely collected Resident Assessment Instrument for Home Care (RAI-HC) data in Ontario between 2007 and 2013. However, with the introduction of a new comprehensive assessment instrument within home and community care across the province in 2018—the interRAI Home Care (interRAI HC) Assessment System—an updated algorithm is required to support continued use of RESPECT. The objective of this study was to re-estimate and validate RESPECT in contemporary interRAI HC data.
Since 2004, the care needs of home care clients expected to require at least 60 days of service (i.e. long-stay clients) have been determined using the RAI-HC, a standardized, multi-dimensional assessment instrument that contains information across a variety of elements including sociodemographic information, cognitive and functional capacities, chronic diseases and comorbidities, and signs of health instability, as well as recent use of health care.13–15 In April 2018, the RAI-HC was replaced by interRAI HC, an updated version of the assessment instrument that contains similar data elements.16 RESPECT was initially developed and validated using RAI-HC data between 2007 and 2013. To estimate the 6-month mortality risk in a contemporary cohort, we validated and assessed RESPECT in the interRAI HC data collected between April 1, 2018 and September 30, 2019.
Record-level interRAI HC data was linked to other provincial health administrative databases housed and analyzed at ICES. ICES is an independent, non-profit research institute whose legal status under Ontario’s health information privacy law allows it to collect and analyze health care and demographic data, without consent, for health system evaluation and improvement.
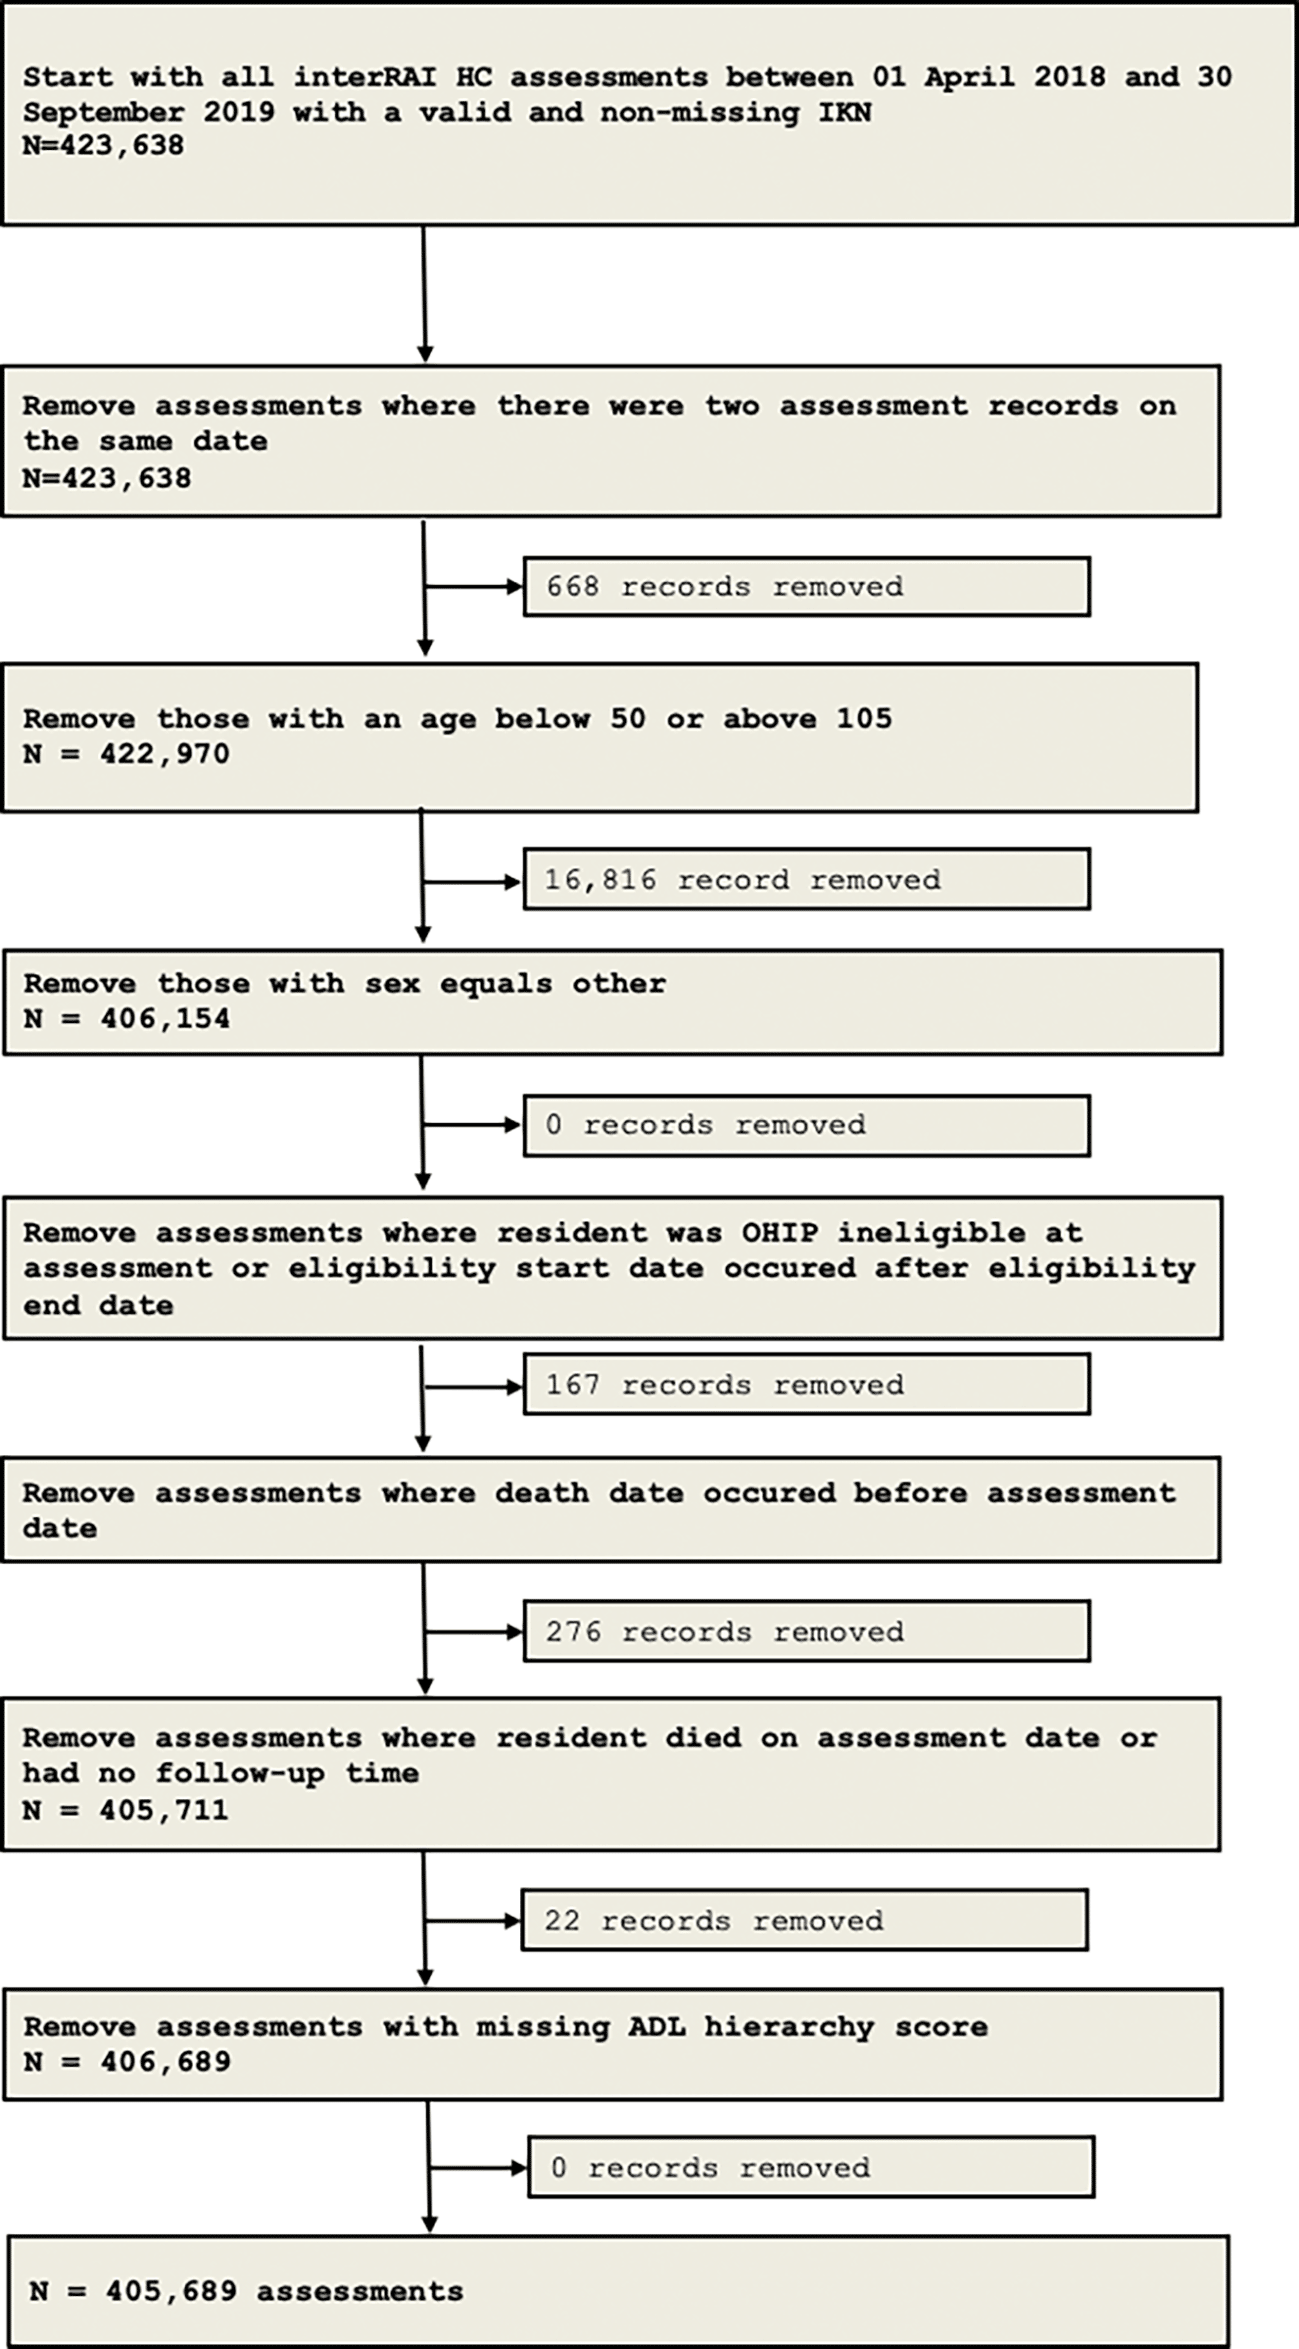
The model derivation cohort consisted of adults aged 50 years or older who were eligible for publicly funded home care in Ontario and received at least interRAI HC assessment between April 1, 2018 and September 30, 2019. Assessments with missing information on sex and dependence across activities of daily living (ADLs) were excluded. The exclusion criteria applied to create our study cohort are presented in Figure 1. The internal validation cohort comprised 500 bootstrapped samples, each containing a random selection, with replacement, of 5% of the total cohort.
The primary outcome was death within 6 months of an interRAI HC assessment. The Registered Persons Database, a registry of health card numbers that have been issued under the Ontario Health Insurance Plan to all eligible residents of Ontario, was used to ascertain death date.
All predictors in the original RESPECT model12 were included unless the variable was not available in the interRAI HC instrument. Predictors include measures of physical function (dependence in ADLs or instrumental ADLs [IADLs], and worsening ADLs); cognitive impairment (worsening decision-making capacity); sociodemographic factors (age, sex at birth); diseases (stroke, congestive heart failure [CHF], coronary heart disease [CHD], Alzheimer’s disease and other dementias, multiple sclerosis, Parkinson’s disease, cancer, chronic obstructive pulmonary disease [COPD]); healthcare use (number of hospital admissions or emergency department visits in the last 90-days); symptoms of reduced health (vomiting, edema, dyspnea, low fluid intake, weight loss, decrease in food or fluid consumption); prescription and receipt of life-sustaining therapies/treatments (chemotherapy, dialysis, oxygen therapy, ventilator or respirator); and clinician diagnosis of an end-stage disease. Missing data on a predictor was considered as not present with the exception of worsening ADLs and worsening decision-making capacity. Other cohort characteristics (i.e., the year that the interRAI HC assessment was performed and the reason for assessment) were also included to account for remaining heterogeneity and temporal trends. Predictors in the original RESPECT model that were not available in the interRAI HC data and, therefore, not included in the re-estimated model are as follows: education, hypertension, asthma, emphysema, renal failure, and any interactions with at least one of the aforementioned variables. In total, there were 27 predictors with 51 degrees of freedom in the final model. All predictors were specified as categorical variables except for age, which was modelled using a restricted cubic spline with five knots, placed at the 5th, 27.5th, 50th, 72.5th and 95th percentiles of the age distribution.
We estimated a Cox proportional hazards regression predicting death within 6 months of an interRAI HC assessment. All assessments performed between April 1, 2018 and September 30, 2019, were included and follow-up was censored by death or end of follow-up (i.e., 6 months after the assessment date). A robust sandwich variance estimator was used to account for within-subject correlations given the possibility of multiple assessment records for individual home care users within the study period.
For model validation, bootstrap sampling with replacement was performed. We generated 500 bootstrapped samples, each containing a random selection of 5% of the total cohort. Then, coefficients from the derivation model were applied to the validation cohort to estimate the 6-month predicted mortality risk. Predictive performance was assessed in the validation cohort using two predictive accuracy measures, discrimination and calibration. Discrimination was assessed using the c statistic. Calibration was assessed for the overall model as well as across all predictors by comparing predicted risk of death at 6 months and observed risks that were derived from Kaplan-Meier estimates of the survival function.
To create risk bins, we first examined the median survival across percentiles. To estimate the median survival of individuals who survived past 6 months, we extended the follow-up period for each assessment to the most recent data available at the time of this study (i.e., June 29, 2022). Then, bins were constructed based on recommendations of clinical experts who identified meaningful differences in life expectancies that would be helpful in decision-making. This resulted in the creation of 61 risk bins. As the bin number increases, the 6-month mortality risk decreases and median survival increases (Table 1). Between bins, the incremental increase in median survival varies. For example, the incremental increase in median survival for bins 1-5 (i.e., individuals with high mortality risks) is approximately 3 weeks, while increases in median survival for bins 56-61 (i.e. individuals with a lower mortality risk) is greater than 2 months. Sample sizes for each risk group, their predicted 6-month mortality risk and median survival are presented in Table 1. See Table 2 for derivation of RESPECT Risk Score and Bin.
| I. Formula for deriving RESPECT risk score Using the final model coefficients presented in Table 5, the RESPECTScore can be calculated using the following formula: RESPECTScore = (βAge_RCS1 * Age_RCS1) + (βAge_RCS2 * Age_RCS2) + (βAge_RCS3 * Age_RCS3) + (βAge_RCS4 * Age_RCS4) + (βMale * Male) + (βStroke * Stroke) + (βCHF * CHF) + (βCHD * CHD) + (βAlzheimer or Dementia * AlzheimerorDementia) + (βMS * MS) + (βParkinson * Parkinson) + (βIADL_1 * IADL_1) + (βIADL_2 * IADL_2) + (βIADL_3 * IADL_3) + (βIADL_4 * IADL_4) + (βIADL_5 * IADL_5) + (βIADL_6 * IADL_6) + (βADL_1 * ADL_1) + (βADL_2 * ADL_2) + (βADL_3 * ADL_3) + (βADL_4 * ADL_4) + (βADL_5 * ADL_5) + (βADL_6 * ADL_6) + (βWorsening_ADL * Worsening_ADL) + (βWorsening_Cognition * Worsening_Cognition) + (βSymptoms_Vomiting * Symptoms_Vomiting) + (βSymptoms_Edema * Symptoms_Edema) + (βSymptoms_Dyspnea * Symptoms_Dyspnea) + (βSymptoms_WeightLoss * Symptoms_WeightLoss) + (βSymptoms_DecrsConsumption * Symptoms_ DecrsConsumption) + (βSymptoms_InsufficientFluid * Symptoms_ InsufficientFluid) + (βTerminalIllness * TerminalIllness) + (βCOPD0_OxygenTherapy1_int * COPD0_OxygenTherapy1_int) + (βCOPD1_OxygenTherapy0_int * COPD1_OxygenTherapy0_int) + (βCancer1_Chemo1_int * Cancer1_Chemo1_int) + (βCancer0_Chemo1_int * Cancer0_Chemo1_int) + (βHospitalization1 * Hospitalization1) + (βHospitalization2 * Hospitalization2) + (βHospitalization3 * Hospitalization3) + (βED1 * ED1) + (βED2 * ED2) + (βED3 * ED3) + (βAssessmentTyp_Other * AssessmentTyp_Other) + (βAssessmentTyp_Routine * AssessmentTyp_Routine) + (βAssessmentTyp_DischargeAss * AssessmentTyp_DischargeAss) + (βAssessmentTyp_HealthChange * AssessmentTyp_HealthChange) + (βAssessmentYr_2019 * AssessmentYR_2019) For the restricted cubic spline function with j = 1, …, k knots, its components can be derived using: Age_RCS1 = X (the centred value for age) and Reference: Harrell FE. Biostatistical Modeling. http://biostat.mc.vanderbilt.edu/wiki/pub/Main/BioMod/notes.pdf. Published June 1, 2004. Accessed July 25, 2020. Legend:
II. RESPECT risk bins Using the RESPECTScore, patients are placed into 1 of 61 risk bins. These bins were created to reflect incremental increases in median survival. Thresholds ranged from 0.2 percentile in the highest risk bins (bins 1-5) up to 2.5 percentiles in moderate-to-low risk bins (22-45). |
The derivation cohort comprised of 247,377 community-dwelling older adults who used home care during our study period (Table 3). They contributed to a total of 405,689 interRAI HC assessments, covering 822,051.47 person-years (PYs) of follow-up. The median number of interRAI HC assessments performed per adult was 1 (interquartile range [IQR] 1-2), with a maximum of 10 assessments. Within 6 months of assessment, 35,497 (14.35%) of home care users died and 42,515 (10.48%) of assessments were associated with a death within 6 months. The validation cohort consisted of 5% of the derivation cohort, resulting in 500 boostrapped samples with an average of 19,255.02 interRAI HC assessments and 41,105.61 PYs of follow-up per sample. The median number of assessments per adult in each sample was 1 (IQR 1-1) with a maximum of 3.91 visits per person. Within 6 months of an interRAI HC assessment, an average of 20,058 (10.69%) of home care users died and 2,128.77 (10.49%) of assessments were associated with a death within 6 months. No assessments were excluded due to missing data on predictors included in the model (see Figure 1 for cohort creation).
| Derivation Cohort | Validation Cohort | |
|---|---|---|
| N=247,377 | N=19,255.02 | |
| Cohort definition | ||
| Start Date | 01-Apr-18 | 01-Apr-18 |
| End Date | 30-Sep-19 | 30-Sep-19 |
| Six-month mortality | ||
| # of deaths (assessments) (6 months) | 42,515 (10.48%) | 2,128.77 (10.49%) |
| # of deaths (person) (6 months) | 35,497 (14.35%) | 2,058.07 (10.69) |
| No. of assessments | ||
| # of assessments (total) | 405,689 | 20,285 |
| # of assessments per patient (Q1) | 1.00 | 1.00 |
| # of assessments per patient (median) | 1.00 | 1.00 |
| # of assessments per patient (Q3) | 2.00 | 1.00 |
| # of assessments per patient (minimum) | 1.00 | 1.00 |
| # of assessments per patient (maximum) | 10.00 | 3.91 |
| Follow-up time (between assessment date and death, censored or end-of-study) | ||
| 6m follow-up time in person-months (total) | 2,300,037.23 | 57,501,282.33 |
| 6m follow-up time in person-months (median) | 6.00 | 6.00 |
| 6m follow-up time in person-months (Q1) | 6.00 | 6.00 |
| 6m follow-up time in person-months (Q3) | 6.00 | 6.00 |
| Follow-up time* | ||
| Follow-up time in person-years (total) | 822,051.47 | 41,105.61 |
| Follow-up time in person-years (Q1) | 1.43 | 1.43 |
| Follow-up time in person-years (median) | 2.24 | 2.24 |
| Follow-up time in person-years (Q3) | 2.73 | 2.73 |
A summary of characteristics of home care clients included in this study is provided in Table 4. In the derivation cohort, the mean (SD) age was 80.5 (10.8) years at the time of assessment and the majority of patients were female (61.9%). Alzheimer disease or other dementias was the most prevalent of the included comorbidities (33.4%) followed by coronary heart disease (30.4%) and stroke (17.0%). Other comorbidities included in the model (coronary heart failure, multiple sclerosis, Parkinson’s, cancer and chronic obstructive pulmonary disease [COPD]) had a prevalence of less than 15%. The most common symptoms of health instability reported were dyspnea (43.0%) and edema (34.7%). Other symptoms had a prevalence of less than 11%. Only 1.7% and 1.6% of patients received chemotherapy or dialysis, respectively, while 5.1% received oxygen, ventilator or respirator. A small proportion (2.3%) of home care patients had a prognosis of having fewer than 6 months to live and most did not have an inpatient admission (68.8%) or emergency department visit (75.8%) over the past 90 days. A significant proportion of the home care users (77.9%) required extensive assistance (score of at least 4) in performing IADLs (i.e., preforming ordinary housework, meal preparation or using the phone). A smaller proportion (18.0%) required extensive assistance (score of at least 4) in performing ADLs (i.e., maintaining personal hygiene, using the toilet, locomotion and eating). However, nearly half (49.3%) had reported worsening capacity to perform ADLs and more than a quarter (27.7%) reported worsening decision-making capacity. The majority of interRAI HC assessments were first assessments (58.9%) and were in 2019 (53.8%). The derivation and validation cohorts are comparable across all baseline characteristic (Table 4).
| Derivation Cohort, N (%) | Validation Cohort, %1 | |
|---|---|---|
| Characteristic | N=405,689 | N=20,285 |
| Age (Mean ± SD) | 80.5 ± 10.8 | 80.5 |
| Sex | ||
| Female | 251,098 (61.9%) | 61.9 |
| Male | 154,591 (38.1%) | 38.1 |
| Diseases | ||
| Stroke | 69,062 (17.0%) | 17.0 |
| Congestive heart failure (CHF) | 58,188 (14.3%) | 14.3 |
| Coronary heart disease (CHD) | 123,329 (30.4%) | 30.4 |
| Alzheimer disease or other dementias | 135,508 (33.4%) | 33.4 |
| Multiple sclerosis | 5,613 (1.4%) | 1.4 |
| Parkinson’s | 21,688 (5.3%) | 5.3 |
| Cancer | 57,510 (14.2%) | 14.2 |
| Chronic obstructive pulmonary disease (COPD) | 59,643 (14.7%) | 14.7 |
| Clinician diagnosis of an end stage disease | 9,499 (2.3%) | 2.3 |
| Signs and symptoms of health instability | ||
| Vomiting in at least 2 of the last 3 days | 2,105 (0.5%) | .5 |
| Edema in at least 1 of the last 3 days | 140,925 (34.7%) | 34.8 |
| Dyspnea (shortness of breath) | 174,284 (43.0%) | 43.0 |
| Fluid intake less than four 8 oz cups per day (or less than 1000 cc per day) in last 3 days | 22,969 (5.7%) | 5.7 |
| Weight loss of > 5% in the last 30 days or > 10% in the last 180 days | 41,946 (10.3%) | 10.4 |
| Decrease in amount food or fluid usually consumed | 32,596 (8.0%) | 8.0 |
| Receipt of life-sustaining treatments or therapies | ||
| Chemotherapy2 | 6,740 (1.7%) | 1.7 |
| Dialysis2 | 6,476 (1.6%) | 1.6 |
| Oxygen therapy, ventilator or respirator2 | 20,488 (5.1%) | 5.1 |
| No. of inpatient admissions over the past 90 days | ||
| 0 | 271,125 (66.8%) | 66.8 |
| 1 | 112,615 (27.8%) | 27.8 |
| 2 | 15,744 (3.9%) | 3.9 |
| 3+ | 6,205 (1.5%) | 1.5 |
| No. of emergency department visits over past 90 days | ||
| 0 | 307,713 (75.8%) | 75.9 |
| 1 | 70,027 (17.3%) | 17.2 |
| 2 | 17,411 (4.3%) | 4.3 |
| 3+ | 10,538 (2.6%) | 2.6 |
| Instrumental Activities of Daily Living (IADL) Self Performance and Capacity Scale | ||
| 0 = Independent in performing ordinary housework, meal preparation or phone use | 7,205 (1.8%) | 1.8 |
| 1 | 8,736 (2.2%) | 2.2 |
| 2 | 35,978 (8.9%) | 8.9 |
| 3 | 37,911 (9.3%) | 9.4 |
| 4 | 48,226 (11.9%) | 11.9 |
| 5 | 133,026 (32.8%) | 32.8 |
| 6 = Total dependence in performing ordinary housework, meal preparation or phone use | 134,607 (33.2%) | 33.2 |
| Activities of Daily Living (ADL) Self Performance Hierarchy scale | ||
| 0 = Independent in maintaining personal hygiene, toilet use, locomotion, and eating | 126,681 (31.2%) | 31.2 |
| 1 | 54,660 (13.5%) | 13.5 |
| 2 | 78,440 (19.3%) | 19.3 |
| 3 | 72,952 (18.0%) | 18.0 |
| 4 | 33,728 (8.3%) | 8.3 |
| 5 | 32,267 (8.0%) | 7.9 |
| 6 = Total dependence in maintaining personal hygiene, toilet use, locomotion, and eating | 6,961 (1.7%) | 1.7 |
| Worsening ADL | ||
| No | 200,342 (49.4%) | 49.4 |
| Yes | 200,182 (49.3%) | 49.4 |
| Missing or uncertain | 5,165 (1.3%) | 1.3 |
| Worsening decision-making capacity | ||
| No | 283,260 (69.8%) | 69.8 |
| Yes | 112,554 (27.7%) | 27.8 |
| Missing or uncertain | 9,875 (2.4%) | 2.4 |
| Reason for assessment | ||
| First assessment | 238,973 (58.9%) | 58.9 |
| Routine reassessment | 139,009 (34.3%) | 34.3 |
| Discharge assessment or discharge tracking | 152 (0.0%) | .0 |
| Significant change in status reassessment | 26,385 (6.5%) | 6.5 |
| Other (e.g. research) | 1,170 (0.3%) | .3 |
| Year of Assessment | ||
| 2018 | 187,230 (46.2%) | 46.1 |
| 2019 | 218,459 (53.8%) | 53.9 |
Table 5 presents the hazard ratios (HR) for the derivation cohort derived from the Cox proportional hazard regression. Total dependence in ADLs (self-performance score of 6) (HR 3.2, 95% confidence interval [CI] 3.0-3.5) and diagnosis of an end-stage disease (HR 2.8, 95% CI 2.7-3.0) were most predictive of 6-month mortality. These were followed by ADL self-performance score of 5 (HR 2.0, 95% CI 1.9-2.1), a reported history of needing oxygen therapy without COPD (HR 1.8, 95% CI 1.7-1.9), total dependence in IADLs (HR 1.8, 95% CI 1.6-2.0), chemotherapy without cancer (HR 1.6, 95% CI 1.2-2.1), chemotherapy with cancer (HR 1.6, 95% CI 1.5-1.7) and ADL self-performance score of 4 (HR 1.6, 95% CI 1.5-1.6). The remaining predictors had a HR less than 1.5. Of the signs and symptoms of health instability, weight loss was most predictive of 6-month mortality (HR 1.5, 95% CI 1.4-1.5) followed by a noticeable decrease in food or fluid consumption (HR 1.4, 95% CI 1.4-1.5). Edema was least predictive of 6-month mortality (HR 1.0, 95% CI 1.0-1.1). Worsening decision-making capacity and worsening ADL status had hazard ratios of 1.0 (95% CI 1.0-1.1) and 1.4 (95% CI 1.2-1.5), respectively.
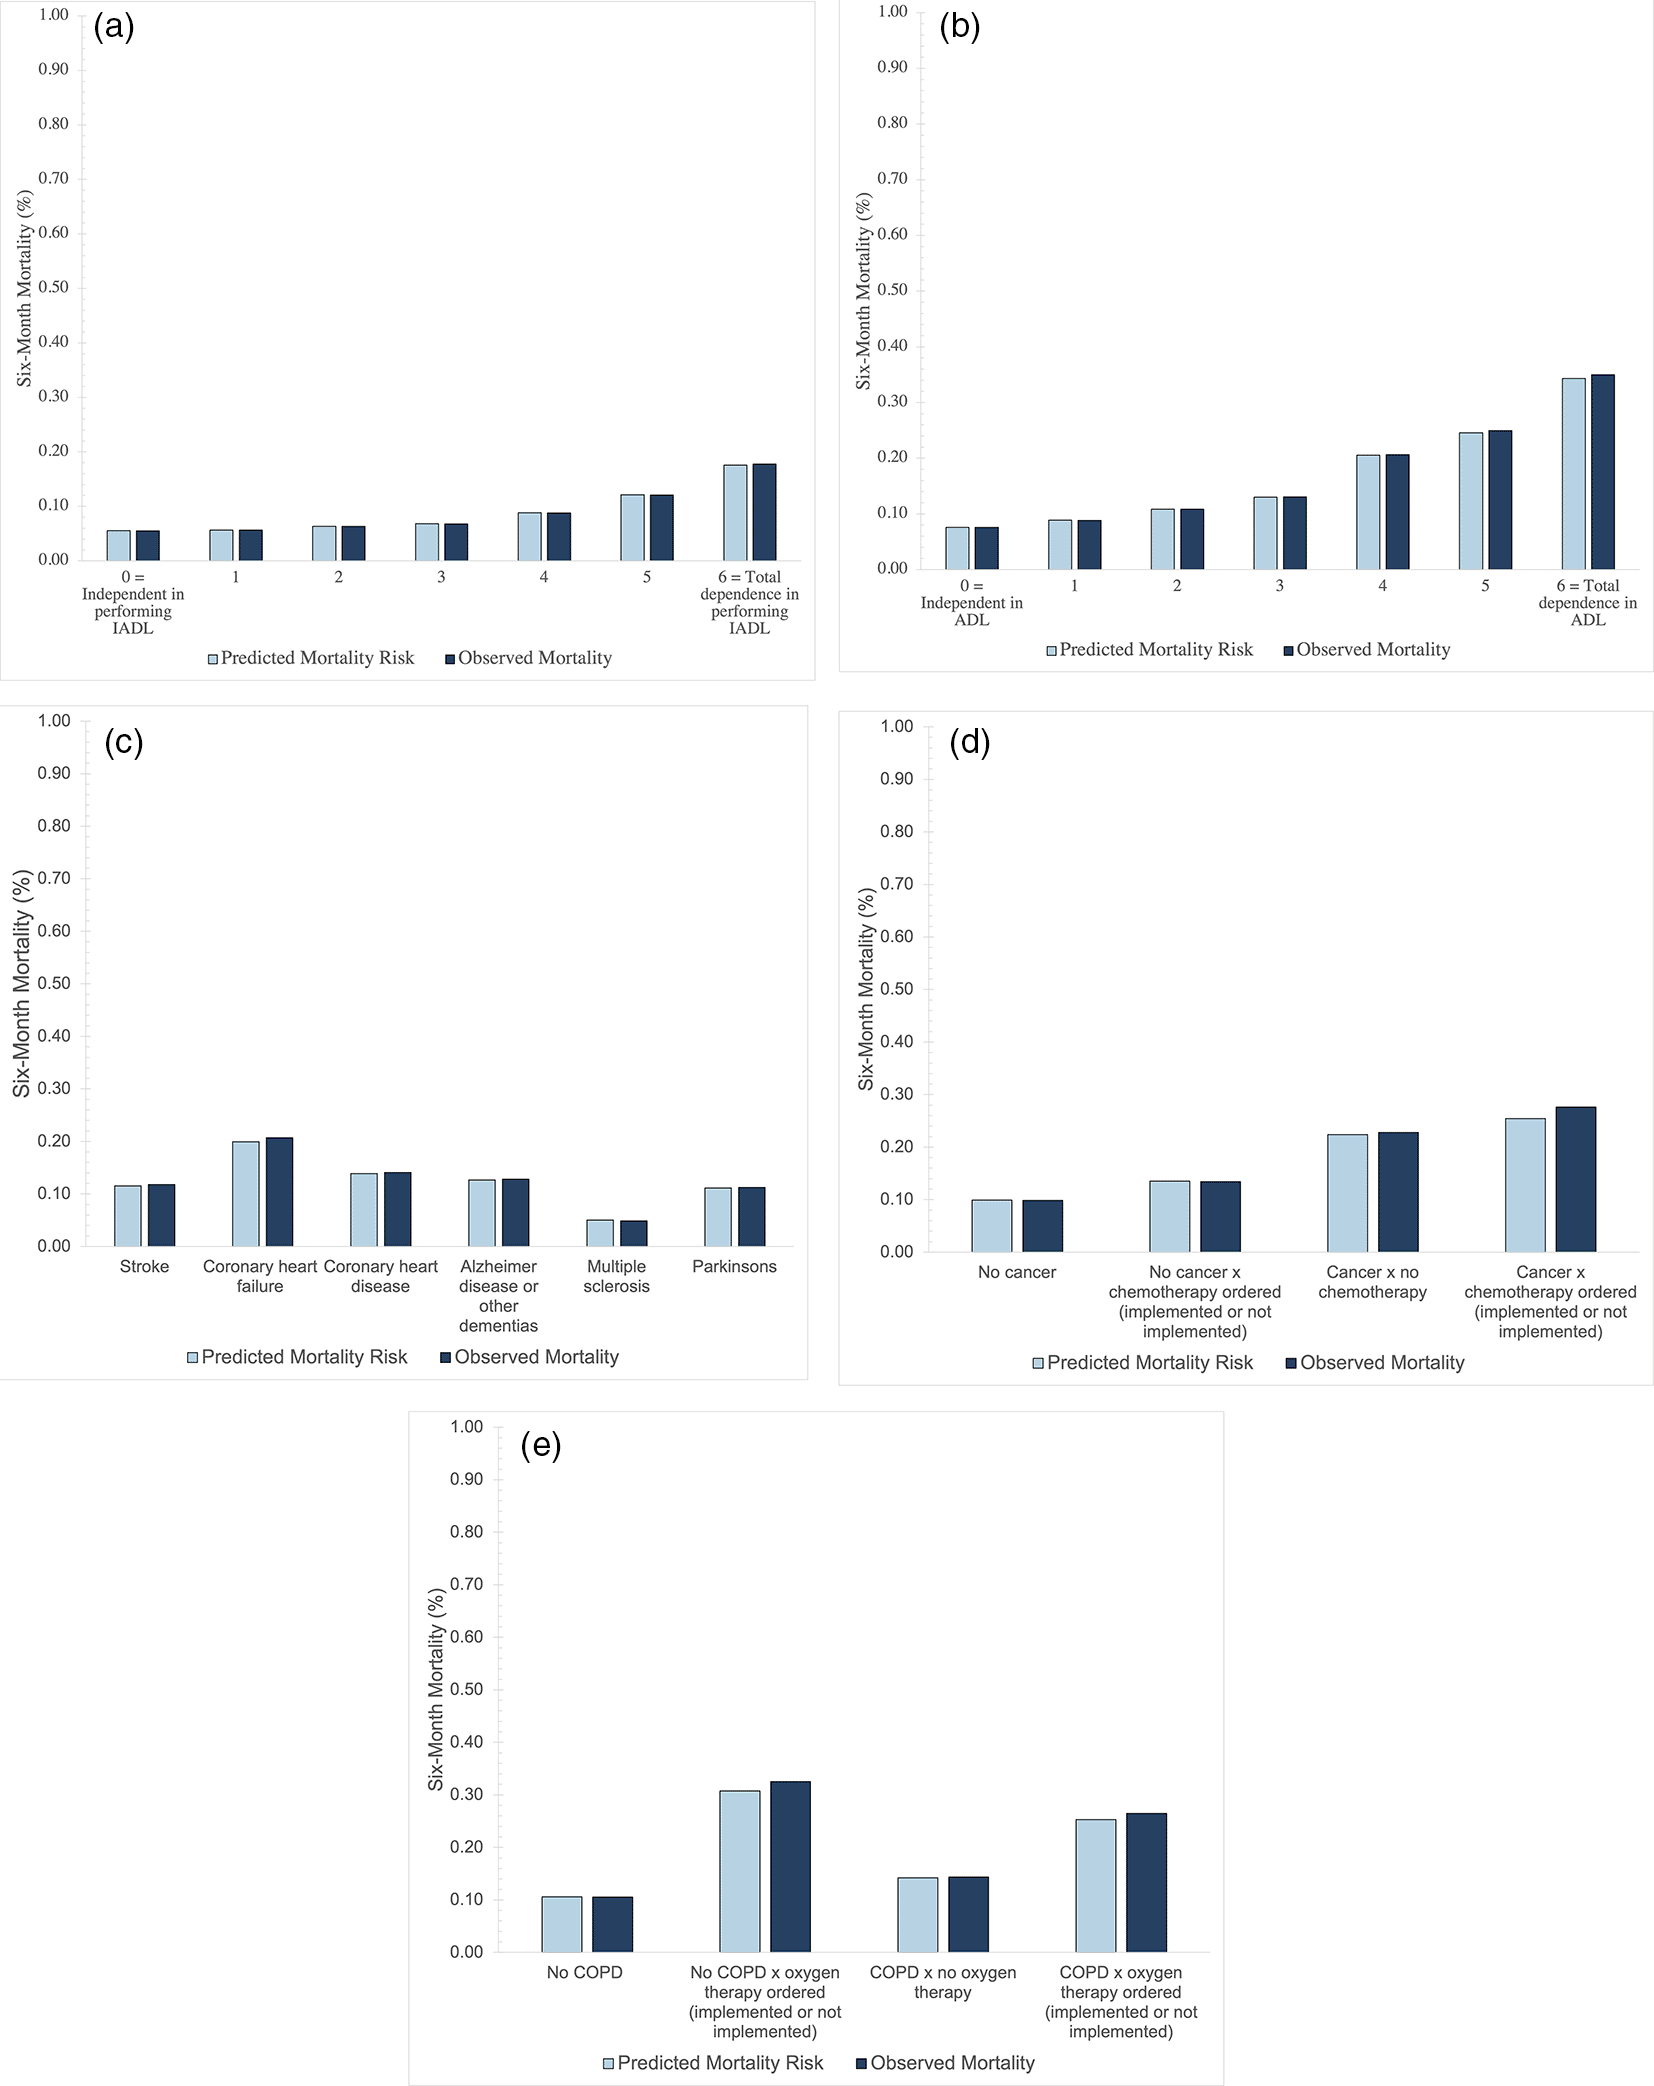
The calibration plot displays the mean predicted 6-month mortality risk against the Kaplan-Meier survival estimates across all 61 risk bins in the validation cohort (Figure 2). The model is well-calibrated across most risk bins; the calibration-in-the-large was 1.19 percentage points, on average, and the calibration slope was 0.88 (95% CI: 0.86-0.91). The model over-predicts risk (by 5.2% to 15.5%) in the highest mortality risk bins (bins 1 to 6), where the median survival was less than 6 months. To a smaller extent, the model underpredicts risk (by a magnitude of 0.5% to 2.6%) among individuals with moderate mortality risk (i.e., a mortality risk between 10% to 30% or bins 12-26). Overall, model c-statistic was 0.76 (95% CI 0.75-0.77) at 6 months, suggesting good discriminative ability in the validation cohort. Calibration was also evaluated in several subgroups of predictors, including functional status (i.e., ADL and IADL scale scores), select diseases, and the receipt of select life-sustaining therapies/treatments (Figure 3). The model is well-calibrated across all subgroups, with less than a 1.6 percentage point deviation from the observed 6-month mortality risk.

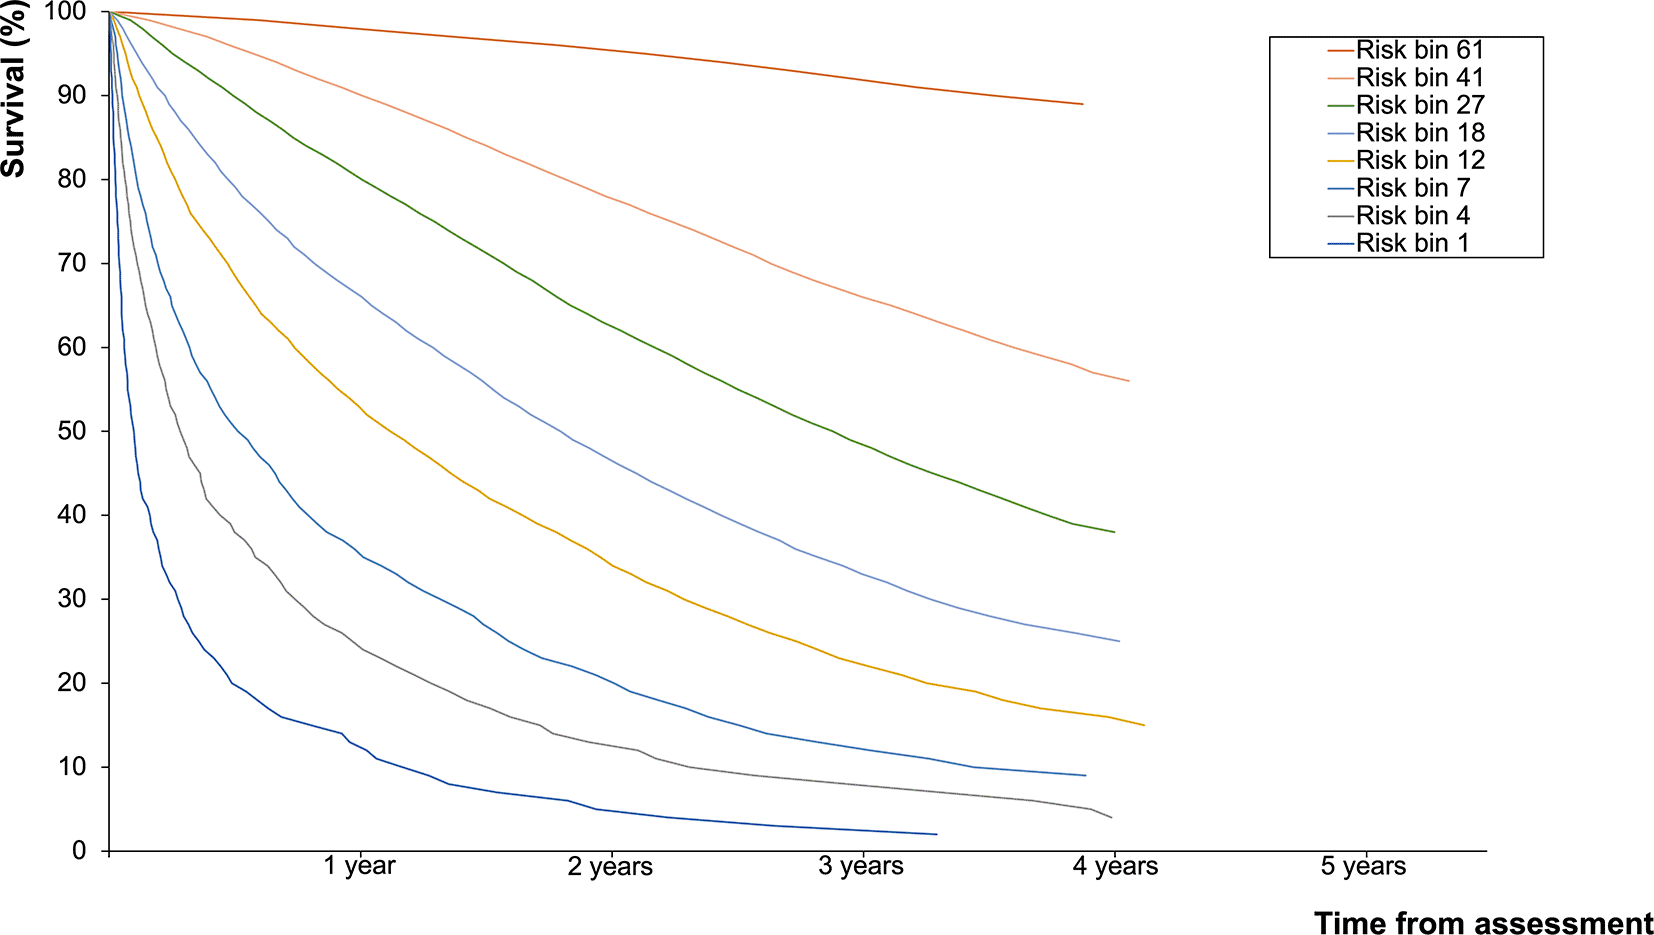
The mean predicted 6-month probability of death in our full study cohort was 18.0% and ranged from 1.51% in the lowest risk bin (95% CI 1.0%–1.542%) to 95.95% in the highest bin (95% CI 95.75%–96.15%) (Table 1, Figure 2). Median Kaplan–Meier survival (Figure 4) varied from 36 days (12–130d at the 25th and 75th percentiles) in the highest risk group to over 3.5 years (>1,413d at the 11th percentile) in the lowest risk group.
RESPECT is a prediction model of 6-month mortality among older, community-dwelling home care recipients aged 50 years and above. The re-estimated model using interRAI HC data has good predictive performance, with an overall model c-statistic of 0.76. As was observed in our previous model,12 functional limitations remained most predictive of 6-month mortality. Lastly, nearly 15% of clients died within 6-months, which is significantly greater than the proportion of assessments that had an identified prognosis of less than 6 months to live (2.3%). This highlights the potential role of tools like RESPECT in supplementing the clinical gestalt question (e.g., “Would I be surprised if this patient died in the next 6 or 12 months?”) for identifying patients who can benefit from a palliative approach to care.
RESPECT offers several benefits compared to other available prediction models. First, existing mortality prognostic indices have been largely focused on particular segments of the population5,17; for instance, a limited setting (e.g., hospitalized patients,18–22 veterans23 and long-term care residents24) or specific diseases and conditions (e.g., dementia,24 cardiovascular disease,25 or functional status26,27). RESPECT, however, can be used more broadly among community-dwelling frail older adults. Secondly, existing indices for community-dwelling adults often utilize longer prognostic timeframes (e.g., 2-years,26,27 4-years17 or 5-years5) whereas RESPECT predicts mortality within 6-months, which can support care planning and goals of care conversations for those nearing the end of life. Third, RESPECT was developed using routinely collected data that is readily available in many regions, as interRAI instruments are used internationally in more than 35 countries including New Zealand, Hong Kong and Singapore.28 In this regard, RESPECT has the potential to be widely adopted across multiple populations and regions. In settings where interRAI data is unavailable, there may be other routinely used frailty assessments that capture many of the predictors included in the RESPECT algorithm, such as limitations in ADLS and IADLs, comorbidities, symptoms, healthcare use and changes in health status. These include, for instance, the Comprehensive Assessment and Referral Evaluation (CARE),29 the Functional Autonomy Measurement System (SMAF),30 the OARS Multidimensional Functional Assessment Questionnaire (OMFAQ),31 and the Katz Index of ADLs32 among others. Such data sources offer potential opportunities for external validation of RESPECT as well as the development of similar prediction models for use in clinical settings. Lastly, the use of RESPECT is not limited by, or reliant on, initiation by healthcare professionals or other health providers. It can also be used independently by patients and families through the web-based tool available at ProjectBigLife.ca, as a mechanism for advocating for their care needs.
RESPECT is presently being used in home and community care settings in Ontario (including retirement homes) to help clinicians recognize patients with reduced life expectancies to inform care planning or trigger a referral to palliative care. While the willingness to use prognostic indices among clinicians has been previously documented,33 a variety of implementation factors must be addressed to support its adoption.34 RESPECT has, therefore, been designed so it can be used with minimal training and can be integrated into existing work processes, easily, reliably and at a low cost by leveraging readily available and routinely collected information. From a system perspective, RESPECT can be used by healthcare providers and organizations to inform capacity planning. For example, results from this analysis are being used by home and community care providers to highlight existing service gaps and support the design of clinical care pathways within home and community care programs that matches appropriate services to individuals with varying levels of need.
While the RESPECT algorithm demonstrates a good prognostic ability, the findings show current limitations of prognostication, particularly with regards to misclassification. REPSECT moderately overpredicts mortality among the highest risk bins. However, from a clinical application standpoint, these bins capture users with extremely poor prognosis who would likely benefit from the earlier provision of palliative care. The ability to prognosticate those near the end of life can be improved by including additional predictors, such as biomarker data, which will likely become an important area of future work to improve the predictive performance of algorithms like RESPECT.
RESPECT is a prognostic tool that estimates 6-month mortality risk in community-dwelling home care recipients aged 50 and above in Ontario, Canada. The model relies on variables readily available in routinely collected data, including age, sex, comorbidities, symptoms of health instability, healthcare service and treatment use as well as functional measures to accurately predict a home care client’s risk of death within 6 months. RESPECT demonstrates good discrimination and calibration, and our findings here suggest it could be useful in home care settings for earlier identification of individuals who might be nearing the end of life.
| Views | Downloads | |
|---|---|---|
| F1000Research | - | - |
|
PubMed Central
Data from PMC are received and updated monthly.
|
- | - |
Provide sufficient details of any financial or non-financial competing interests to enable users to assess whether your comments might lead a reasonable person to question your impartiality. Consider the following examples, but note that this is not an exhaustive list:
Sign up for content alerts and receive a weekly or monthly email with all newly published articles
Already registered? Sign in
The email address should be the one you originally registered with F1000.
You registered with F1000 via Google, so we cannot reset your password.
To sign in, please click here.
If you still need help with your Google account password, please click here.
You registered with F1000 via Facebook, so we cannot reset your password.
To sign in, please click here.
If you still need help with your Facebook account password, please click here.
If your email address is registered with us, we will email you instructions to reset your password.
If you think you should have received this email but it has not arrived, please check your spam filters and/or contact for further assistance.
Comments on this article Comments (0)