Keywords
Compression Elastography, Muscle elasticity, Ultrasound, Spasticity
Compression Elastography, Muscle elasticity, Ultrasound, Spasticity
Spasticity is a health condition that can occur at any time after stroke, with a prevalence ranging from 17% to 46%. Spasticity is a major cause of disability; thus, its management is crucial in post-stroke care.1 This disability raises clinical problems, such as a reduction in activities of daily living and quality of life by approximately 10–12%.2 Various methods are employed for its assessment, the most widely used of which is the modified Ashworth scale (MAS).3 The MAS test is subjective, non-quantitative, and unreliable in the clinical assessment of muscle spasticity, and TS does not show good intra-rater reliability in the assessment of limb muscle spasticity.4
Ultrasound (US) has become an alternative method for determining muscle stiffness and has vast potential benefits for the diagnosis, categorization, and monitoring of musculoskeletal diseases.5 Numerous studies have reported the application of ultrasound elastography USE in the study of spasticity, which is related to muscle stiffness. USE is used to quantify biological tissue stiffness by measuring the deformation or displacement of the muscles.6 The two major techniques used in musculoskeletal elastography are compression elastography (CE) and shear-wave elastography (SWE). CE can be achieved by exerting pressure on the US transducer of the skin resulting in tissue displacement. USE measures tissue stiffness and is based on the principle that the compression of tissue produces strain. Harder tissues are less compressible and demonstrate lower strain, whereas softer tissues are more compressible and demonstrate higher strain.7 In this work, Compression Elastography is based on the calculation of strain8 and shows promise in the assessment of breast lesions/masses, myocardial stiffness, and post-stroke spasticity. Strain values for the muscle present a significant increase in muscle stiffness in the spastic muscle of individuals, as represented by a remarkable decrease in muscle strain in the spastic muscle compared with the axial strain in a healthy non-spastic muscle.9,10 The methodology employed in this approach is based on Hooke's law, which posits that when the compressive force acting on the tissue is uniformly distributed, E (modulus of elasticity)=stress/strain.9
The purpose of this study was to use CE to characterize the normal range (subjects without changes with a rating of zero on the modified Tardieu scale) of muscle strain in the biceps brachialis in healthy volunteers, using a semi-automatic algorithm for muscle thickness measurement to obtain a qualitative measurement of strain muscle, after applying a controlled pressure from an electromechanical actuator.
We advise using the subheadings in this section to improve the readability of the article. (For example, the study design, data collection, and data analysis).
This study employed a single-group trial design in which a single group of healthy participants was included. In this approach, no comparisons were made with the other groups, as all participants were part of the same group of healthy subjects. Eleven healthy and physically active adults participated in the experiment (seven males and four females), and two patients with post-stroke spasticity (one male and one female). In this study, three measurements were made for each volunteer (healthy and spastic); therefore, there were 21 strain data points for healthy men, 12 strain data points for healthy women, and 3 strain data points for volunteers with spasticity. Consent was obtained from all participants. This study was approved by the Ethics Committee of the University of Cauca (approval date: 04/2022). The procedures were conducted according to the principles of the Declaration of Helsinki and CONSORT reporting guidelines.
The inclusion criteria for volunteers with spasticity were as follows: (1) patients with spasticity. Evaluation of Tardieu scale ≥1 and Ashworth scale >1. (2) Patients who underwent the same model of therapeutic intervention or at least the same approach: Neurodevelopment and Neurorehabilitation from the BOBATH approach (without the application of electrotherapy). (3) Age between 18 and 65 years. Patients were excluded if they (1) had unstable vital signs. (2) Irreversible contracture of any joint of the extremities. (3) History of surgery, fracture, arthritis or pain, fever, and botulinum toxin treatment in the last six months. (4) Post-stroke seizures. (5) Heart attacks in the last 3 months. (6) Not having used oral muscle relaxants were not used in the previous week.
The inclusion criteria for healthy volunteers were as follows: (1) age between 18 and 65 years old. Adults with movement (including neurological impairment or severe scoliosis) were excluded from this study.
Blinding of the evaluators was not implemented in this study because of the pronounced and evident degree of muscular and functional impairment observed in the two individuals with spasticity. The severity of spasticity in these individuals makes it readily apparent, obviating the need for blinding procedures. As such, the evaluators were fully aware of the participants' spastic conditions during the outcome assessment.
Physical assessments were performed by two physical therapist evaluators with postgraduate training in neurorehabilitation and 10 years of experience in neurorehabilitation. Interviews were conducted with all participants to collect clinical and demographic data, including age, sex, type of stroke, number of stroke events, and time since the onset of stroke.
The measurements were carried out in a medical office in Popayán (Colombia) on 06/2023 with the following characteristics: natural ventilation, no air conditioning, and maintaining a temperature in the range considered “comfortable” for human rest (between 18° and 20 °C). This was due to the potential effects of temperature increase or decrease on muscle performance and function, especially in muscles with spasticity of the biceps brachii on the paretic side, which was evaluated with a Tardieu.
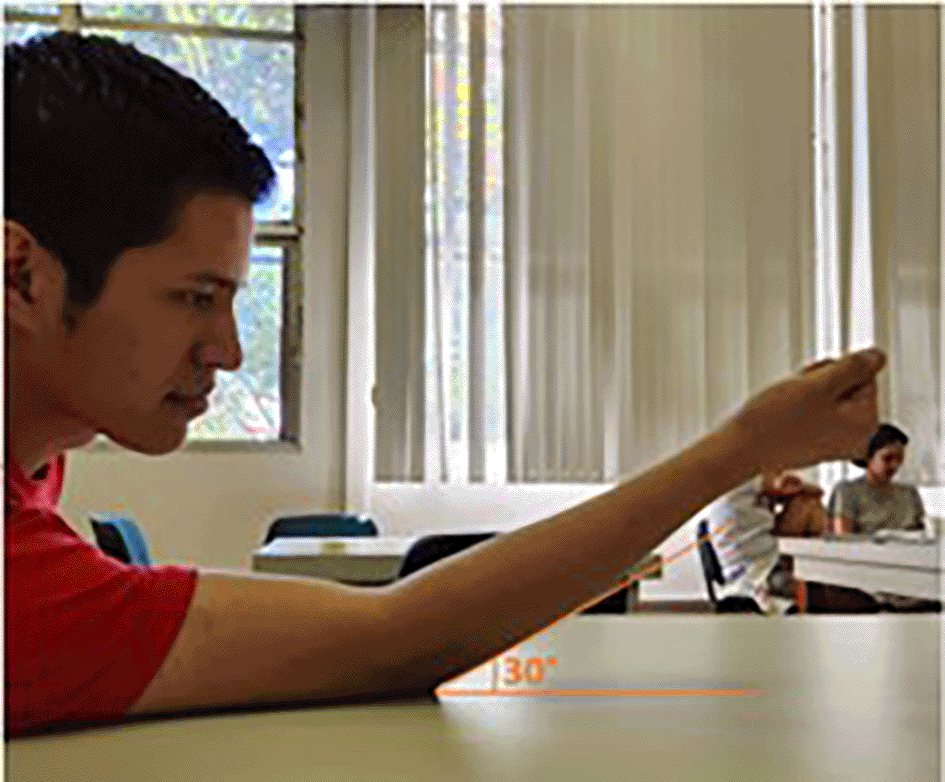
The strain value was estimated using an ultrasound probe (SiMPLi SP-L01 USB, Interson, US) and its SDK to communicate the API and the usb2 probe, provided by the manufacturer (Version 2.12, released in 2017, using C#)operating at a 10-cm scan depth and a 7 MHz scan frequency. Each volunteer was placed in a sitting position with 90° abduction and external rotation of the arm, with the distal third of the forearm fixed to avoid involuntary movements that could interfere with measurements. The probe was located 5 cm above the motor point of the long head with the elbow flexed at 30° (Figure 1) and aligned with the fascicles viewed from the B-mode image. The gel was used for the best coupling. Three measurements were performed for each participant.
The test performed on each participant involved applying a controlled compression and decompression cycle synchronized with the acquisition of ultrasound images from the SDK of the ultrasound probe. An electromechanical device designed specifically for this study was utilized to facilitate the process.
From this cycle duration of 24 seconds, Forty-eight B-mode images were obtained with a sample period of 500 ms, which were used to calculate the strain ratio curve.
To estimate strain, we first selected the same region of interest (ROI) for all 48 images obtained (Figure 2a). Then, the strain is obtained according to Ref. 9 by subtracting the final length of the thickness (images 0 to 47) from the initial (image 0) thickness and then dividing the result by the initial length, as shown in equation 1.
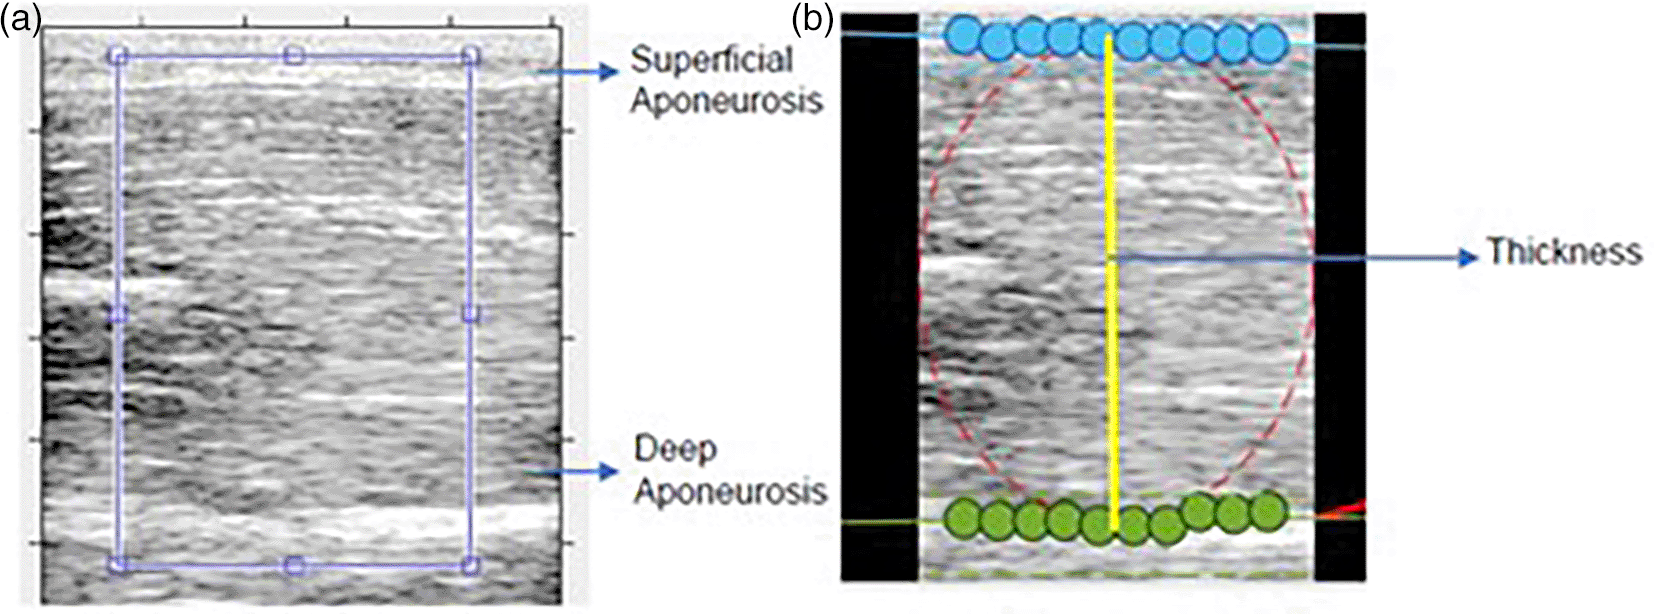
The thickness (Figure 2b) was estimated using the algorithm proposed in Ref. 11, which assesses the geometric characteristics (thickness and fascicle length) of the pennate muscle based on ultrasound images of the deep and superficial aponeurosis of the biceps. In this study, we utilized the code from Ref. 12, which unfortunately did not accurately identify the aponeuroses in its implementation. Manual inspection was thus necessary for aponeurosis detection, involving the verification of the ROI displacement during the controlled compression and decompression cycleThe strain is a function of time (48 images were taken every 500 ms). The strain values can also be displayed as curves. In a strain graph, the Y-axis represents the value of the strain and the x-axis represents time (or frames).9,13
The data analysis was performed using MATLAB R2022B-Academic use Normality was confirmed using the Shapiro–Wilk test. Descriptive statistical values were estimated (mean and standard deviation) for male and female strain values for healthy and volunteers with spasticity. Visual representation of the data was obtained using a boxplot. For this experiment, the independent samples t-test was used to compare the strain values in healthy males and females (p-value <0.05, indicating statistical significance).
The following results are presented in the context of SR measurements taken from a cohort of 11 healthy volunteers and 2 individuals with spasticity. Table 1 shows the demographic and clinical characteristics of the patients.
The Shapiro-Wilk test was used to check for normality of the data at a 5% significance level. The null hypothesis (p-value = 0.9 (except for the strain values of images 20, 21, and 33) for women and 0.35 for men (except for the strain values of images 12, 14, and 19) was accepted.
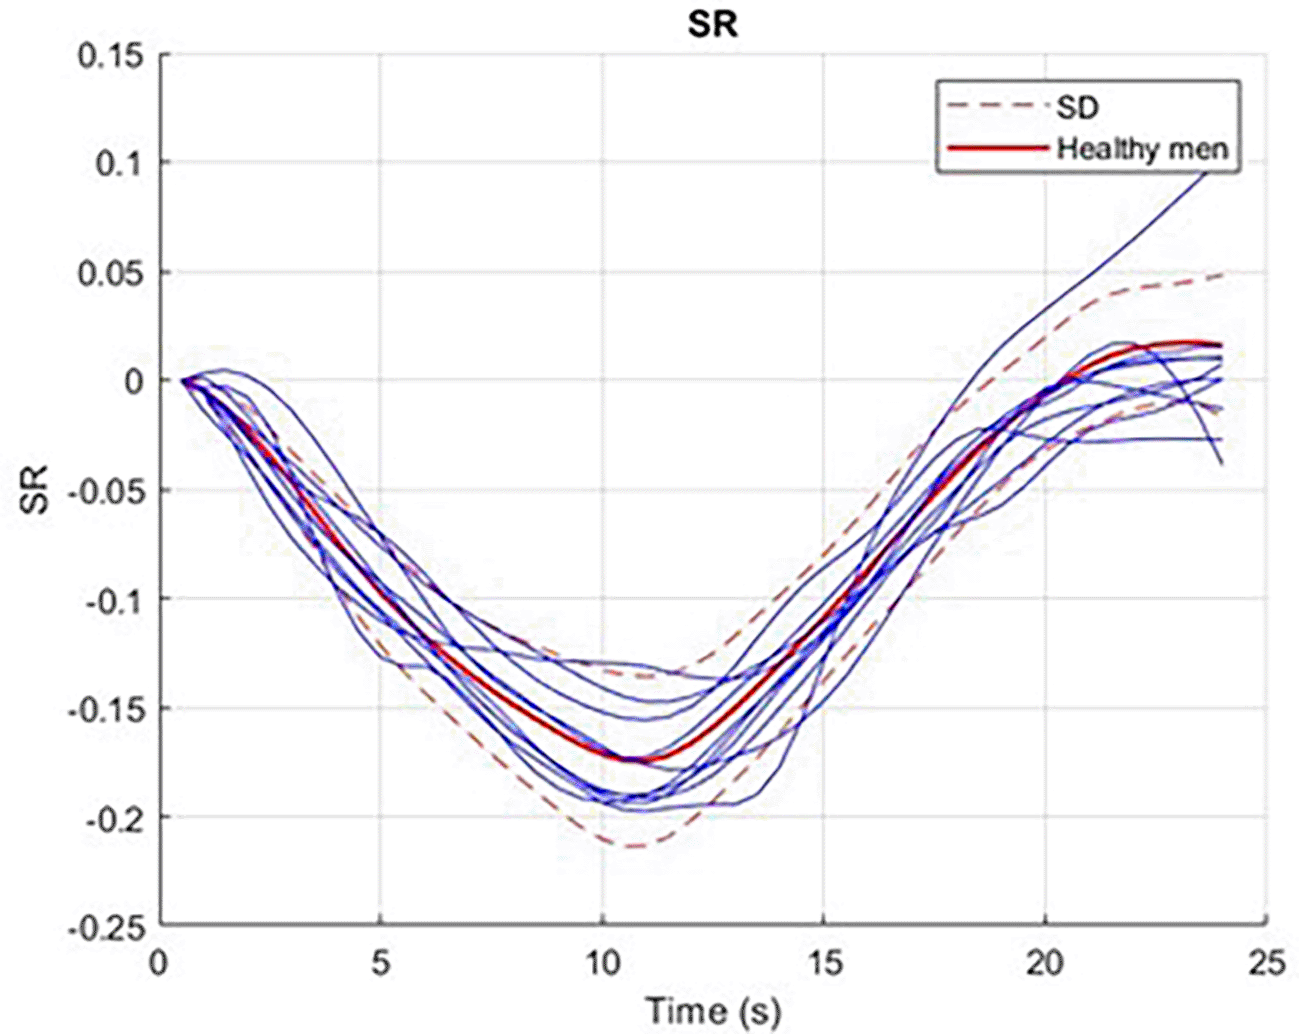
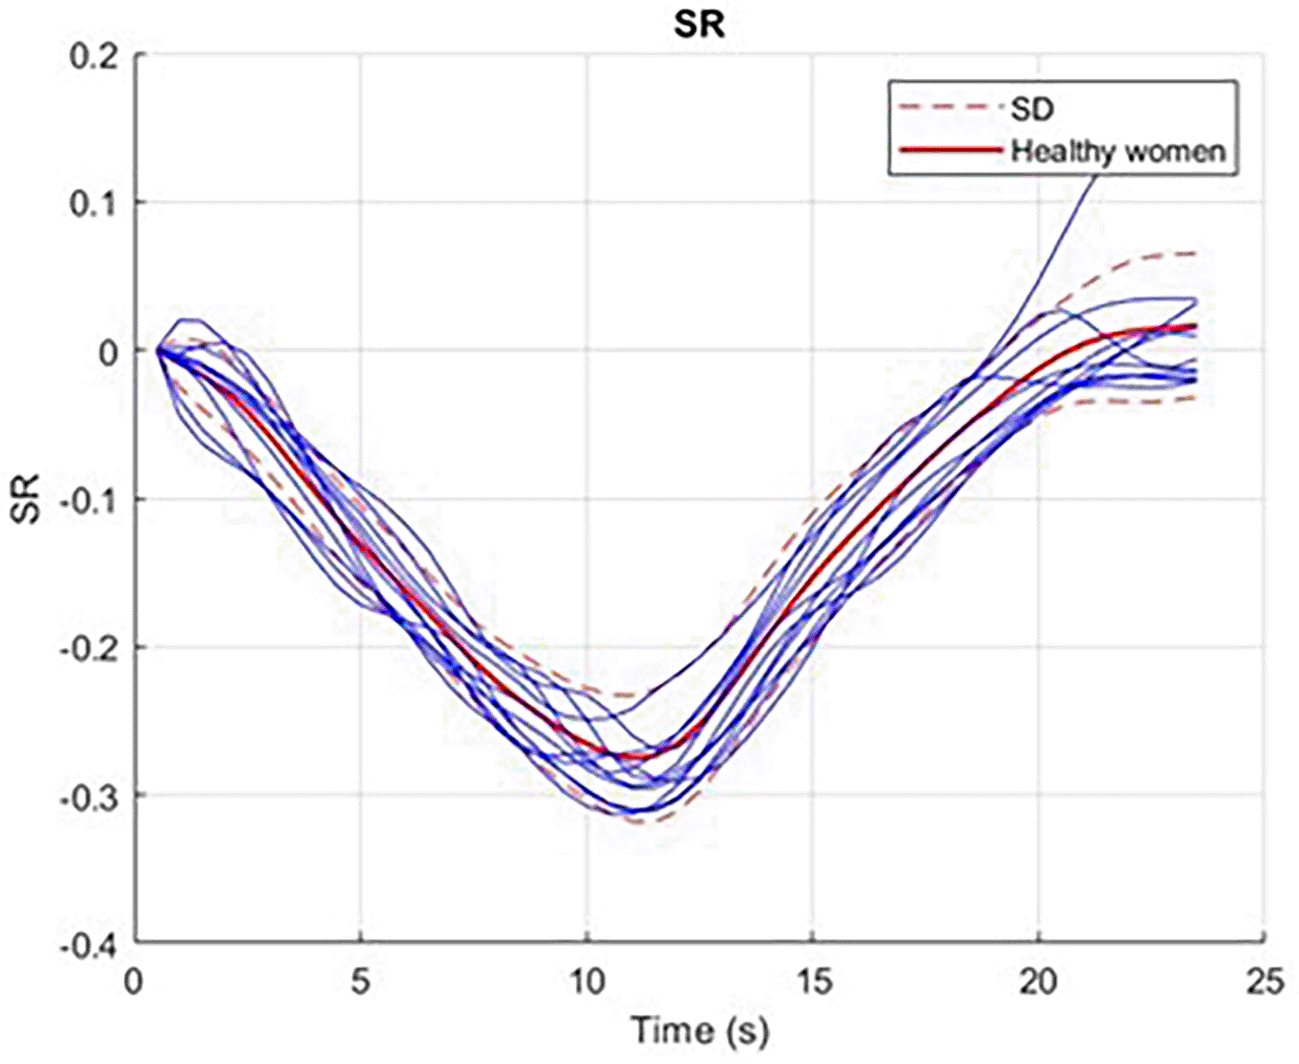
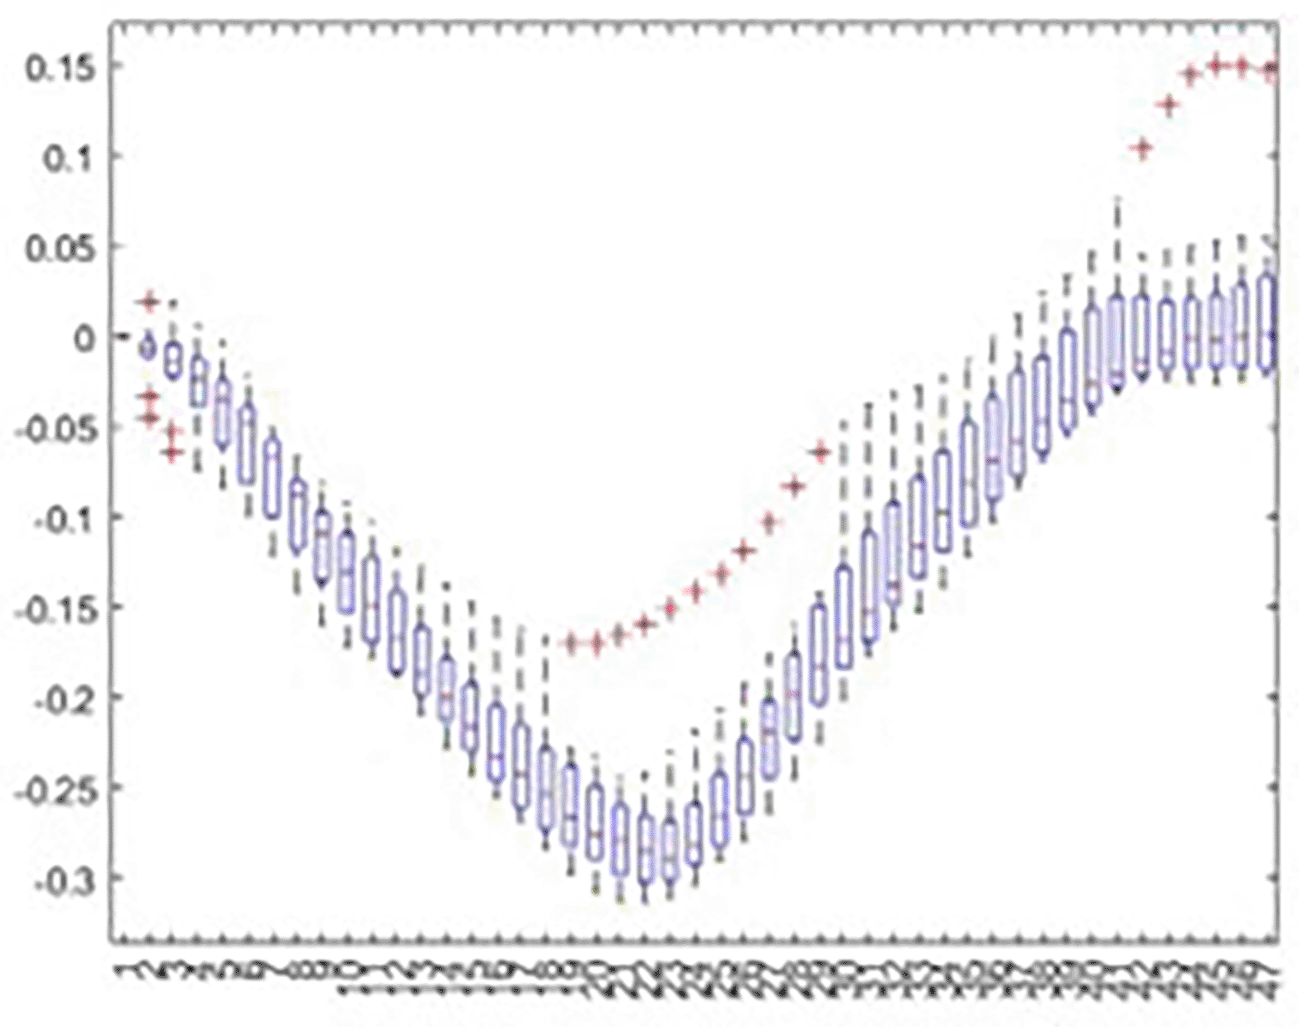
Figures 3 and 4 show the mean (strong red line) and standard deviation (red dotted lines) for the strain values when controlled pressure and decompression cyclewas applied in healthy men and women. The estimated individual strain values for each volunteer are shown (blue lines).
Figures 5 and 6 show a visual representation of the strain values for healthy men and women, where the median is represented by a red line and the lower and upper ends of the box indicate the 25th and 75th percentiles, respectively. Whiskers extend to the most extreme data points that are not considered outliers and outliers are individually represented by the ‘+’ marker symbol.

The Tardieu scale gave a qualification of 2 (obvious muscle contraction at a specific angle, followed by relaxation by interruption of stretch) in male volunteers with spasticity and 3 (clonus appearing at a specific angle that lasts less than 10 seconds when the evaluator is pressing against the muscle) in female volunteers with spasticity.
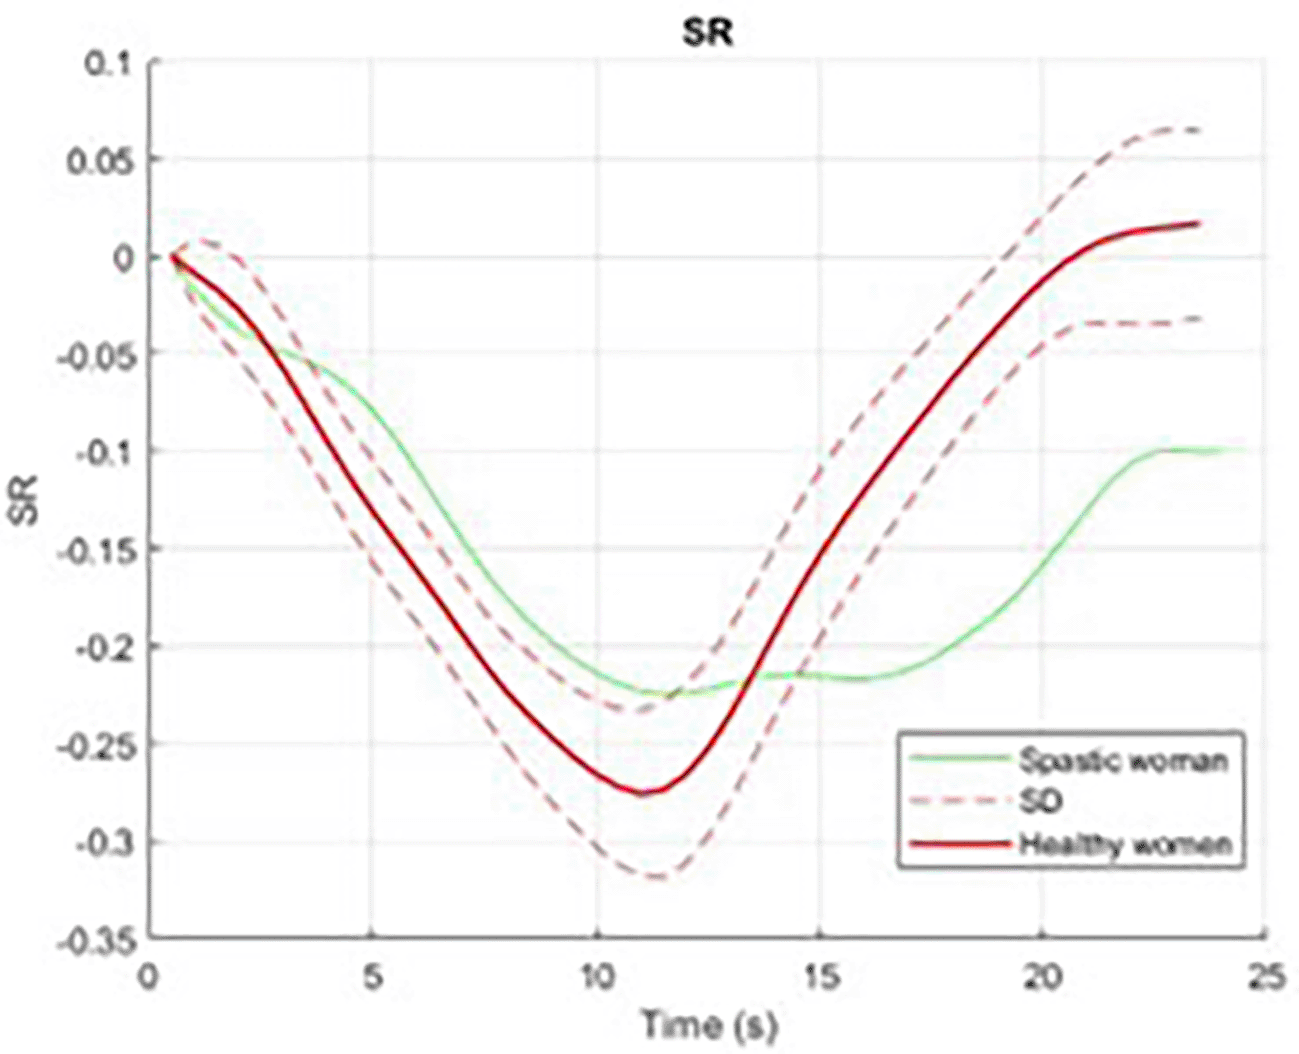
Figures 7 and 8 show the mean (green line) for strain while controlled pressure is applied to one male and one female volunteer with spasticity, and the normal range for healthy men and women is determined by the estimated mean and standard deviation.

The P-value from the t-test was pt = 7.2520e-32, rejecting the null hypothesis that the average of the two populations (healthy men and women) is equal.
This paper presents the development of a tool to estimate the normal range of the strain value in healthy men and women while applying controlled pressure using an electromechanical actuator without direct intervention by an operator. This procedure was intended to reduce the variability that occurs when pressure is applied manually, thus producing a more consistent strain measurement.
In Figures 6 and 7, it can be observed that during the application of maximum pressure on healthy volunteers, there is a higher number of outliers. This behavior is believed to be due to the muscle response to excessive stretching, known as the myotatic reflex, which triggers muscular contraction as a protective mechanism. However, it is noteworthy that the muscle quickly adapts and returns to its normal state, responding rapidly to the applied pressure.
In contrast, in volunteers with spasticity, the response to maximum pressure is prolonged over time owing to the hyperactive myotatic reflex observed in these patients, which hinders their ability to respond promptly to the applied stimulus. These findings revealed significant differences in muscle elasticity and response to stimuli between healthy volunteers and those with spastic muscles. Rapid adaptation and recovery in healthy individuals, along with the prolonged response in patients with spasticity, provide relevant insights into muscle function.
Figures 7 and 8 show that the response of the spastic muscle in both men and women falls outside the normal range proposed in this study. These findings highlight the unique biomechanical differences associated with spasticity.
Based on the results of the t-test analysis, there was a significant difference in biceps strain between healthy men and women. The obtained p-value (pt = 7.2520e-32) was extremely small, indicating strong evidence to reject the null hypothesis that the average strain in the two populations (healthy men and women) is equal. This suggests that there is a significant disparity in biceps muscle elasticity between healthy men and women, which may be attributed to biological and/or physiological differences between sexes. These findings could have important implications in the fields of physiology and biomechanics, as well as in understanding sex differences in terms of physical performance and musculoskeletal health.
The standard deviation estimated in this study was satisfactory for characterizing the strain value in both healthy men and women, making it a viable initial assessment for establishing a normal range in healthy individuals. Additionally, the dynamic behavior of the muscle in response to the applied pressure exhibited a consistent trend. The measured strain values showed a relatively low variability within the healthy population, suggesting a reliable measure of muscle elasticity.
Furthermore, the observed similarity in the dynamic behavior of muscles across sexes underlines the potential of the proposed measurement mechanism. Therefore, it seems that the method holds promise in assessing muscle elasticity irrespective of sex, rendering it an effective and versatile approach for further investigations.
In light of these results, the importance of conducting additional experiments with a larger sample size and involving different operators to assess inter- and intra-evaluator reliability is emphasized. The limited sample size used in this study underscores the need to expand research with a more extensive and diverse participant pool.
In this study, the behavior of the modulus of elasticity of the biceps brachii muscle was characterized in the face of compression that gradually increased to a maximum and then decreased in the same way. This experiment allowed us to verify that there are differences in the way the muscle recovers from stress in patients with and without spasticity, as well as a difference between men and women.
The proposed measurement mechanism was sensitive enough to observe the strain behavior of normal muscles. The SD values obtained are acceptable for each strain measurement because the standard deviation is considered small and relatively constant (higher in the application of maximum pressure).
A comparison of the average curve for the healthy group with two examples of curves from individuals with spasticity showed evident differences. Thus, it is worth continuing the research by evaluating a group of subjects with spasticity and trying to establish ways to quantify the level of spasticity, as well as to perform a follow-up of individuals subjected to recuperation protocols.
The study, conducted in accordance with the Declaration of Helsinki, was approved by the Ethics Committee of the University of Cauca, a legally constituted body. Approval was granted on April 26, 2022. Prior to participation, all volunteers, both healthy patients and patients with spasticity, provided written informed consent to participate in the study. This included consent for physical assessment, ultrasound measurements, and data collection procedures. We ensured that all participants fully understood the procedures and voluntarily agreed to participate in the study.
| Views | Downloads | |
|---|---|---|
| F1000Research | - | - |
|
PubMed Central
Data from PMC are received and updated monthly.
|
- | - |
Provide sufficient details of any financial or non-financial competing interests to enable users to assess whether your comments might lead a reasonable person to question your impartiality. Consider the following examples, but note that this is not an exhaustive list:
Sign up for content alerts and receive a weekly or monthly email with all newly published articles
Already registered? Sign in
The email address should be the one you originally registered with F1000.
You registered with F1000 via Google, so we cannot reset your password.
To sign in, please click here.
If you still need help with your Google account password, please click here.
You registered with F1000 via Facebook, so we cannot reset your password.
To sign in, please click here.
If you still need help with your Facebook account password, please click here.
If your email address is registered with us, we will email you instructions to reset your password.
If you think you should have received this email but it has not arrived, please check your spam filters and/or contact for further assistance.
Comments on this article Comments (0)