Keywords
earthquake, land deformation, SAR, Indonesia
This article is included in the Japan Institutional Gateway gateway.
earthquake, land deformation, SAR, Indonesia
Indonesia is situated in the so-called “Ring of Fire”, a region of high seismic activity along the Pacific Ocean. The country is particularly vulnerable to earthquakes because of its location on the Sunda megathrust, which is a major boundary between Eurasian and Australian tectonic plates (Keep and Schellart 2012), and the geostatistical distribution of historical earthquake in Indonesia with magnitude more than 7.5 and casualties over 10 people has been studied elsewhere (Ramdani and Chairunnisa 2021). In the previous decade, this region has experienced several large earthquakes, including an earthquake of magnitude 7.8 on 2 June 1994 and an earthquake of magnitude 7.7 on 17 July 2006, both of which occurred on the south of the Java Island and caused destructive tsunamis (Gunawan et al. 2017). Furthermore, an earthquake of magnitude 6.3 occurred in Yogyakarta on 26 May 2006, and was at a shallow depth within the overriding Sunda Plate. Additionally, an earthquake of magnitude 6.9 hit Java on August 2, 2019 (Pratama et al. 2022; USGS 2022a).
On 21 November 2022, an earthquake of magnitude 5.6 struck Java, with its epicentre located in Cianjur, West Java. The earthquake caused significant damage to the buildings and infrastructure in the region, and several injuries and fatalities have been reported (Sutarman et al. 2022). In this study, we geospatial data to investigate the land deformation caused by the Cianjur earthquake.
In nature, land deformation constitutes vertical and horizontal deformation. The use of interferometric synthetic aperture radar (InSAR) to detect and monitor land deformation has gained significant attention in recent years. InSAR has proven to be an effective tool for detecting and quantifying land deformation because it allows for the measurement of ground deformation with high spatial and temporal resolution (Li et al. 2019). Vertical land deformation is the vertical downward or upward movement of the Earth’s surface relative to a specific surface, such as the ellipsoidal height in Global Navigation Satellite System (GNSS) observations.
Many studies have been conducted on this topic (Sneed and Brandt 2015; Liu et al. 2019; Jones, Jones, and Bekaert 2021; Deros et al. 2022). A study by monitored land subsidence in San Joaquin Valley, California using InSAR and GPS. They found that the InSAR data could accurately detect and map areas of land subsidence, and that this technique was able to provide valuable information on the spatial and temporal patterns of land subsidence. Another study by Bawden et al. (2012) used the InSAR method for ERS satellite data processing to monitor land subsidence in the Houston-Galveston region of Texas. They found that the InSAR technique could detect and map areas of land subsidence that provided valuable information on its spatial and temporal patterns. Furthermore, a study by Lai et al. (2022) used the InSAR method to monitor the land subsidence of Wuhan City, China. They found that land subsidence was caused by construction and underground subway development. Another study in Iran (Ghorbani et al. 2022) reported an average annual rate of 38 mm between 2006 and 2020 using the InSAR technique. However, the authors stated that their method could not be optimised for local deformations such as for infrastructural monitoring.
One advantage of InSAR method for land subsidence detection, is its ability to provide high-resolution measurements of ground deformation. InSAR uses radar images from multiple satellite passes to produce an interferogram, which is a map of the phase differences between the radar signals. These phase differences can be converted into displacement values, allowing for the measurement of land subsidence with sub-millimetre accuracy (Raspini et al. 2016).
Additionally, InSAR can provide continuous monitoring of land subsidence, allowing for the detection of both long-term and short-term changes in ground deformation. This can be particularly useful for detecting land subsidence events, such as those caused by underground mining (Zhang, Lu, and Kim 2017).
Furthermore, InSAR can be used to detect subsidence in areas that are difficult to access or monitor using traditional methods, such as remote or urban areas (Zhang et al. 2011). This can provide valuable information for the management and mitigation of subsidence-related hazards.
In summary, InSAR applications for land subsidence have several advantages. First, InSAR provides high spatial and temporal resolution, allowing for the detection of small-scale subsidence events and monitoring of changes over time (Hooper et al. 2012). Second, InSAR can operate under all weather conditions, making it suitable for areas with variable climatic conditions (Li et al. 2019). Third, InSAR can penetrate vegetation and clouds, providing access to areas that are difficult to monitor using other traditional methods (Flores-Anderson et al. 2019).
This study aimed to accurately measure and monitor the land deformation in the study area using the InSAR method. This information can be used to identify potential hazards associated with land deformation, such as soil instability, liquefaction or the risk of landslides, and to support effective land management, disaster response, and recovery (Hidayat et al. 2020; Jiang et al. 2021; Krisnanto et al. 2021; Deros et al. 2022).
Cianjur is located in the south-eastern part of Indonesia’s capital Jakarta, approximately 107 km by road from Jakarta. It is located in a mountainous region, with the exception of short plains in some areas on the southern coast. The total area of Cianjur is 3,840.16 km2 with a population of 2,437,838 inhabitants (BPS 2022) and a population density of 634.82/km2.
The livelihood of the community depends predominantly on food crops, horticulture, animal husbandry, fisheries, plantations, and forestry. The majority of the population works in the agricultural, manufacturing, and service sectors. Major and small rivers, such as the Cibuni River, which drains into the Indian Ocean and is the longest river in Cianjur, are the source for crop irrigation, which supports the agricultural sector.
From 1992 to 2022, the region has been struck by more than 200 earthquakes (USGS 2022a). One of the largest earthquakes was an earthquake with a force of seven magnitudes on the Richter scale that occurred on 2 September 2009 (Centre for Research on the Epidemiology of Disasters 2022). The earthquake occurred at a depth of approximately 50 km as a result of reverse faulting near the Australian Sunda plate boundary. The rupture occurred on north-northeast- or south-striking, moderately dipping the reverse fault according to focal mechanism solutions (USGS 2009).
As per the United States Geological Survey (USGS), the earthquake that struck on November 21, 2022, measuring 5.6 magnitude, resulted from movement along fault lines within the crust of the Sunda plate. The fault lines either slant sharply to the north with a rightward shift or to the east with a leftward shift, as indicated by seismic data. The Australian plate moves about 59 mm/year towards the north-northeast relative to the Sunda Plate, sinking beneath it at the Sunda Trench, approximately 260 km southwest of the quake’s epicenter (USGS 2022b).
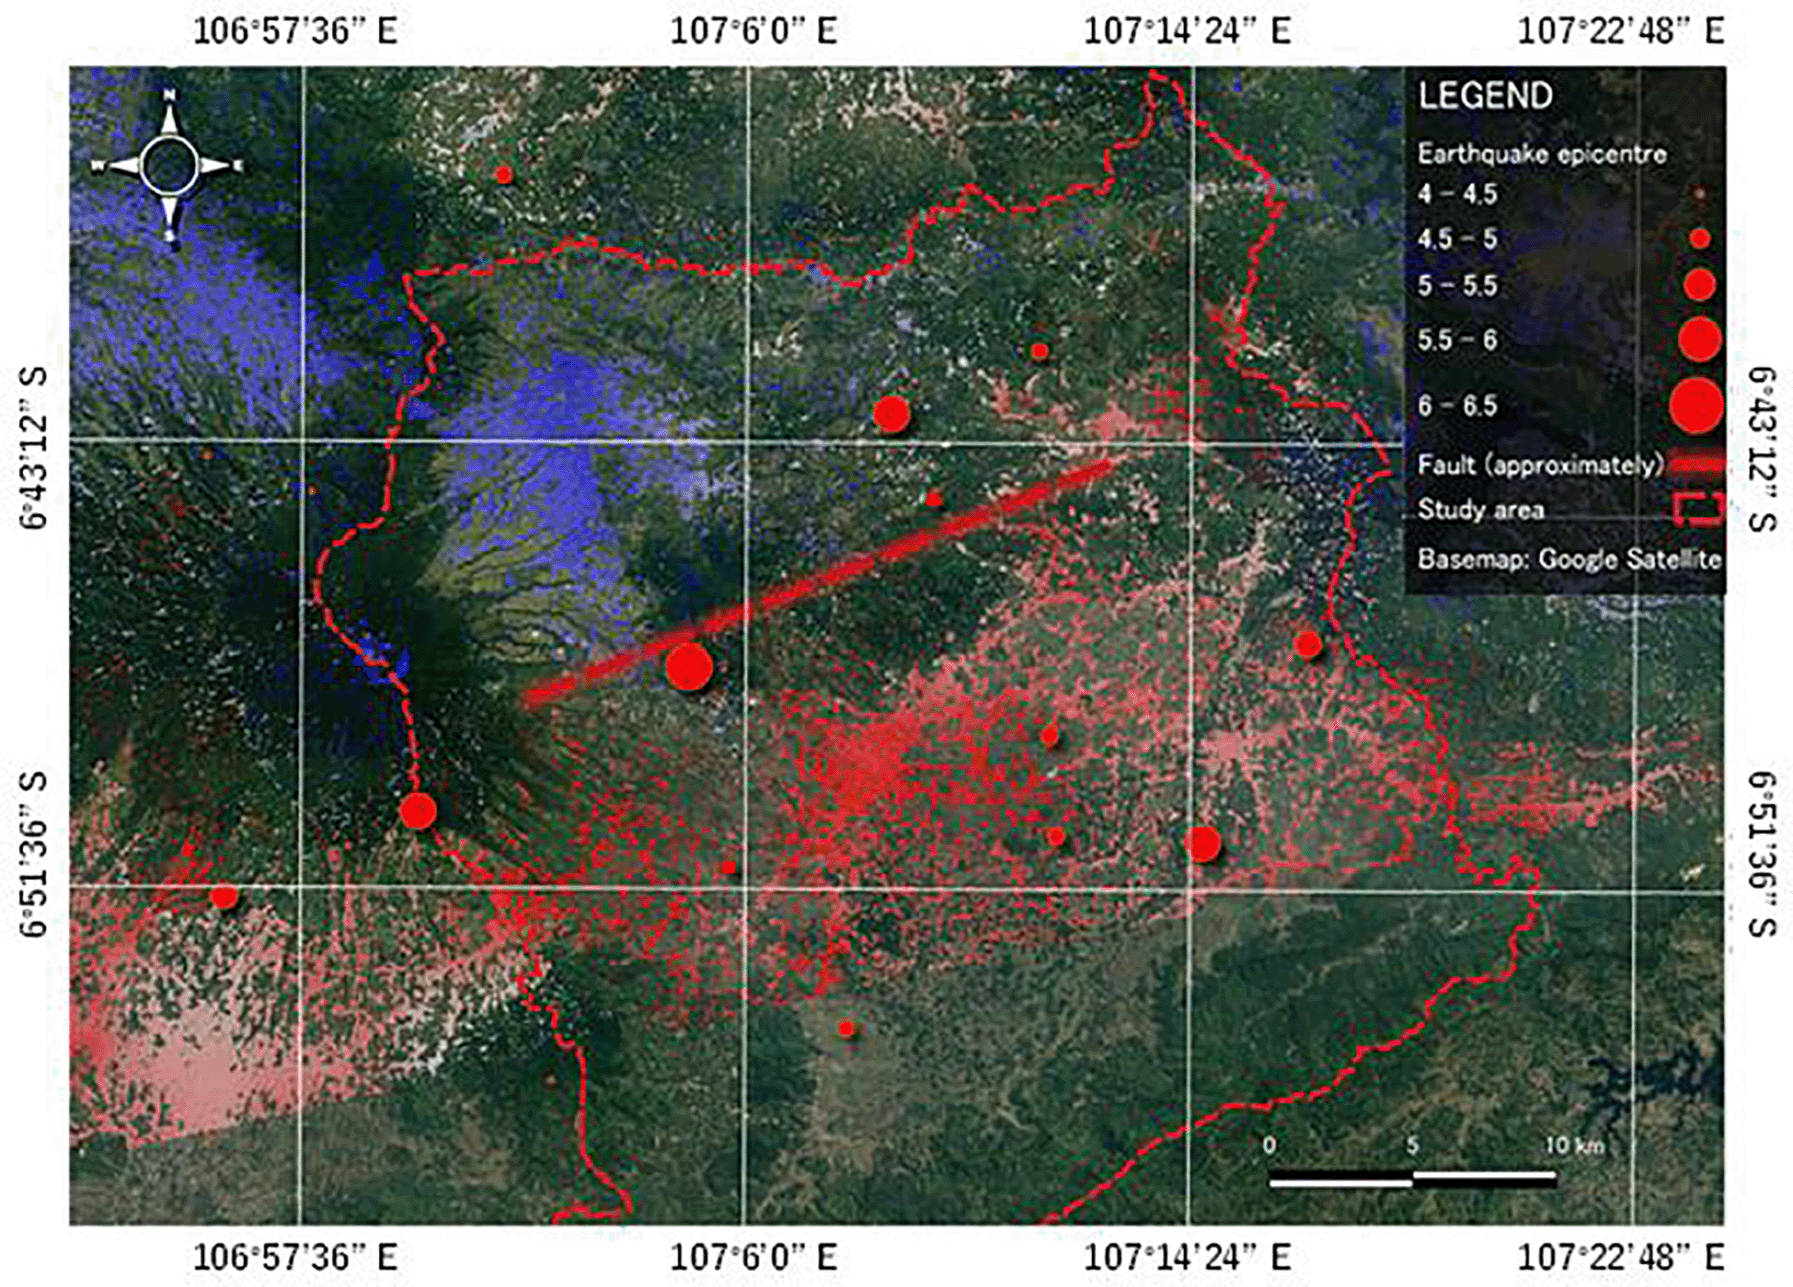
The region where the Australian plate meets the Sunda plate is known for frequent seismic activity, with significant earthquakes occurring within both plates and along their boundary. Over the past three decades, there have been notable instances of seismic events in this area (see Figure 1), making it susceptible to secondary disasters like landslides and damage to infrastructure.
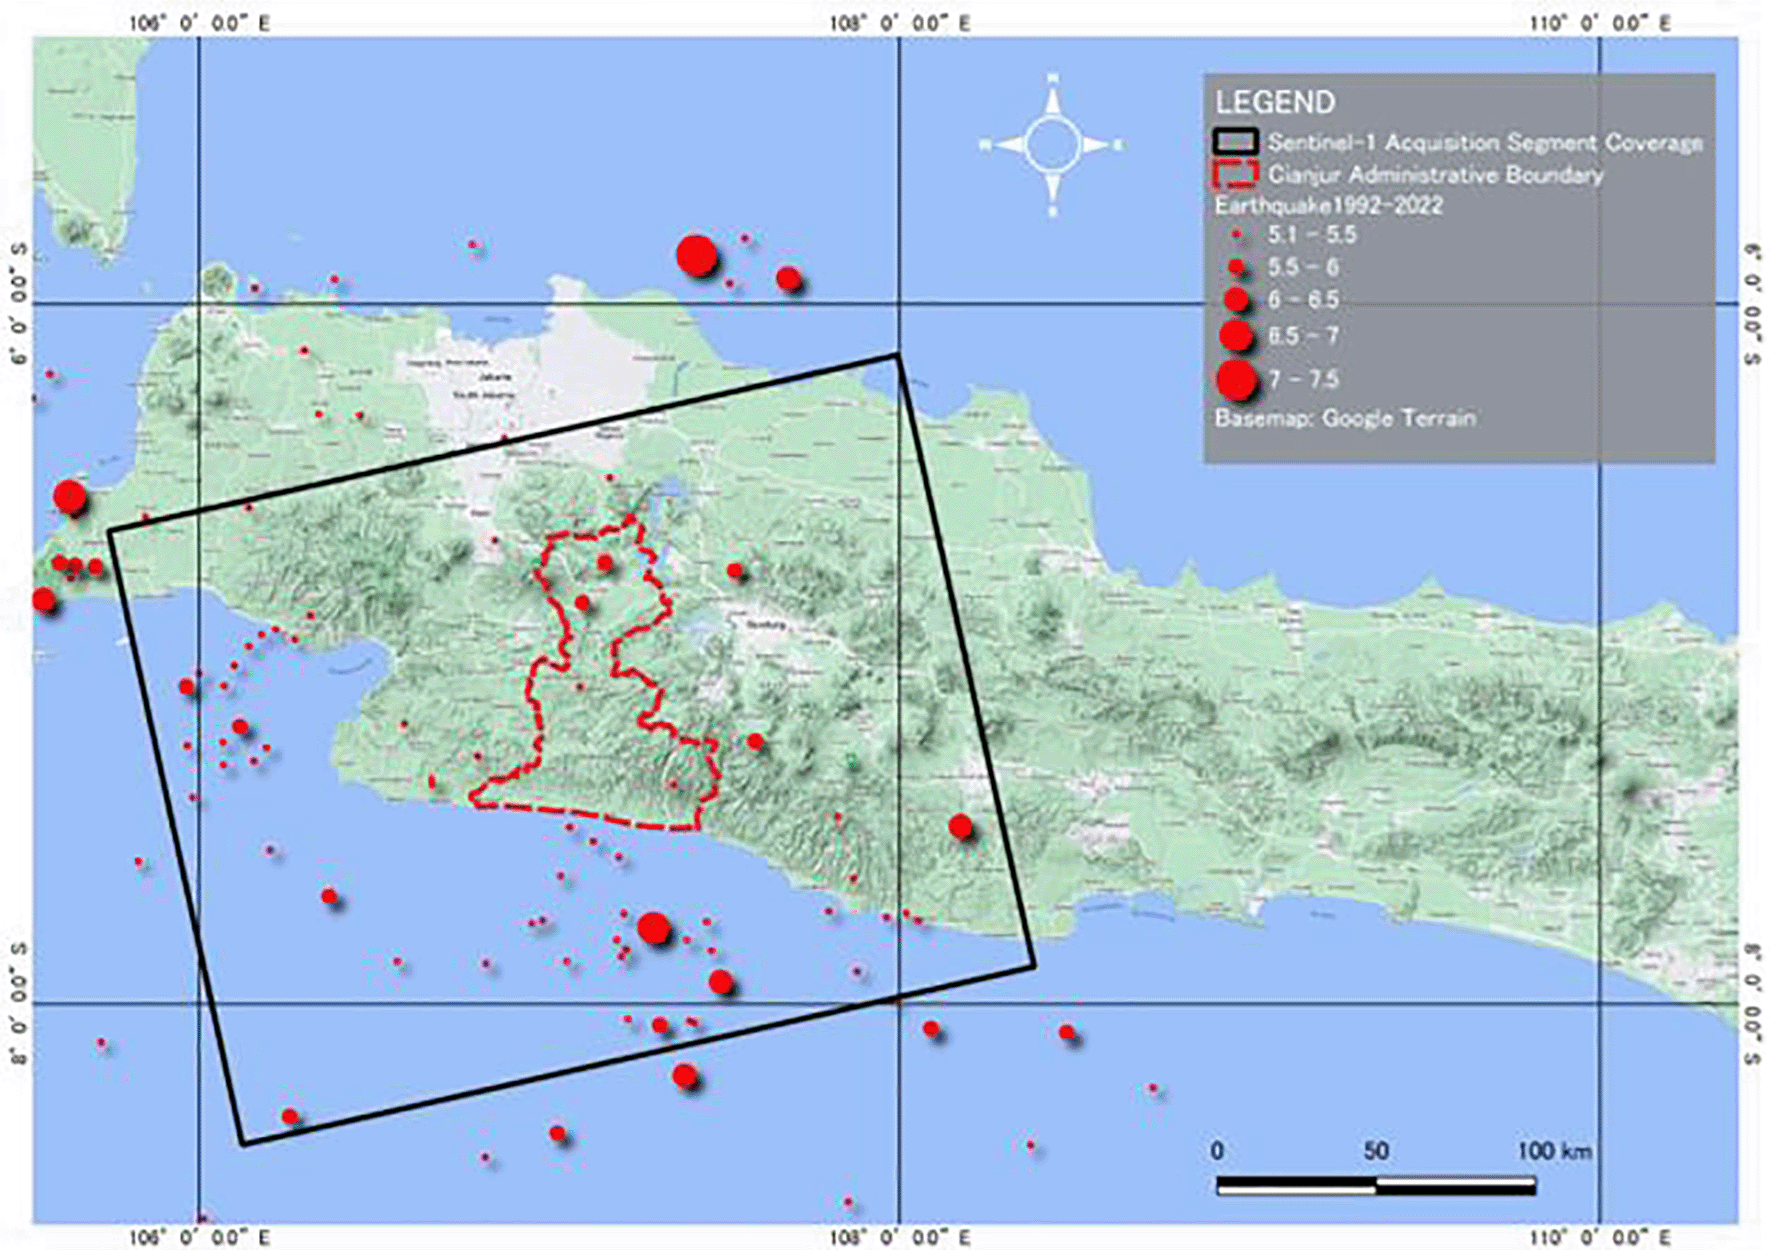
The layouting process was done using QGIS Desktop 3.22.8.
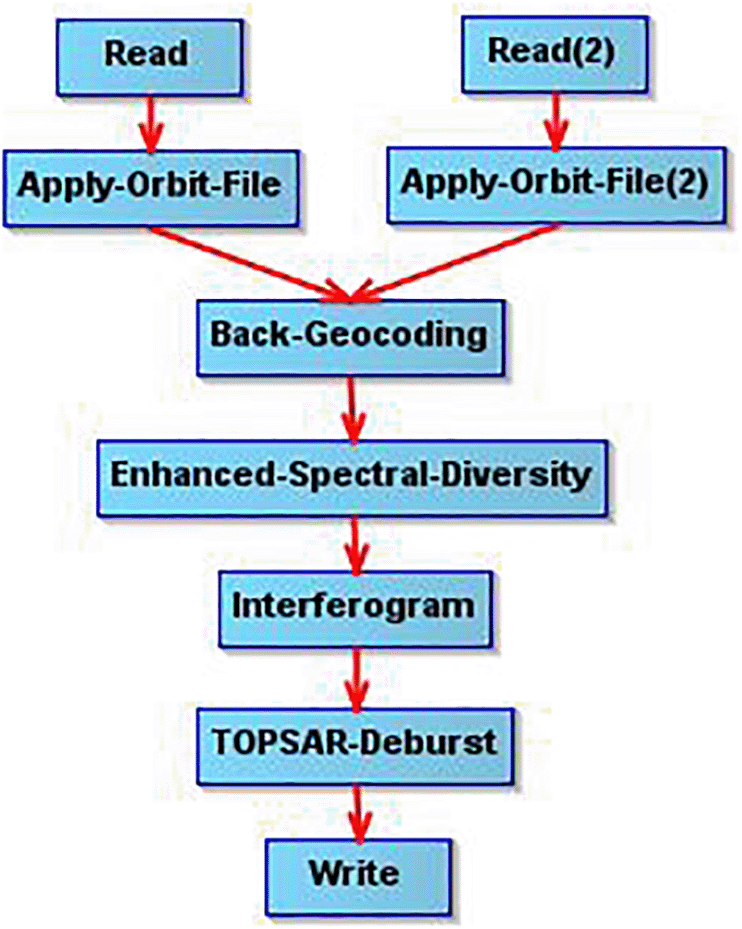
To study land deformation caused by the earthquake, we used SAR data from the Sentinel-1 satellite operated by the European Space Agency (ESA). The Sentinel-1 satellite carries a C-band SAR instrument that can be used to measure ground displacement with high spatial and temporal resolution. Some studies also showed that data from Sentinel-1 images can be used to support fault line identification in the event of major earthquake (Yang et al. 2020; Li et al. 2023; Funning and Garcia 2019; Li et al. 2021). We acquired SAR data for the Cianjur region before and after the earthquake and applied interferometric techniques using The European Space Agency’s (ESA) software, called the Sentinel Application Platform (SNAP) (McGarragh et al. 2015), to calculate the surface displacement caused by the earthquake. The data were downloaded from https://scihub.copernicus.eu/dhus/#/home. Table 1 summarises the data.
The downloaded data required pre-processing. The first step was to create a new product with a selected swath and apply the orbit file using the S1-TOPS Split operator. These pre-processes were performed for both the acquired data (before and after the earthquake). The next step was to Appy-Orbit-File and Back Geocoding which allows the co-registration of both SLC products at sub-pixel accuracy for interferometry analysis. Next, we performed the joint co-registration of Sentinel-1 (obtained from the previous step) by creating a network (graph) of images and then estimating range and azimuth offsets by solving an optimisation problem using the Enhanced-Spectral-Diversity operator of SNAP. We then performed the deburst and merge using the TOPSAR Deburst operator because IW products have three swaths and EW products have five swaths. Each sub-swath image consisted of a series of bursts, where each burst was processed as a separate SLC image. The flowchart in Figure 2. shows the pre-processing steps.
The interferogram was then computed using the input data from the stack of co-registered-debursted images. We then estimated and subtracted the topographic phase from the interferogram using the TopoPhaseRemoval operator of the SNAP software. To improve image interpretability, a multilook process was then performed to reduce the speckle noise effect inherent in the original SAR data. Finally, the Goldstein phase-filtering operator (Feng et al. 2016) was used to reduce the residues from the later process in the phase-unwrapping step and enhance the phase-unwrapping accuracy. A flowchart of interferogram computation is presented in Figure 3.
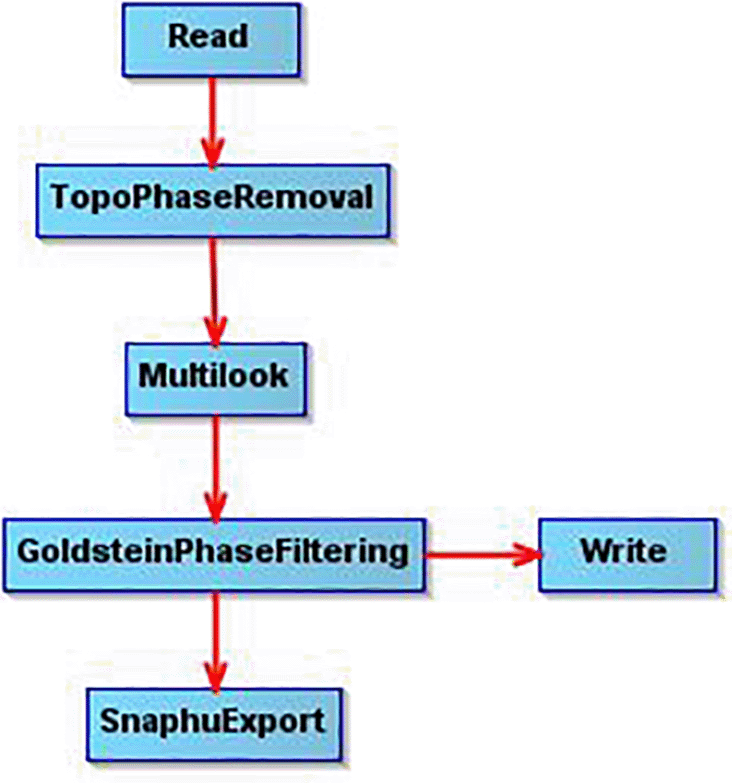
The output result from the Goldstein Phase Filtering was then exported to the Statistical-Cost, Network-Flow Algorithm for Phase Unwrapping (SNAPHU) (Zebker 2023) to unwrap the phase product. The exported result contained a configuration file with a command to call SNAPHU. This command can be extracted from the configuration file and pasted into the command line to correctly run the SNAPHU process to produce an interferogram phase map. The output from this result was then used as the input for the SNAPHU import operator.
The interferogram phase map is rich in information regarding the location of land deformation as well as the strength and direction of surface deformation. The interferogram phase map can also be used as a proxy for other earthquake-related variables such as energy generation during an event and the intensity of shaking felt throughout the impacted region. The interferogram results are shown in Figure 4.
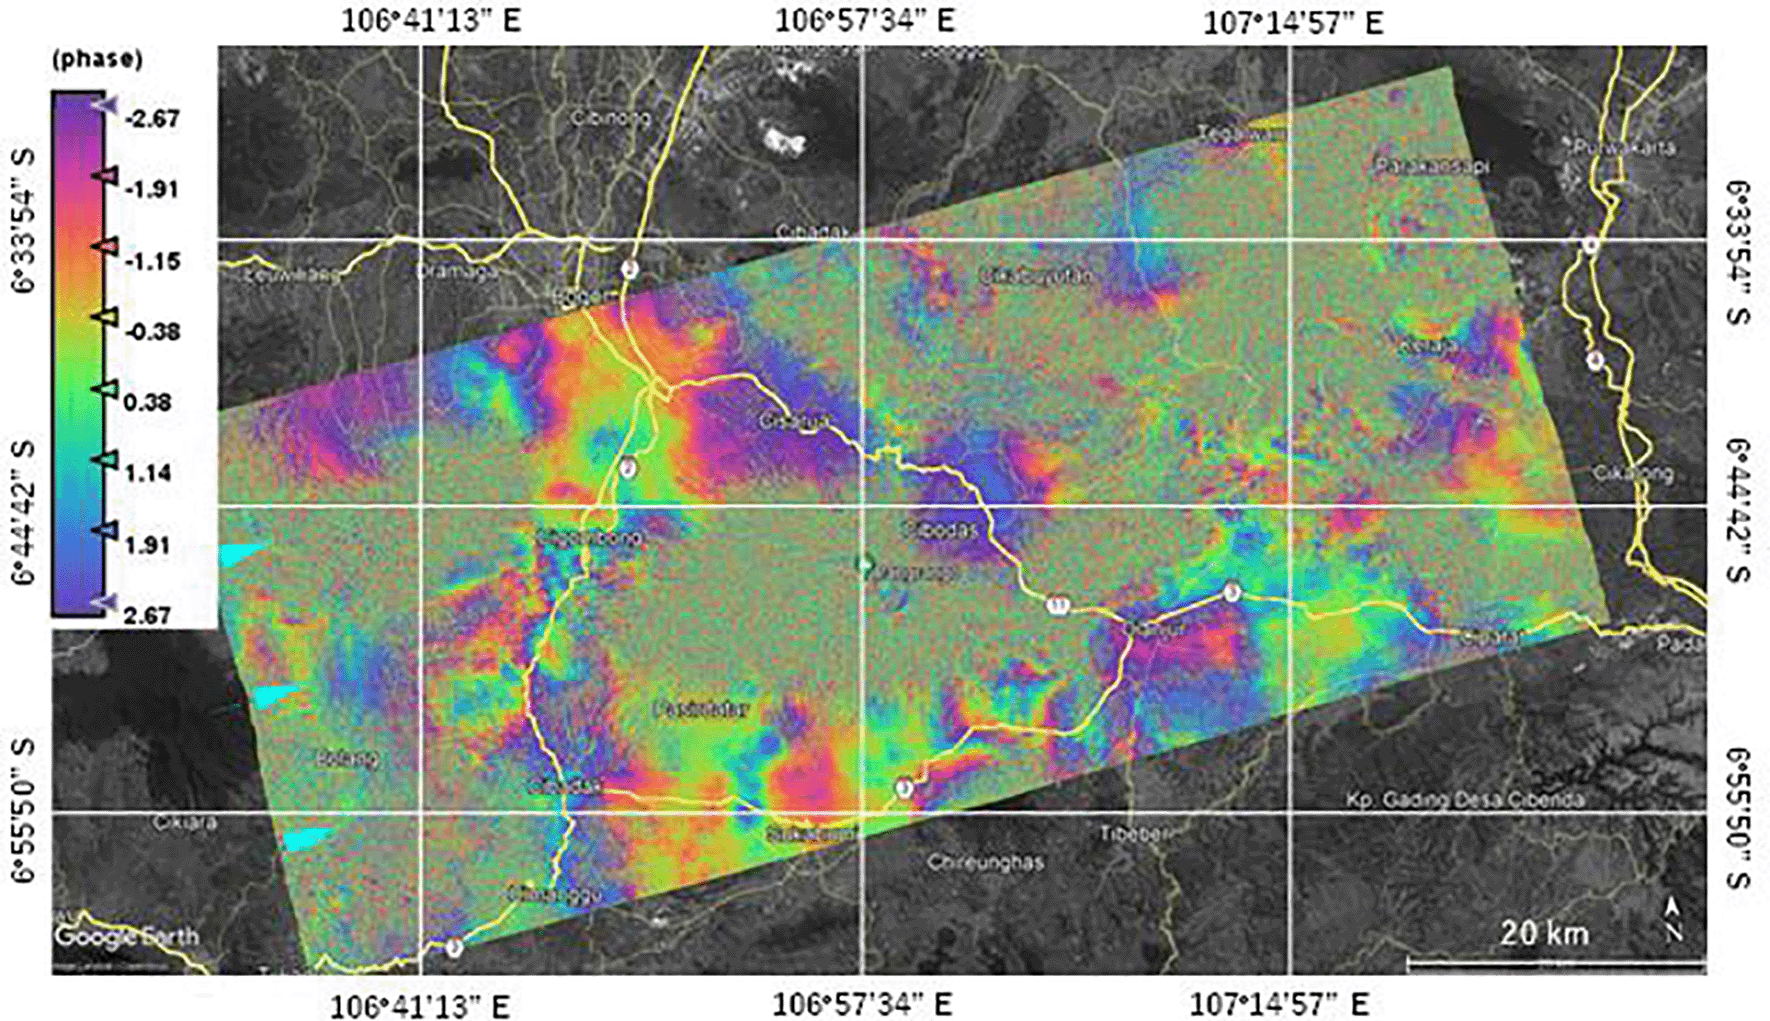
The blue arrows on the left illustrate the satellite’s antenna pointing direction. The lay outing process was done using Google Earth Pro version 7.3.6.9285 (64-bit).
Finally, the displacement map was generated using the phase-to-displacement operator of the SNAP software. To reduce bias, we stacked the coherence and displacement maps. We then masked the displacement using coherence values lower than or equal to 0.2. The displacement results before masking are shown in Figure 5.
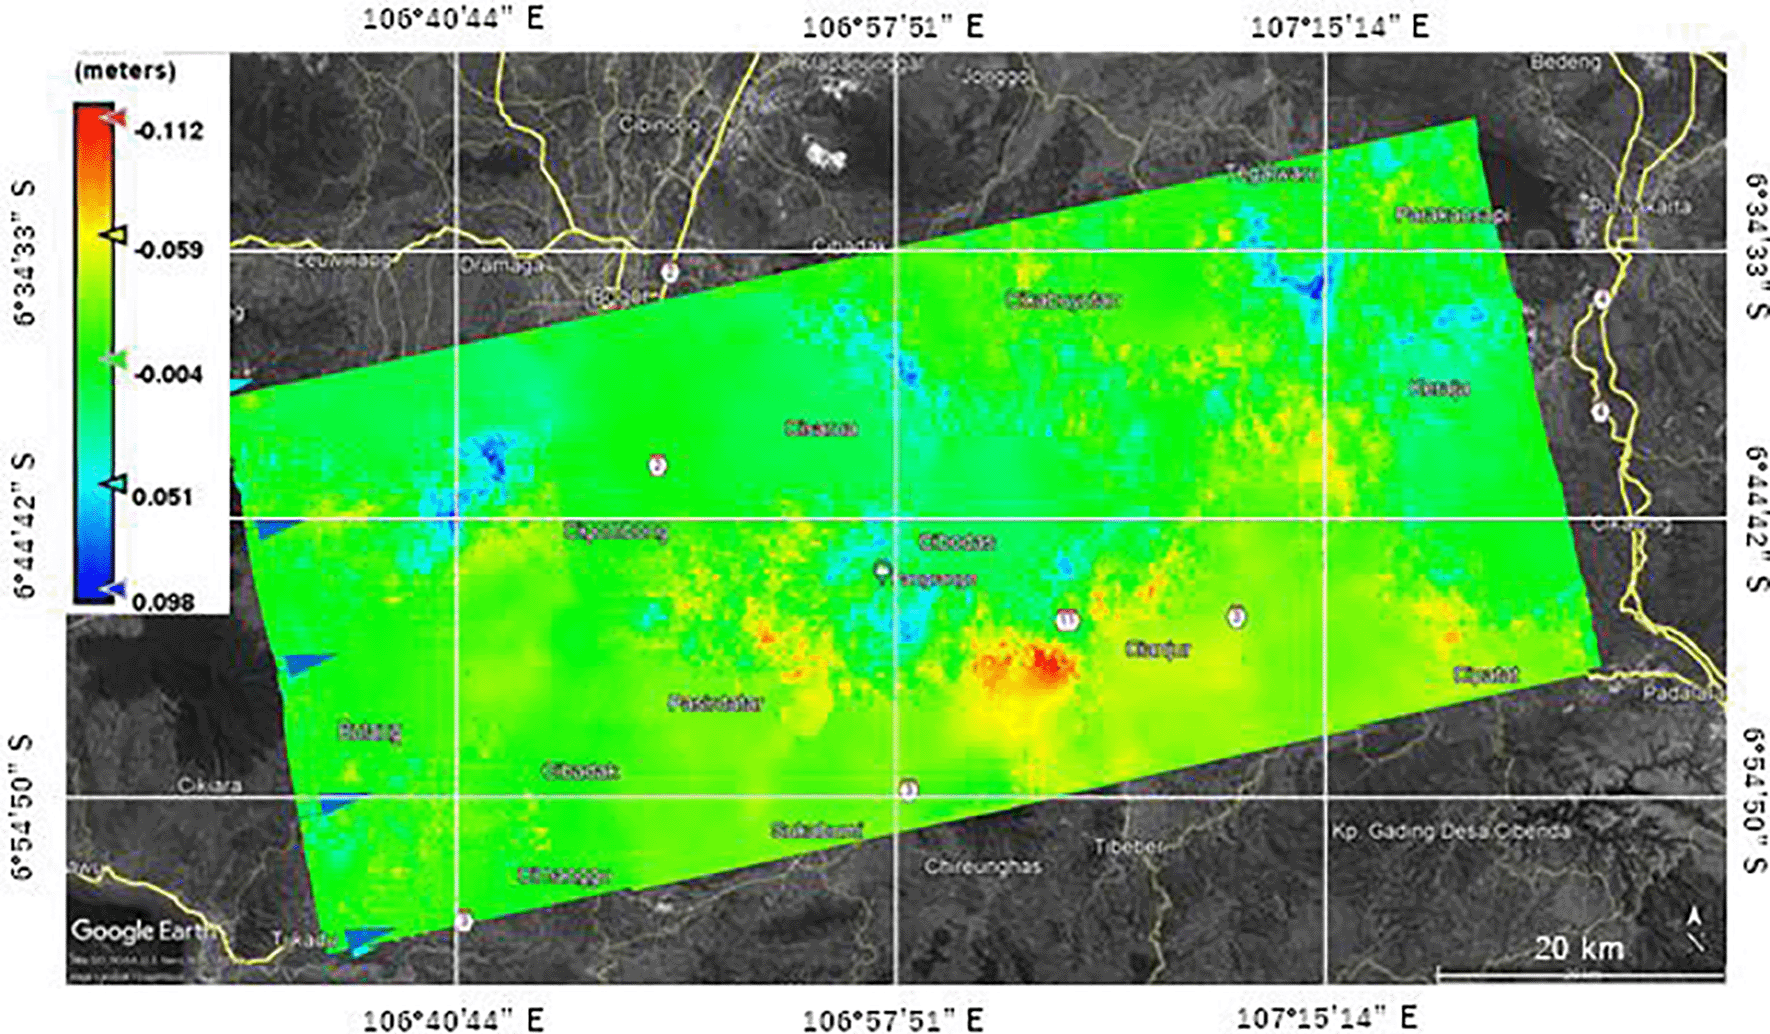
The blue arrows on the left illustrate the satellite’s antenna pointing direction. The layouting process was done using Google Earth Pro version 7.3.6.9285 (64-bit).
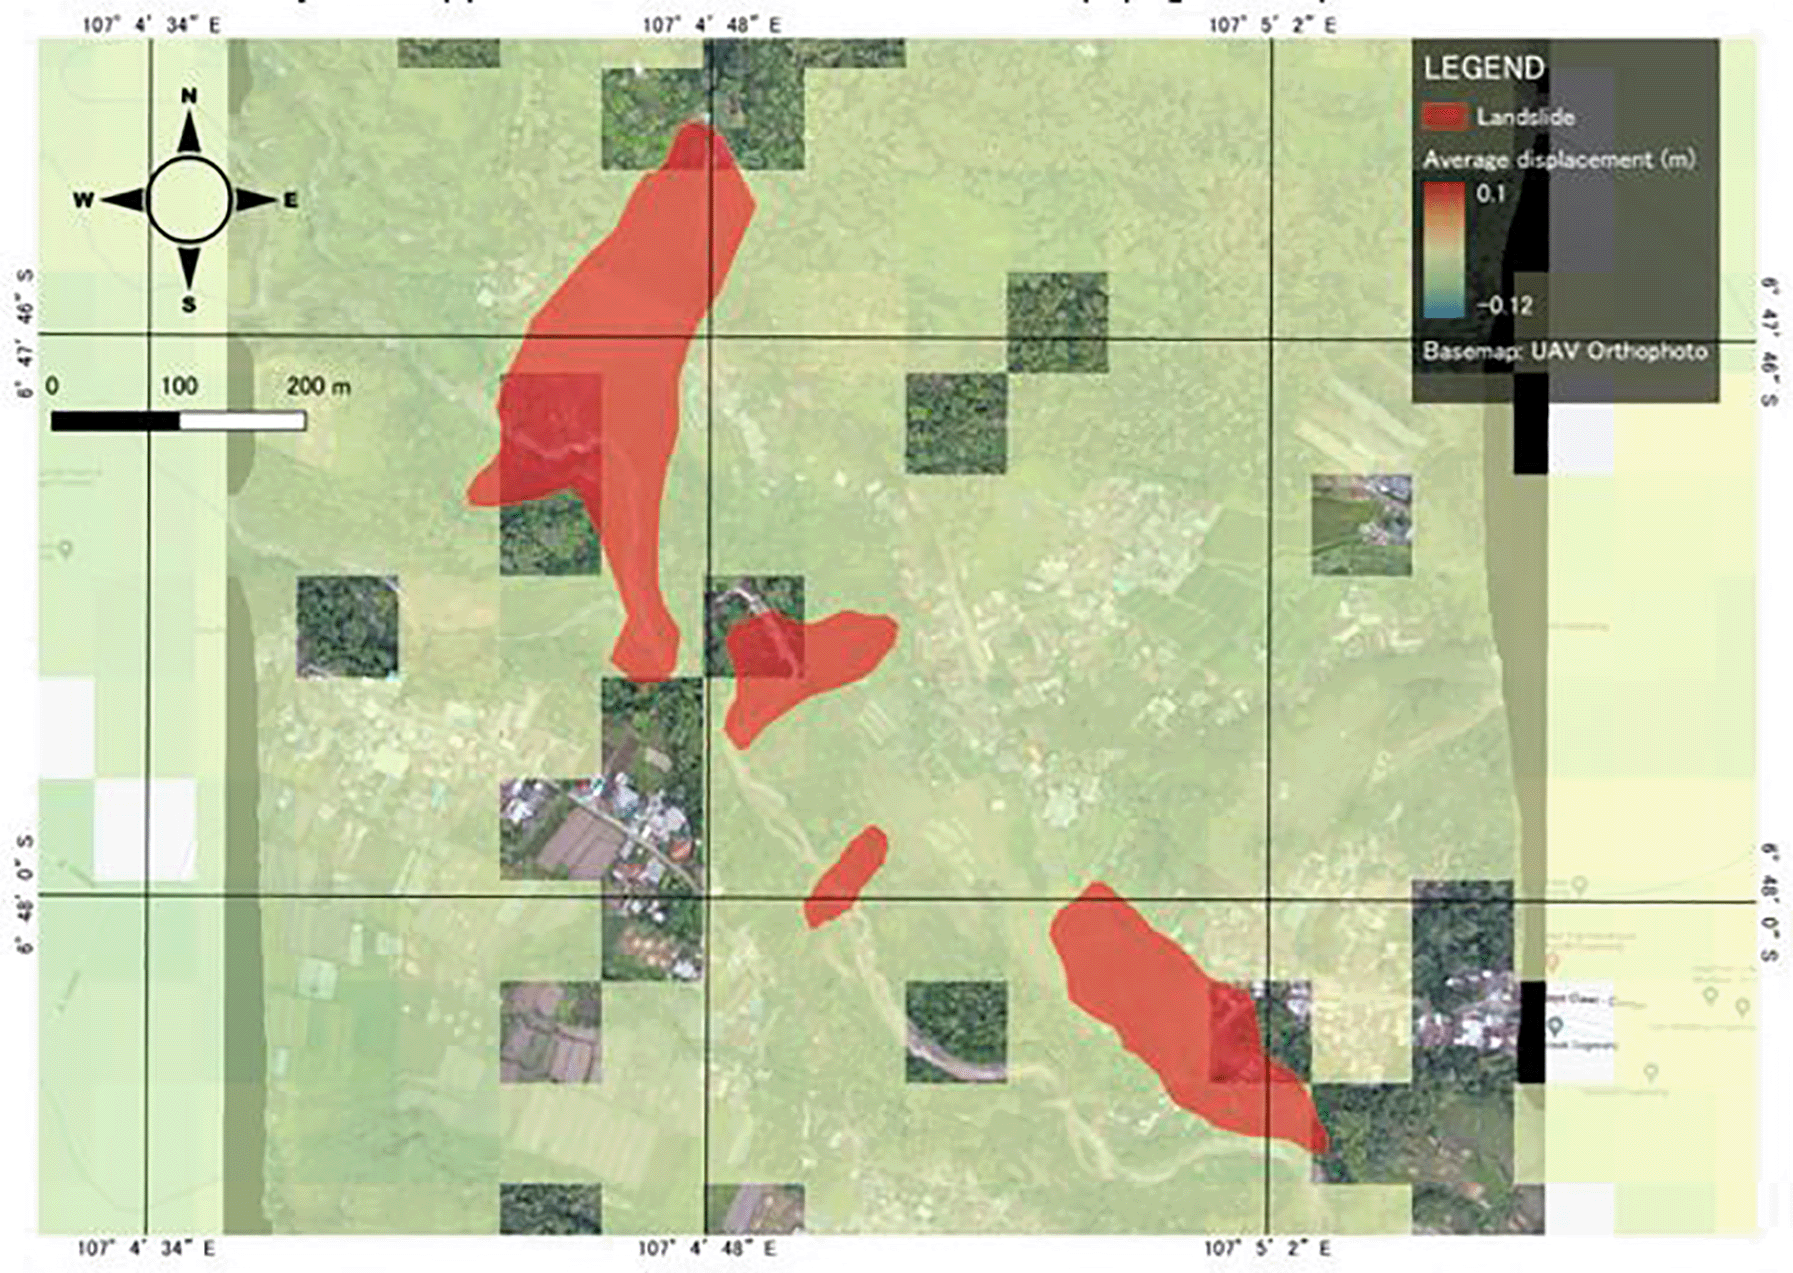
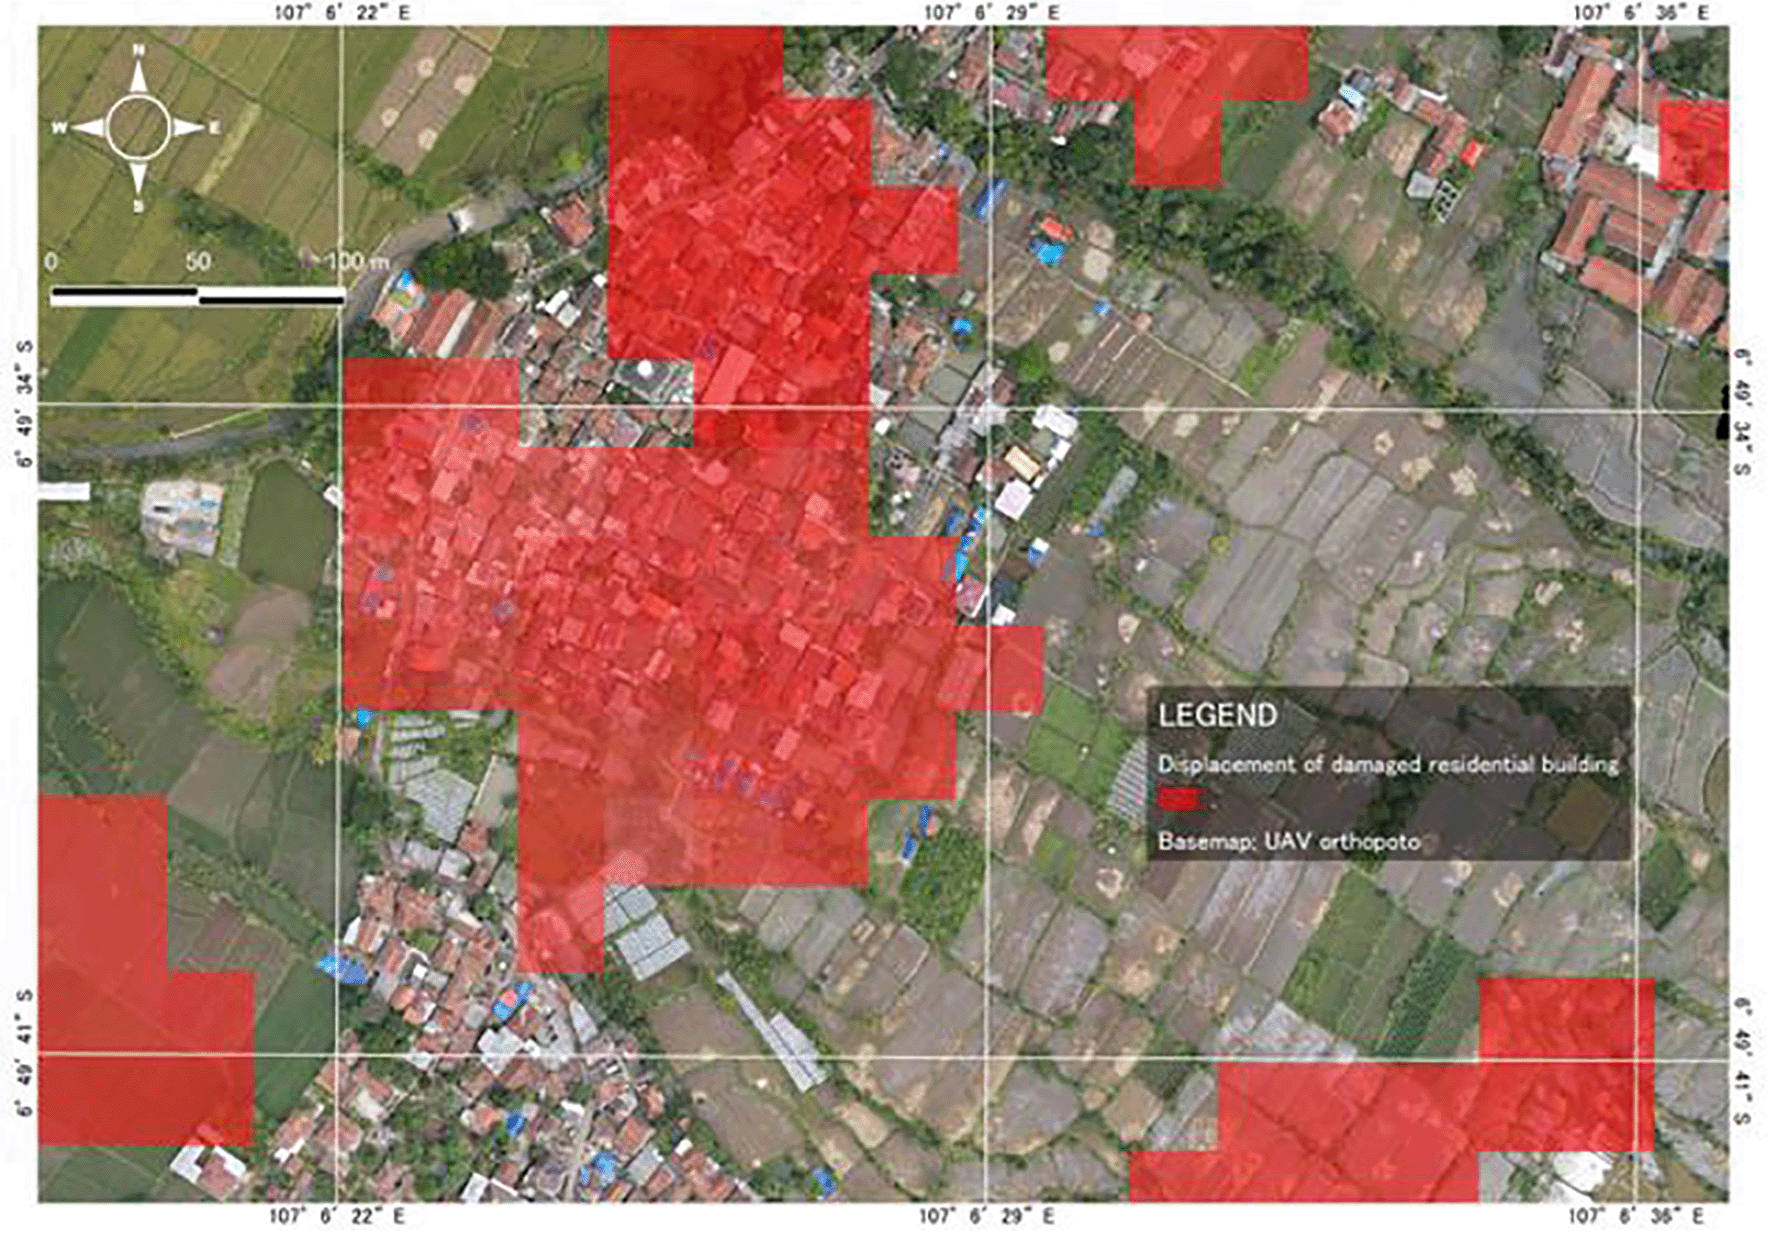
For the accuracy assessment, we compared the results with very high-resolution satellite images from the PlanetScope data. The PlanetScope dataset used in this study was acquired on 27 September 2022 (before the earthquake), and 29 November 2022 (after the earthquake). The data were downloaded from https://www.planet.com/explorer/. The images were then classified using a supervised classification algorithm. Classification was performed using the Random Forest algorithm, which has been widely applied for classification techniques (Breiman 2001; Purwanto et al. 2023; Gounaridis, Apostolou, and Koukoulas 2016; Tempa and Aryal 2022), with the Semi-automatic Classification Plugin in QGIS. The input data are the spectral bands of the satellite images, and the output data are the landslides as proof of land deformation due to the earthquake. Furthermore, we also utilised an aerial orthophoto product acquired using an Unmanned Aerial Vehicle (UAV) to acquire the data of damaged residential buildings at a higher spatial resolution.
Our analysis of SAR data revealed significant land deformation in the Cianjur region following the earthquake. Figure 6. shows a map of the surface displacement caused by the earthquake, with the colours indicating the magnitude of the displacement. Highest displacements were observed in the south-eastern and north-western parts of the study area, with displacements of up to 9.8 cm (uplift) and 11 cm (subsidence).
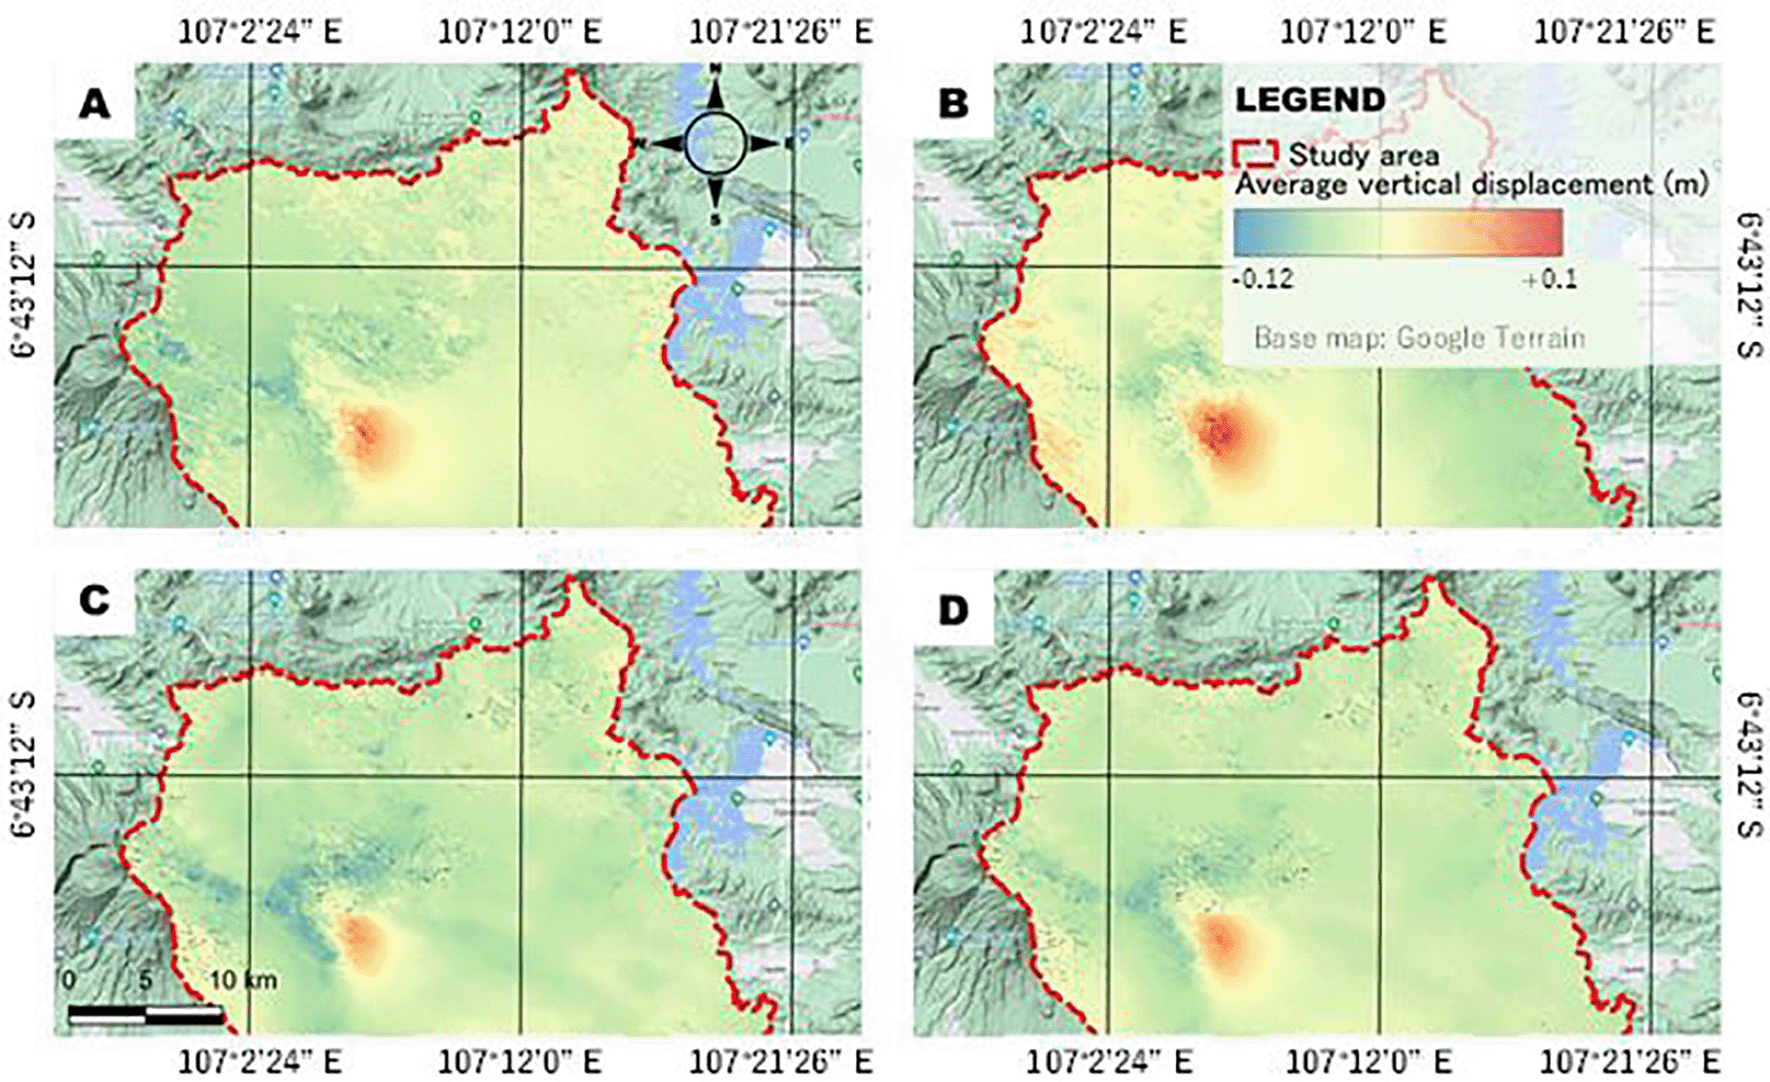
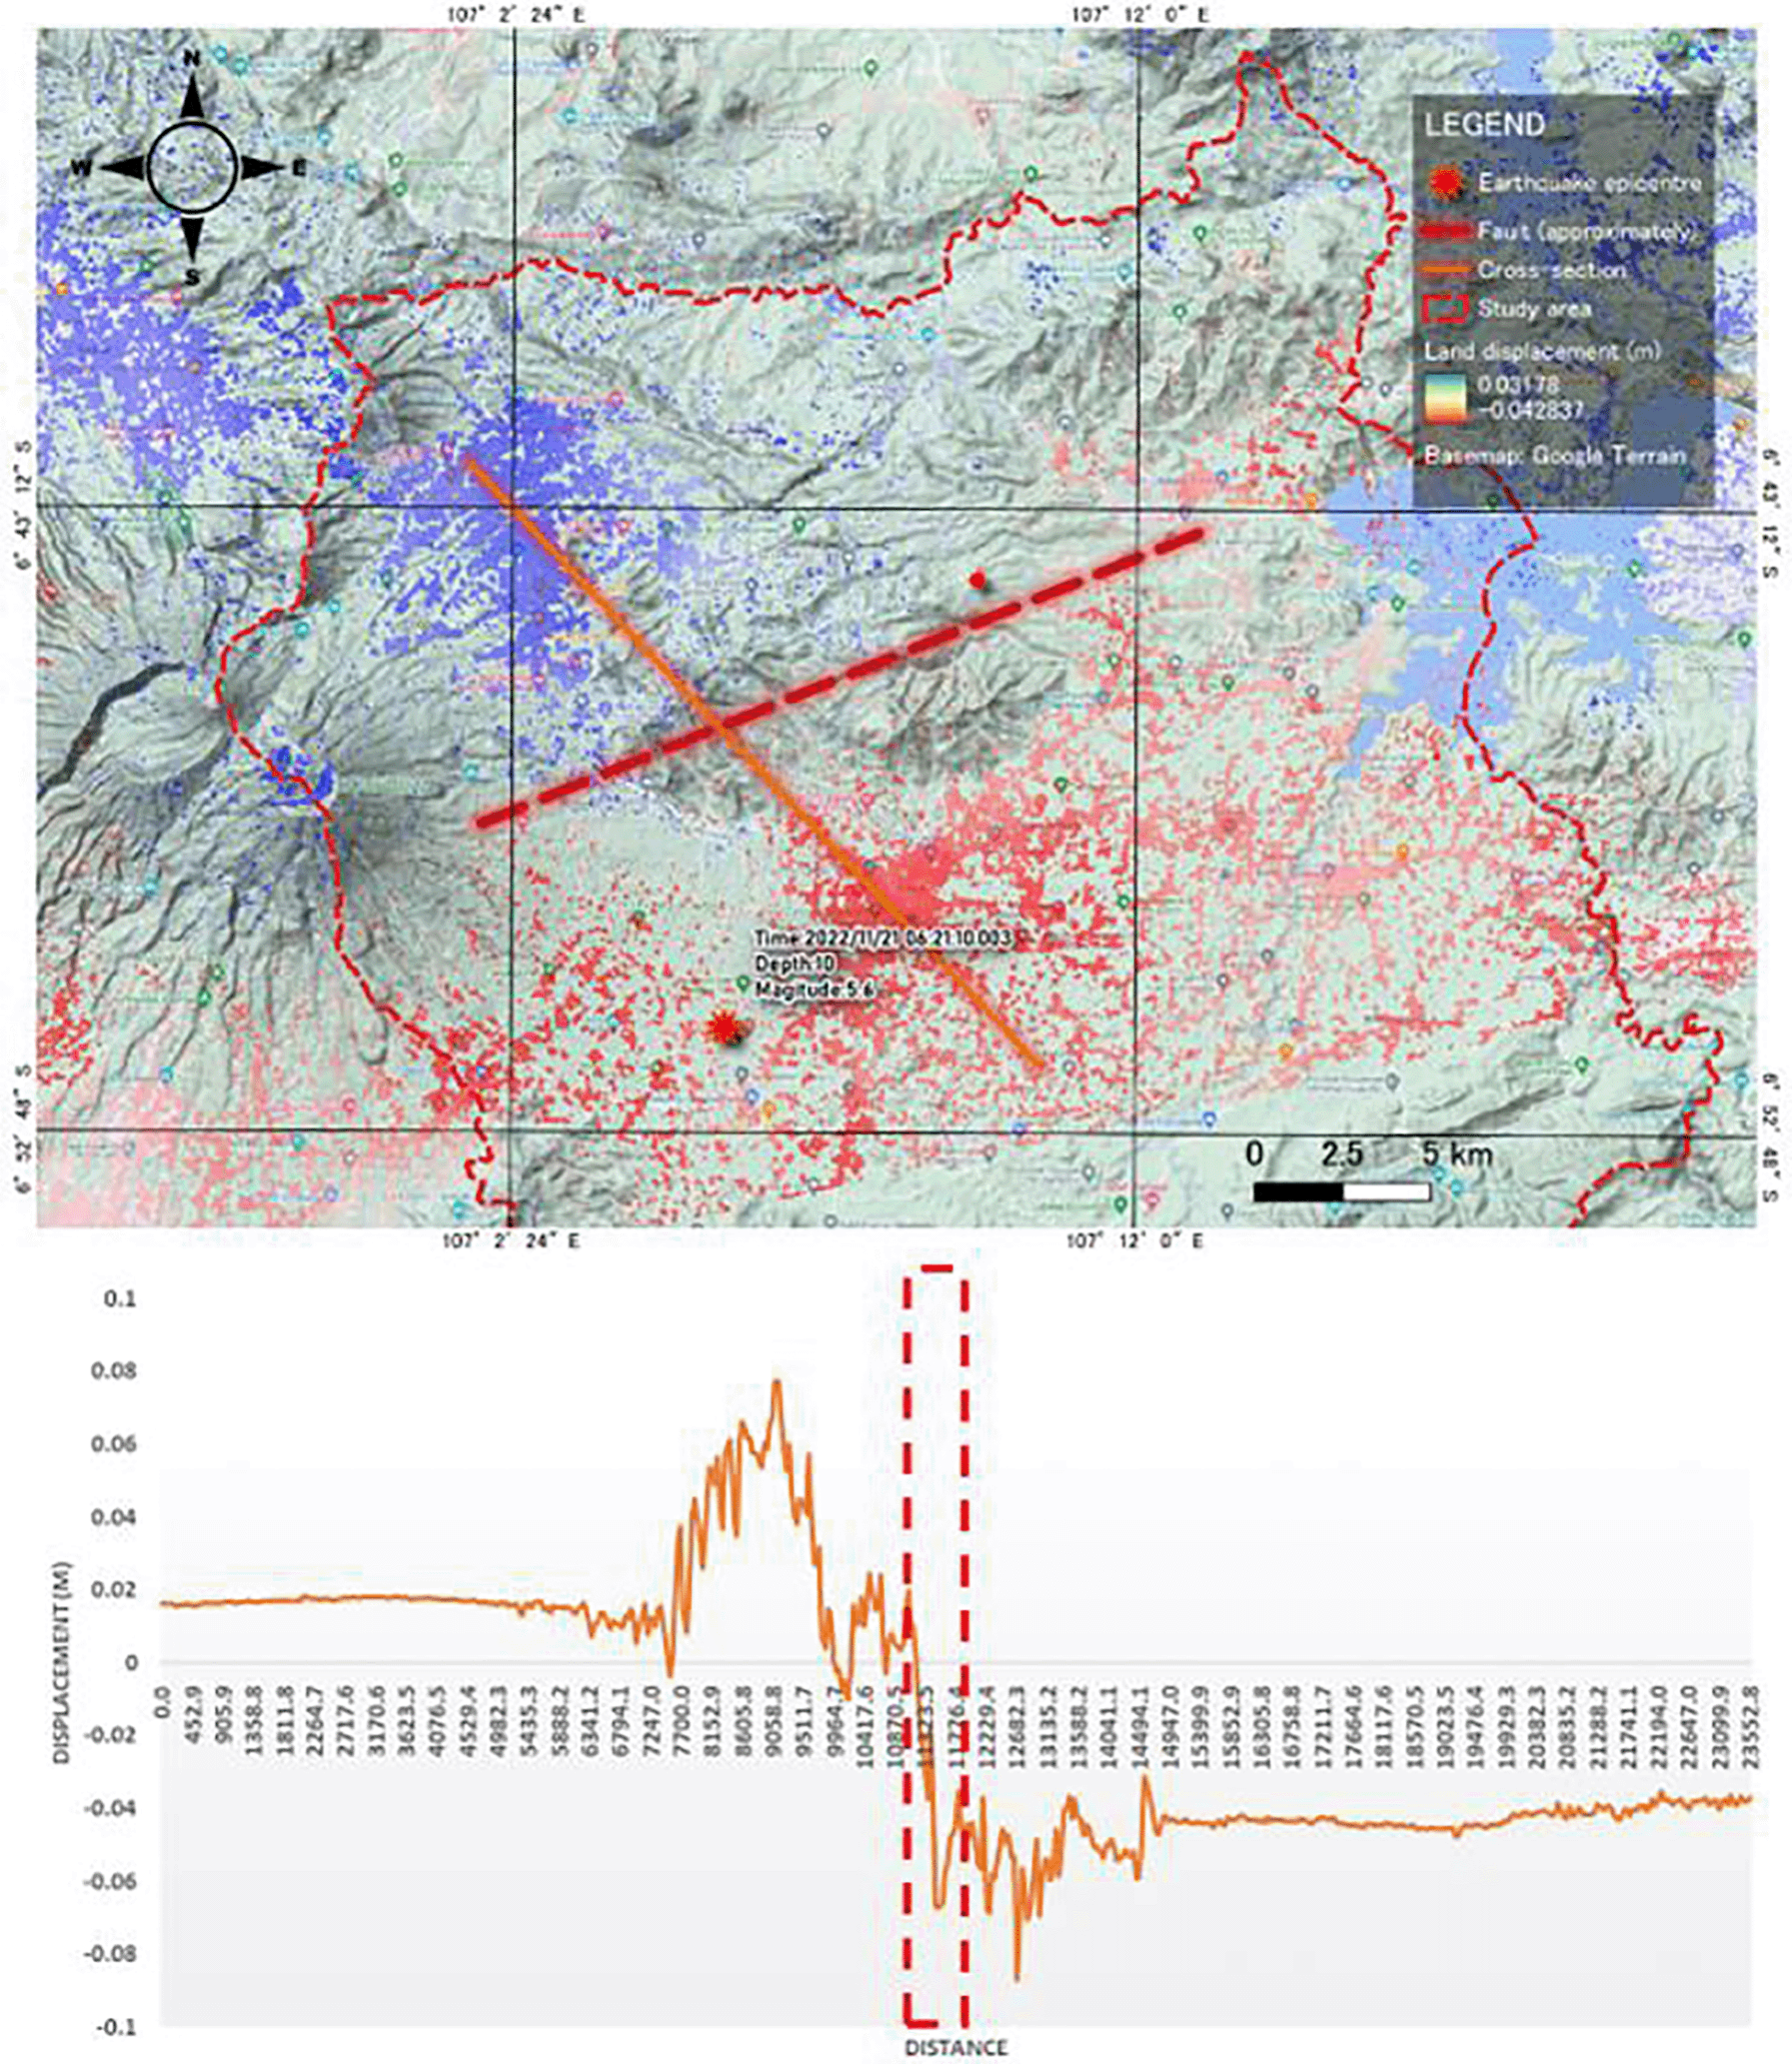
The results show a high possibility of faults occurring around the study area. As shown in Figure 7, the northwest and southeast parts experienced opposite effects. The northwest part experienced land uplift, whereas the southeast part experienced land subsidence. Moreover, the fault line approximately aligns with the historical epicentre of earthquakes, forming a straight line from the South-West to the North-East, as illustrated in Figures 7 and 8. Therefore, we drew a line across the location of a possible fault which has never been mapped.
Colours indicate the magnitude of the displacement, with blue indicating uplift and red indicating land subsidence. The layouting process was done using QGIS Desktop 3.22.8.
The approximate fault line is illustrated within the red-dashed polygon boundary.
Land displacement was observed in the northern (uplift) and southern (subsidence) part of the fault, indicating that the possible direction of the fault is east-west. Then epicentre location of historical earthquakes formed a seemingly straight east-west direction fault, as shown in Figure 7. Such method of fault line determination from interferograms have also been used in other studies (Li et al. 2021, 2023).
Furthermore, we created a cross-sectional line to extract the value of land deformation. The line length was 24 km from the north-western to the south-eastern part of the study area. There was a displacement of approximately 8 cm around the fault line (Figure 8).
Figure 9 shows the landslide as proof of land deformation. This was overlapped with the observed land deformation map produced using the InSAR technique. Many residential buildings and public infrastructure were damaged observed using aerial orthophotos, and the locations exactly overlapped with the land deformation map (Figure 10).
The layouting process was done using QGIS Desktop 3.22.8.
The layouting process was done using QGIS Desktop 3.22.8.
Our results show that the earthquake of magnitude 5.6 that struck Cianjur on 21 November 2022 caused significant land deformation in the region. The highest displacements were observed in the south-eastern and north-western parts of the study area, with some areas experiencing land uplift of up to 9.8 cm and subsidence of up to 11 cm.
A report by the Center for Volcanology and Geological Hazard Mitigation of Indonesia stated that the most affected location, seeing massive damage, was the Cugenang District, especially the villages of Gasol and Sarampad. This is due to the rock layers of old volcanic products that have experienced weathering, and buildings that are not designed to be earthquake-resistant (Center for Volcanology and Geological Hazard Mitigation 2022), with additional possibility of vertical deformation. This report is consistent with our findings, where massive landslides and damaged residential infrastructure were found in the Cugenang District (Figures 11 and 12). Considering the seriousness of the impact, the use of InSAR for regular monitoring in this area is highly recommended to provide detailed information that is required for education purpose, as well as mitigation measure in time of disaster. InSAR can be used to study wider area where estimation on heavily impacted areas can be obtained, so that the use of ground radar can be more efficient as it become more directed. Then, for verification of fault line identification using images from Sentinel-1, the highest accuracy is provided by ground survey. However, the two additional datasets from PlanetScope satellites and orthophoto obtained from UAV as is discussed in this study also significantly improve the confidence level of fault lines identification.
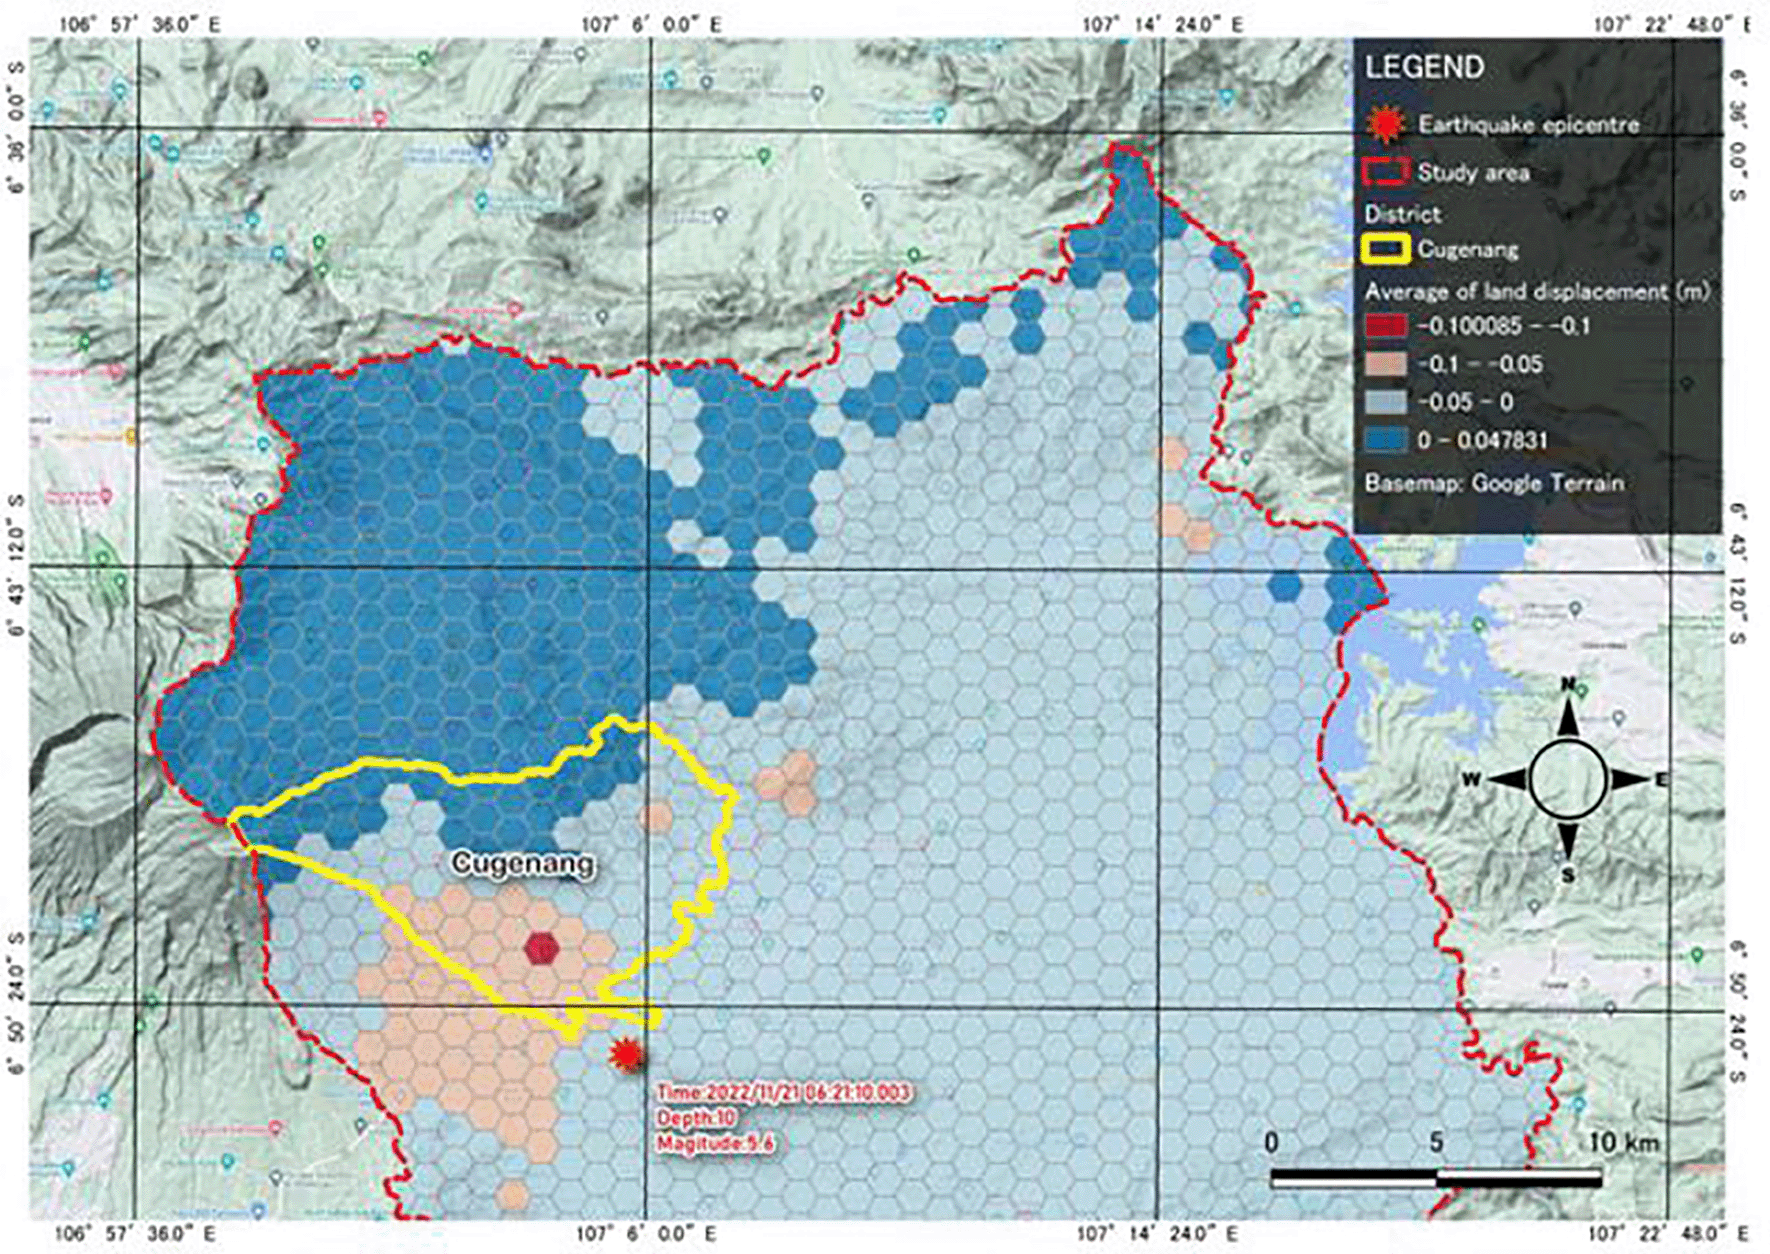
The zonal statistic operator of QGIS was used to calculate the average values of land displacement. The algorithm calculates statistics of the land displacement raster layer of an overlapping hexagon vector layer. The layouting process was done using QGIS Desktop 3.22.8.
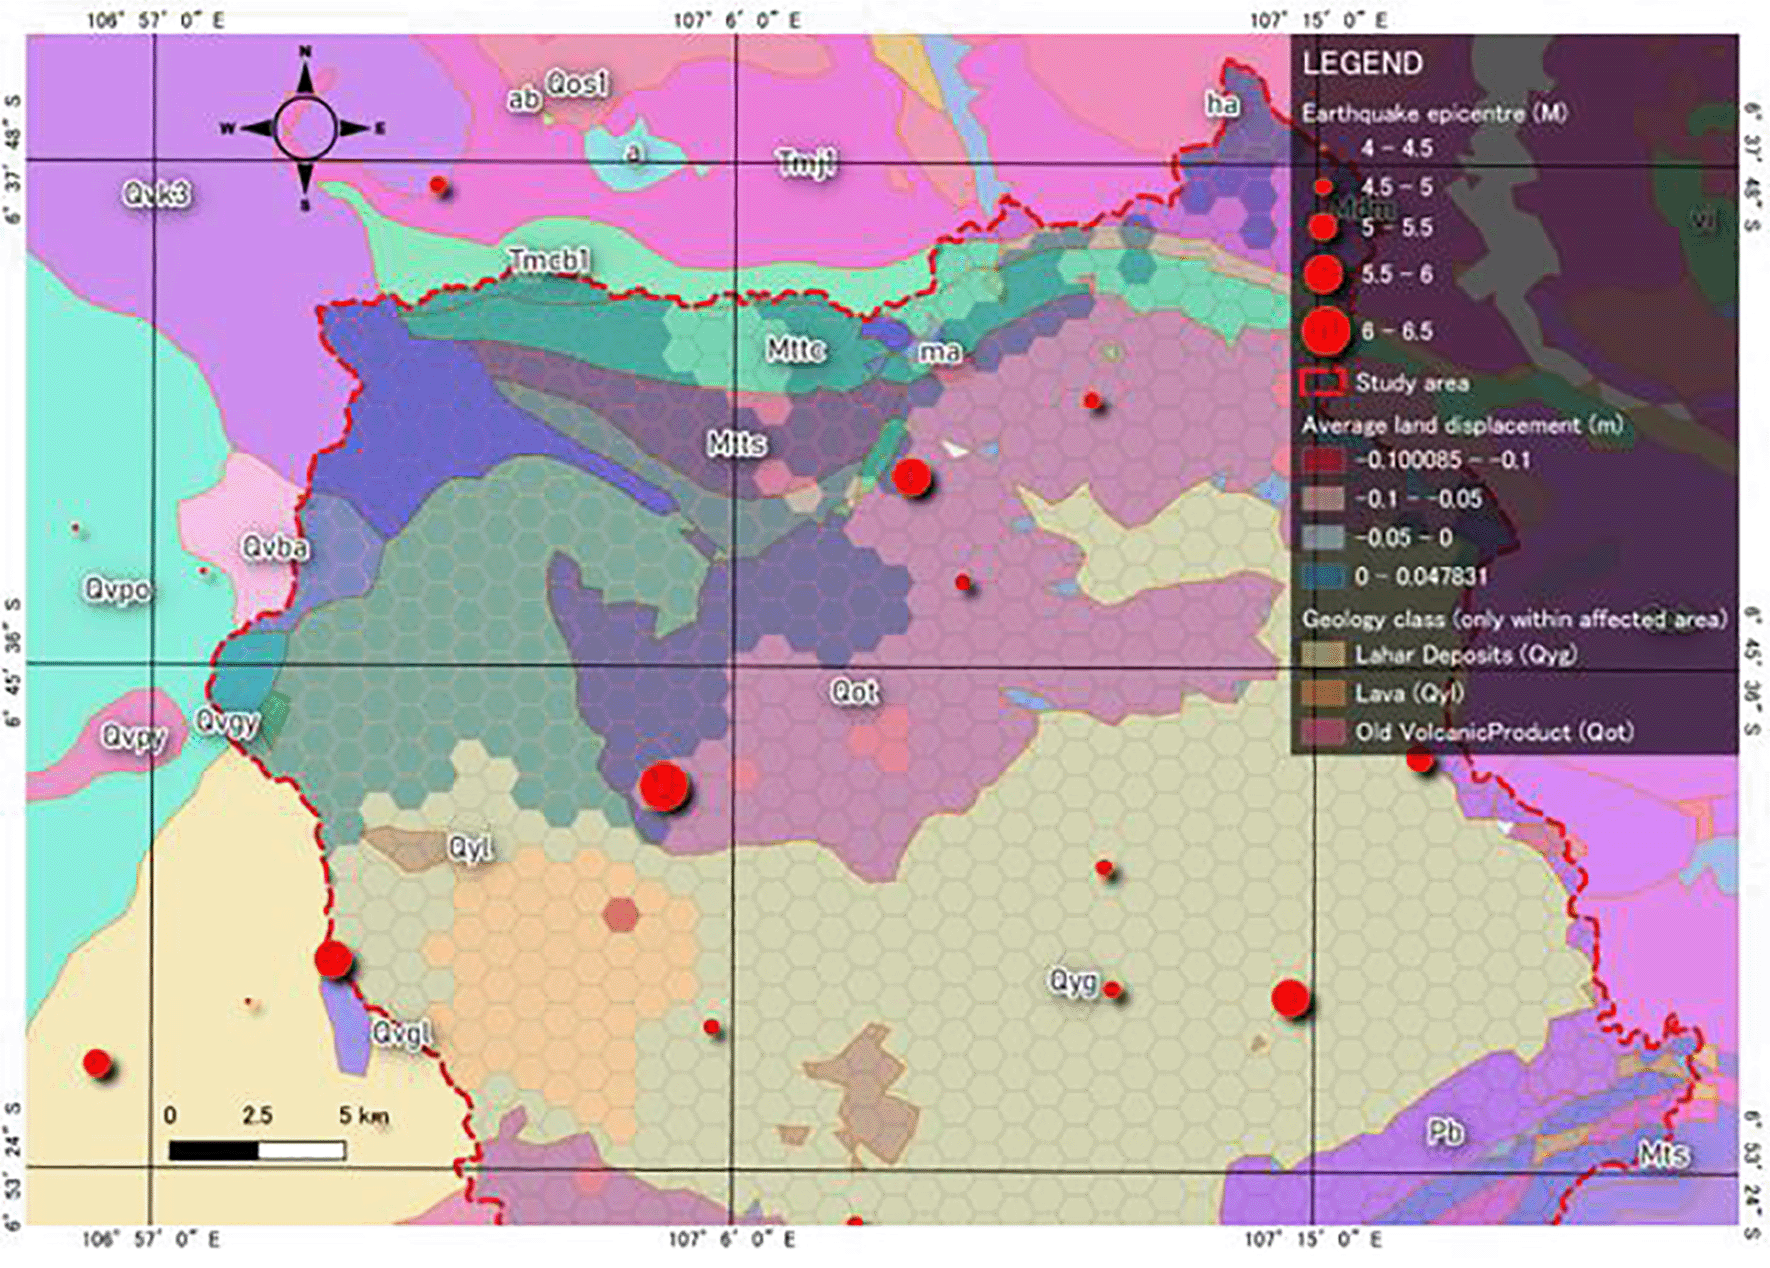
The old volcano products, lava, and lahar deposits (symbolized with Qot, Qyl, Qyg, respectively) that have experienced weathering led to massive collapsed buildings in the study area. The visualization was designed using QGIS Desktop 3.22.8.
However, this study has some limitations. For example, the detected land deformation can be due to other changes not related to the earthquake, since a large part of the study area is cultivated, for example paddy fields are present in the study area. Furthermore, some densely vegetated areas may produce false positive results. Changes in these areas should not be considered as land deformation. The approximate fault line also requires further investigation using ground-based techniques.
Also, there are limitations in the use of InSAR for land subsidence mapping and monitoring. One limitation is the need for a stable reference surface, known as the “interferometric baseline”, to accurately measure subsidence (Antonova et al. 2018). This can be challenging in areas with complex topographies or large variations in the surface reflectivity. Another limitation is that atmospheric effects are one of the limiting error sources in repeat-pass InSAR measurements. InSAR is sensitive to atmospheric effects, such as changes in temperature and water vapour, which can introduce errors in the measurements of ground deformation (Ding et al. 2008).
A subsequent limitation is the need for multiple satellite passes in order to generate an interferogram, which can limit the temporal resolution of InSAR measurements.
In this study, we used multisensor and multitemporal data to investigate land deformation in Cianjur, West Java, following an earthquake of magnitude 5.6 that occurred on 21 November 2022. Our results show that the earthquake caused significant land deformation in the area, with surface displacements of uplift of up to 9.8 cm and land subsidence of up to 11 cm in some areas.
We also found that deformation was primarily concentrated in the southeastern and northwestern parts of the study area. The earthquake led to secondary disasters such as landslides and collapsed residential buildings. This is due to a combination of geological factors and inadequate building structures.
We recommend that local and national governments conduct regular monitoring of the study area using InSAR, supported by ground-based techniques to track changes in land deformation over time and assess the effectiveness of any mitigation measures. For future research, possibility of using cloud-based processing system is important to be explored to improve the processing time, so that faster observation result can be generated to provide a timelier recommendation in time of disaster mitigation.
| Views | Downloads | |
|---|---|---|
| F1000Research | - | - |
|
PubMed Central
Data from PMC are received and updated monthly.
|
- | - |
Provide sufficient details of any financial or non-financial competing interests to enable users to assess whether your comments might lead a reasonable person to question your impartiality. Consider the following examples, but note that this is not an exhaustive list:
Sign up for content alerts and receive a weekly or monthly email with all newly published articles
Already registered? Sign in
The email address should be the one you originally registered with F1000.
You registered with F1000 via Google, so we cannot reset your password.
To sign in, please click here.
If you still need help with your Google account password, please click here.
You registered with F1000 via Facebook, so we cannot reset your password.
To sign in, please click here.
If you still need help with your Facebook account password, please click here.
If your email address is registered with us, we will email you instructions to reset your password.
If you think you should have received this email but it has not arrived, please check your spam filters and/or contact for further assistance.
Comments on this article Comments (0)