Keywords
Breast cancer, multi-omics study, self-organizing maps
The subtypes of breast cancer exhibit diverse histology, molecular features, therapeutic response, aggressiveness, and patient outcomes. Multi-omics high-throughput technologies, which are widely used in cancer research, generated waste amounts of multimodal omic datasets calling for new approaches of integrated analyses to uncover patterns of transcriptomic, genomic, and epigenetic changes in breast cancer subtypes and connect them to disease clinical characteristics.
Here, we applied multi-layer self-organizing map (ml-SOM) algorithms to PAM50-classified TCGA breast cancer samples to disentangle the diversity of the effects of gene expression, methylation, copy number, and somatic single nucleotide variation in the disease subtypes. Furthermore, we studied the association of perturbed gene modules with survival, prognosis, and other clinical characteristics.
Our findings highlight the power of multi-omic analyses to offer a better understanding of the molecular diversity of breast cancer subtypes compared to single-omic analyses. Moreover, they highlight the complex subtype-characteristic associations between gene expression and epigenetic/genomic factors and their implications for survival and clinical outcomes.
Breast cancer, multi-omics study, self-organizing maps
Breast cancer is the most common cancer worldwide, with 7.8 million women alive as of the end of 2020 who had received a diagnosis within the previous five years. It represents a diverse group of cancers of mammary glands characterized by considerable heterogeneity of morphological, genomic, epigenetic, transcriptomic, and proteomic features that drive tumor progression, treatment resistance, and aggressiveness.1–4
The current molecular classification of breast cancer includes stratification by expressed markers (ER, PR, HER2).5 Recently, a new gene expression-based molecular subtyping of breast cancers has been proposed (PAM50).6 These classification approaches are linked to treatment selection and prognosis. Other classification approaches including TNM staging,7 MammaPrint,8 and Oncotype DX9 were used for breast cancer subtyping. There are also new approaches that build on these clinical classifications and use various mathematical algorithms to improve their accuracy, such as PCA-PAM50 which combines the breast cancer clinical annotation of PAM50 and improves the accuracy of the approach by integrating with the primary component analysis.10 This underscores the significance of employing interdisciplinary methodologies.
The studies into molecular characteristics of BC subtypes have shown variability of subtype-associated biological and pathophysiological processes. Multiple studies showed considerable differences in the gene expression patterns in cancer subtypes with implications for survival and prognosis (for example reviewed in Refs. 11, 12). Our previous study also provided insight into the variability of transcriptomic landscape in cancers with somatic and germline mutations in BRCA1 and BRCA2 genes suggesting that uncovering the molecular heterogeneity of breast cancers can provide clues for developing more efficient therapeutic approaches.13
The advances in -omics technologies and efforts in collecting large multi-omic datasets have opened new opportunities for integrated analyses to deepen our understanding of molecular features of breast cancers, the mechanisms that drive the molecular diversity, and fine-graining disease molecular subtypes.14 This, in turn, paved the way for developing approaches for informed treatment selection.15
Several studies have already explored this direction.16 The study based on CNAs, mRNA, miRNA abundance, methylation, and protein abundance data already shows efficiency in dividing breast cancer into invasive lobular carcinoma (ILC) and invasive ductal carcinoma (IDC) subtypes.17 The novel integrated multi-omics approaches led to the identification of a new hybrid subtype with a poor survival prognosis.18 Also, survival and drug response-based frameworks show high effectiveness for diagnosing cancer patients in comparison with single-omics approaches.19 These and other results underline the importance of integrative studies that can open a new dimension in the analysis of molecular heterogeneity of cancers, address the complexity of the interplay of omic features in different subtypes of disease by linking genetic defects, epigenetics reprogramming, and perturbed transcription factor networks.
Previously, we have developed a self-organizing maps (SOM)-based bioinformatics pipeline for analysis, functional characterization, and visualization of omic datasets.20,21 It was successfully applied in many studies, including molecular characterization of various cancers, such as low-grade gliomas,22 B-cell lymphomas,23 etc. In this paper, we used its multilayer-SOM approach to analyze the genomic, epigenetic, and transcriptomic features of The Cancer Genome Atlas Breast Invasive Carcinoma (TCGA-BRCA) data collection.
In this study, we used available omic datasets of the TCGA-BRCA project.24 Total, RNA-seq counts, microarray promoter and gene body methylation, microarray CNV, and SNV were obtained for 996 samples. PAM50 molecular classification data for these samples were obtained from the publication by Chia et al.6
The patient’s clinical data was retrieved from the GDC database and contains variables, such as tumor pathologic stage, information about treatment, survival, etc.
In the GDC Data Portal, raw star count files are available for transcriptomic data for each sample within the TCGA-BRCA dataset. We have downloaded them by using gdc-client25 algorithms and merged all files across samples. Accordingly, the TPM values for each sample were obtained. In the succeeding step of the analysis, they were subjected to normalization and converted to log counts using variant stabilization transformation from the DeSeq2 package.26
The GDC-supplied methylation data contains betta values for samples, in which a subset is calculated with Illumina human methylation 450 microarray, while others with Illumina human methylation 27 microarray. DNA methylation data was aggregated by merging the data generated with two microarrays. In the case of overlapping CpG islands, the mean value per gene was used. Promoter methylation data was converted from betta to m values.27
CNV data was obtained from the GDC Data Portal, which provides Gene Level Copy Number files generated through the genotyping array method using the Affymetrix SNP 6.0 platform. To avoid constant values in data, we have normalized CNV data by adding small numbers (mean=0, sd=0.001) to each sample on a gene-wise basis.
Somatic mutation data resides within GDC in maf files and has been used for generating an SNV matrix. We have summarized all single nucleotide variation counts by genes. To avoid constant values in data, we have normalized SNV data by adding small numbers (mean=0, sd=0.001) to each sample gene-wise.
To conduct an integrative analysis of omic datasets of breast cancer, we employed a refined multilayer self-organizing maps (ml-SOM) approach built on our previous developments.22,28 The self-organizing map (SOM) algorithm is a neural network-based technique for dimensionality reduction and clustering. SOM topology is driven by co-variance of gene expression according to the selected weight factors.
Furthermore, the SOM implementation in the oposSOM package is enriched with robust function mining capabilities, facilitating the assignment of biological functions to gene clusters. This capability efficiently reduces the high-dimensional gene space into numerous differentially expressed functional modules. As a result, this approach enables a transition from analyzing individual genes to conducting systems-level analyses while preserving the integrity of the original information.
For ml-SOM, we organized all omic datasets into four distinct layers and trained them collectively on a single SOM grid, similar to a classical single-layer SOM (sl-SOM).20 The key distinction between the training processes of sl-SOM and ml-SOM lies in how the best matching unit (BMU) is selected within the SOM grid.
In sl-SOM, the BMU is chosen based on the distance between the input vectors and the weight vectors of SOM nodes. However, in the case of ml-SOM, we calculate these distances separately for each layer and then combine them into a single value, taking into account the respective layer weights as follows:
where - number of layers, - weight if layer, - distance to the SOM node on layer.The weight factor ω scales the effect of each of the layers on the topology of the ml-SOM. In this particular analysis, we used the following weights: 1 for RNA-seq, 0 - for promoter methylation, 0 - for CNV, and 0 - for SNV. In this way, the arrangement of genes on the SOM grid is driven by the transcriptome layer.
The downstream analysis of ml-SOM is similar to the oposSOM pipeline.20 Following the Self-Organizing Map (SOM) training, we partitioned the resulting metagene map into discrete regions referred to as “spots”. These spots represent clusters of genes that exhibit co-expression patterns, particularly genes that are perturbed in at least one of the omic layers. Spot identification within the individual SOM portraits was based on a “k-means” and “variance” criterion.21 These spots were subsequently combined into an overexpression summary map, offering a comprehensive view of the transcriptomic landscape across all layers. The expression values of each spot, detected across various layers, collectively constituted the corresponding spot profile.
To further elucidate the biological significance of these spots, we subjected the genes associated with the spots to functional annotation, including overrepresentation and Gene Set Z-score analyses. We also employed the Enrichr resource29 for over-representation analysis using additional gene sets.
To assess the relationships between gene expression, methylation, CNV, and SNV across various spots (gene modules), we utilized linear regression with gene expression as the outcome and the other genomic markers as explanatory variables. The model was further enhanced by incorporating PAM50 subtypes as an interaction term, allowing us to examine the variability in these relationships across different disease subtypes and omic layers. For the statistical analysis of these interactions and their visualization, the ‘emmeans’30 and ‘interactions’31 packages in R were employed. Additionally, we applied the Dunnett’s Test to evaluate pairwise differences in mean levels of expression and methylation, CNV, and SNV gene modules in PAM50 subgroups compared to true normal tissue.
Overall survival analysis was performed using the Cox proportional hazards regression using survival (https://cran.r-project.org/web/packages/survival/index.html) and survminer (https://cran.r-project.org/web/packages/survminer/index.html) R packages. The events were defined based on vital status information (“Dead” or “Alive”). The time to event was defined as “days to death” or “days to last follow-up”. We included survival as a dependent variable and spot omic profiles and breast cancer subtype information as predictors. We used the contsurvplot (https://cran.r-project.org/web/packages/contsurvplot/index.html) R package to visualize survival curves.
Previously we introduced so-called SOM phenotype portraits by mapping the association of clinical and phenotypic characteristics on the SOM grid.32 Accompanying phenotype data, such as medication, disease stage, and grade for TCGA-BRCA samples was obtained from the GDC portal. Phenotype maps were created for all available data types. To create a phenotype map, we constructed a linear regression model for each metagene as a dependent variable and clinical parameters as an ordinal variable. Then we mapped the corresponding regression coefficient for the predictor variable to a corresponding position of that metagene on the SOM grid. The visualization of weight coefficients allows evaluation of the association of corresponding clinical characteristics and the levels of functional gene modules on different omic layers.
In this study, we performed an integrative analysis of the TCGA-BRCA dataset (Figure 1) using four molecular data types – gene expression, promoter methylation, copy number variation, and somatic single nucleotide variation. We organized each omic data type into a data layer and analyzed them with multi-layer SOM training.
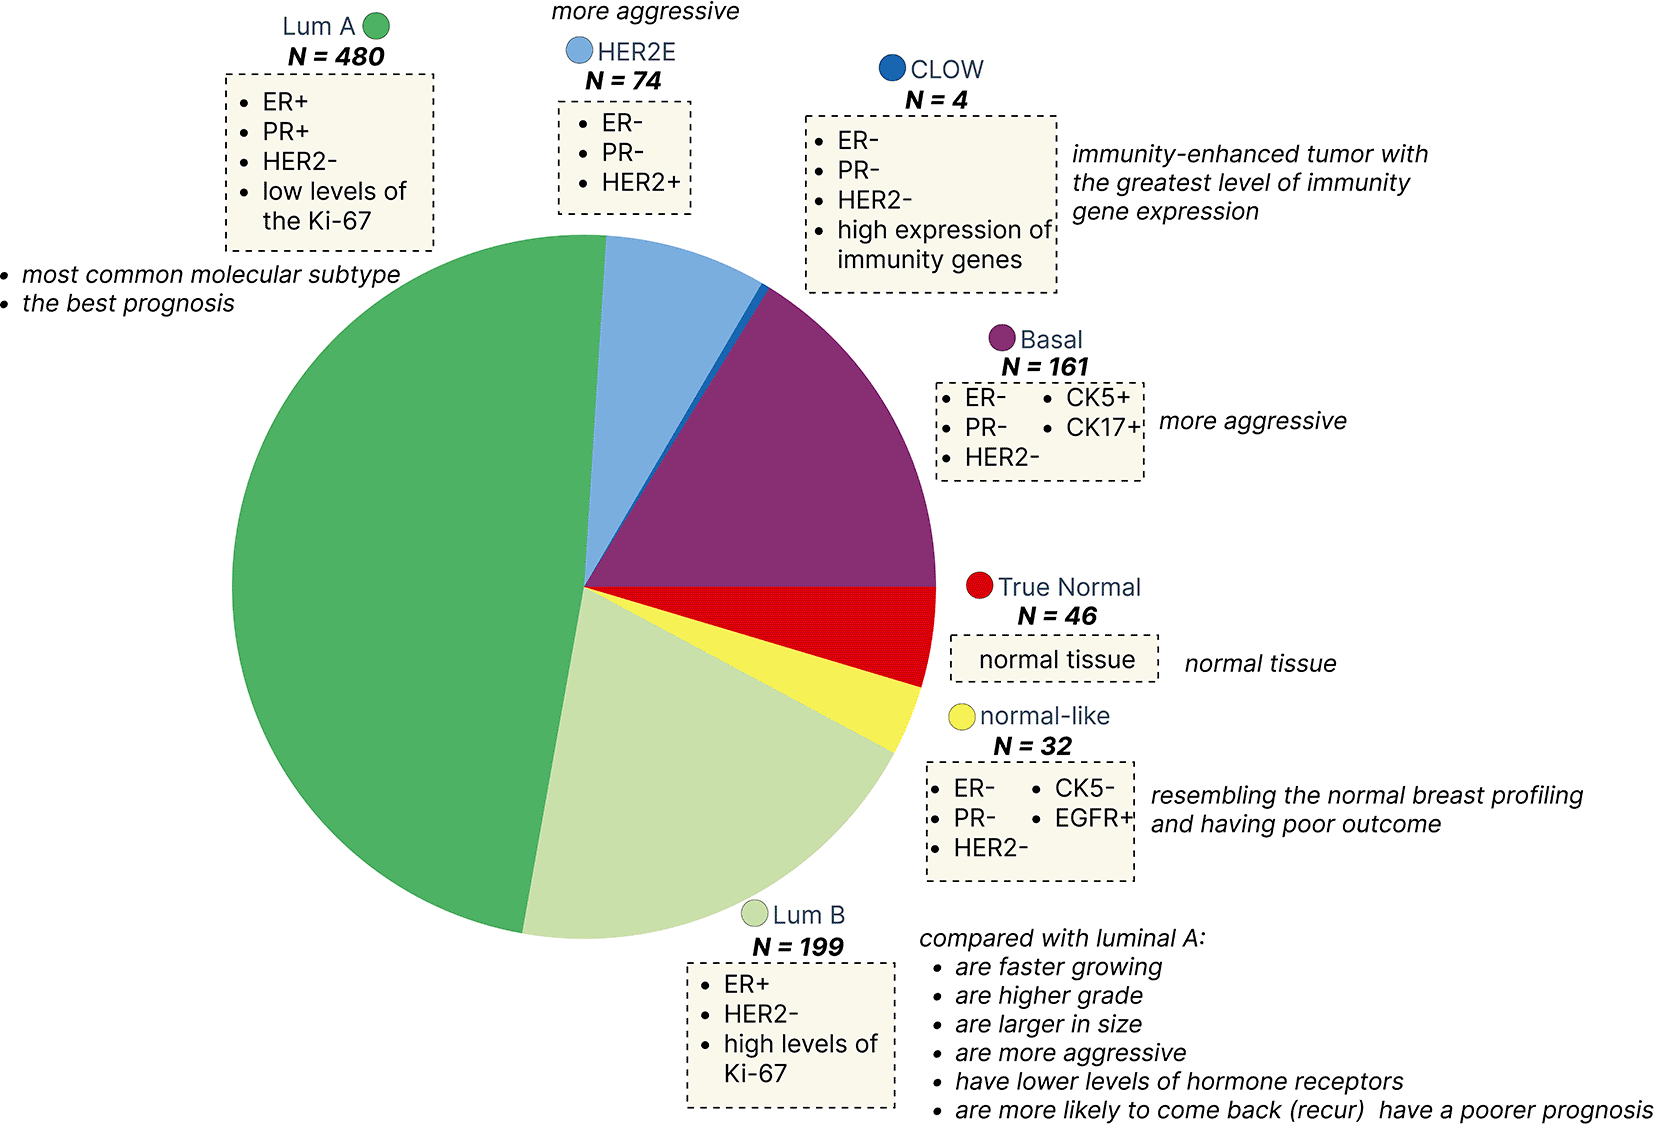
Lum A (luminal A) - ER+ and PR+, HER2- and low levels of the Ki-67; Lum B (luminal B) - ER+ and HER2- and has either high levels of Ki-67; HER2-enriched - ER-, PR- and HER2+; Basal triple-negative and CK5+ and CK17+; CLOW - triple-negative and high expression of immunity genes; Normal-like - triple-negative and CK5- and EGFR-; True Normal - normal tissue.
The multi-layer SOM training organized multi-omic high dimensional data on the two-dimensional grid of 40x40 size. During the training phase, ml-SOM combines the genes having similar profiles of expression, methylation, CNV, and SNV across samples into adjacent nodes according to the weight factors on the SOM grid thus forming gene clusters (also referred to as spots or gene modules). These clusters can be visualized for each sample by the expression value, which allows direct comparison between samples. Additionally, the expression variance for each cluster can be calculated and visualized as a map as well.
We combine samples in groups for downstream analysis according to the PAM50 classification to assign cancer samples to molecular subtypes. The average multi-omic SOM portraits showed considerable variations in expression (Gex), methylation (Gmx), CNV, and SNV both across PAM50 subgroups as well as compared to true normal tissue (Figure 2).
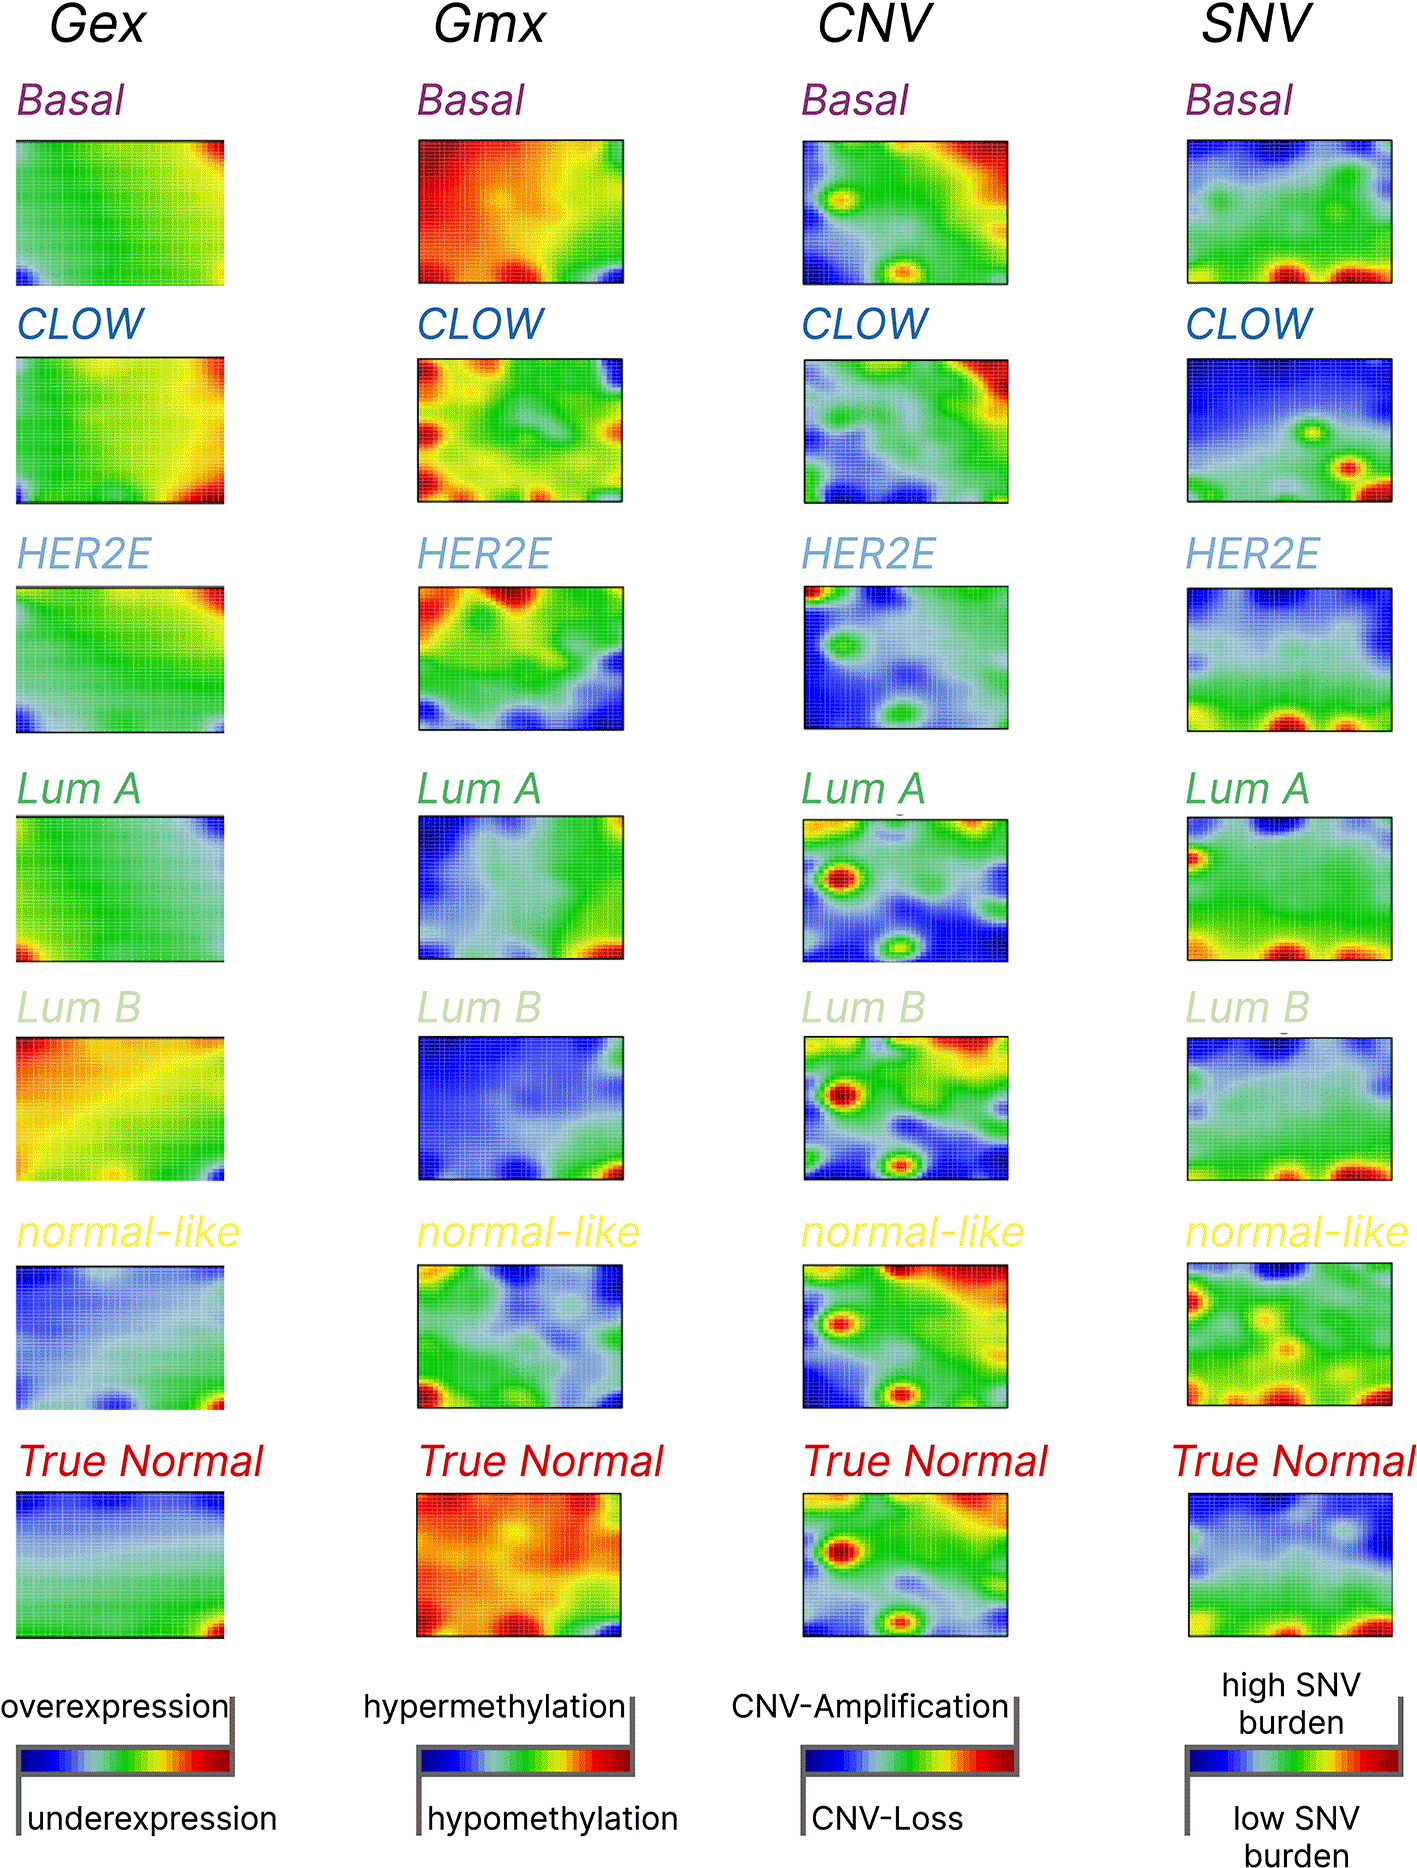
The color scheme indicates the nature of the change on each omic layer. On the transcriptome layer (Gex) blue to red scale represents under- to overexpression. On the methylation layer (Gmx) blue to red scale represents hypo- and hypermethylation. On the CNV layer blue to red scale represents CNV loss and CNV gain, respectively. On the SNV layer blue to red scale represents low to high mutation burden, respectively. Consequently, the green areas on SOM portraits represent invariants gene clusters or areas.
Visualizing variance within layers showed regions of gene clusters with high and low variance in brown and blue, respectively (Figure 3A-D). Regions with high variance likely capture significant differences in gene expression (Gex), promoter methylation (Gmx), copy numbers (CNV), and mutational load (SNV), respectively, characterizing the distinct tumor subtypes. We used the k-means33 segmentation of the map criterion to dissect the variance maps into 20 spots annotated by letters “A” to “T” (presented in Supplementary_Figure1.pdf from “Extended Data”, see Data and software availability). For further analyses, we selected highly variable ones (spots A, C, E, F, L, R, Q, S) that contained genes with highly variant feature profiles across samples at least in one omic layer.

These maps offer an overview of the variance patterns across different data types, highlighting the variability of specific gene clusters (spots) across omic layers. The blue regions represent areas of low variance, while red regions indicate high variance. The letters correspond to highly variant spots as identified with k-means clustering (presented in Supplementary_Figure1.pdf from “Extended Data”, see Data and software availability).
On average, each spot comprised 155±60 genes. The largest gene counts (207 genes) were associated with spot R showing high variance for Gex, Gmx, and CNV, while spot F contained only 9 genes mostly associated with high CNV-variance. Due to the self-organizing properties of the SOM algorithm, genes of similar expression profiles were grouped in spot-like clusters across the omic layers, suggesting they may share common biological functions or regulatory mechanisms.21 To explore this further and map functional signatures to the spots, we performed Gene Set Enrichment Analysis using built-in gene sets20 and an over-representation analysis tool that provided additional gene sets covering multiple domains.29
Spot A contained 114 genes, associated primarily with DNA replication (padj = 3.3e-05), E2F targets (padj = 5.3e-09), retinoblastoma pathway (padj = 3.23e-05), and cell cycle activity (padj = 5.4-e04). Notably, spot genes were also associated with EMT markers taken from Sarrió et al,34 as well as markers for the basal BC subtype taken from Smid et al.35
Spot C contained 165 genes mostly involved in protein transport (padj = 2.0e-02), SMARCA2 antiproliferative targets (padj = 2.2e-06),36 and DNA repair. (padj = 4.34E-03).
Spot E contained 118 genes enriched with luminal cancer gene signatures (padj = 0.005)37 and genes associated with the amplification of chromosome 16p13 (padj = 0.02).38
Spot F contained only 9 genes, however, they were implicated in vitamin D signaling (padj = 0.038), palmitoyl-CoA Hydrolase Activity (padj = 0.025), Androgen Receptor/NKX3-1 Signaling (padj = 0.01) and ICGC transcription factor target genes (padj < 0.01).
Spot L contained 67 genes strongly associated with the immune system process (padj = 1.2e-12).
Spot Q contained 141 genes enriched with stromal (padj = 7.84E-03)39 and stem cell gene signatures (padj = 8.81E-14),40 genes involved in accelerated proliferation (padj = 6.1e-05), inflammation (padj = 0.03), RAS signaling (padj = 1.1e-05), hypermethylation of tumor suppressor genes (padj = 3.2e-04).
Spot R contained 207 genes associated with RNA splicing (padj = 0.005) and mitochondrial gene signatures (padj = 0.004).
Spot S contained 106 genes enriched with luminal cancer signatures (padj = 4.3e-06), ESR1 signatures (padj = 3.5e-15), and metastasis-suppressing signatures (padj = 2.1e-03).
The full list of annotations associated with the spots is available in Supplementary Tables S1 - S16 in Supplementary_Tables_S1-S16.xlsx file of “Extended data” (see Data and software availability).
Based on the functional annotation we assigned each spot to the functional processes that best describe the genes located in that module (Table 1).
The Spot Assignment column presents a generalized spot description based on the gene set enrichment results.
The feature profiles of the spots in the different omic layers represent the “averaged” pattern of the respective genes across the samples and serve as a surrogate level for the functional signatures associated with the respective spot.21 We calculated two-way clustered similarity matrices for the different omic layers using the spot profiles to estimate the relatedness between the tumor subtypes as seen by the different omic layers (Figure 4). Gene expression (Figure 4A) and methylation (Figure 4B) clustering of the breast cancer subtypes showed remarkable similarity indicating marked variance correlations between Gex and Gmx data as seen also in the similar Gex and Gmx variance maps (Figure 3). Both omic layers express roughly three clusters collecting normal-like, basal, and HER2E as well as luminal subtypes, respectively. On the CNV layer, one finds two major clusters of normal tissue, Lum A, Lum B, and HER2E tumors, and of normal-like and basal tumors (Figure 4C). No notable clusters were observed on the SNV layer (Figure 4D).
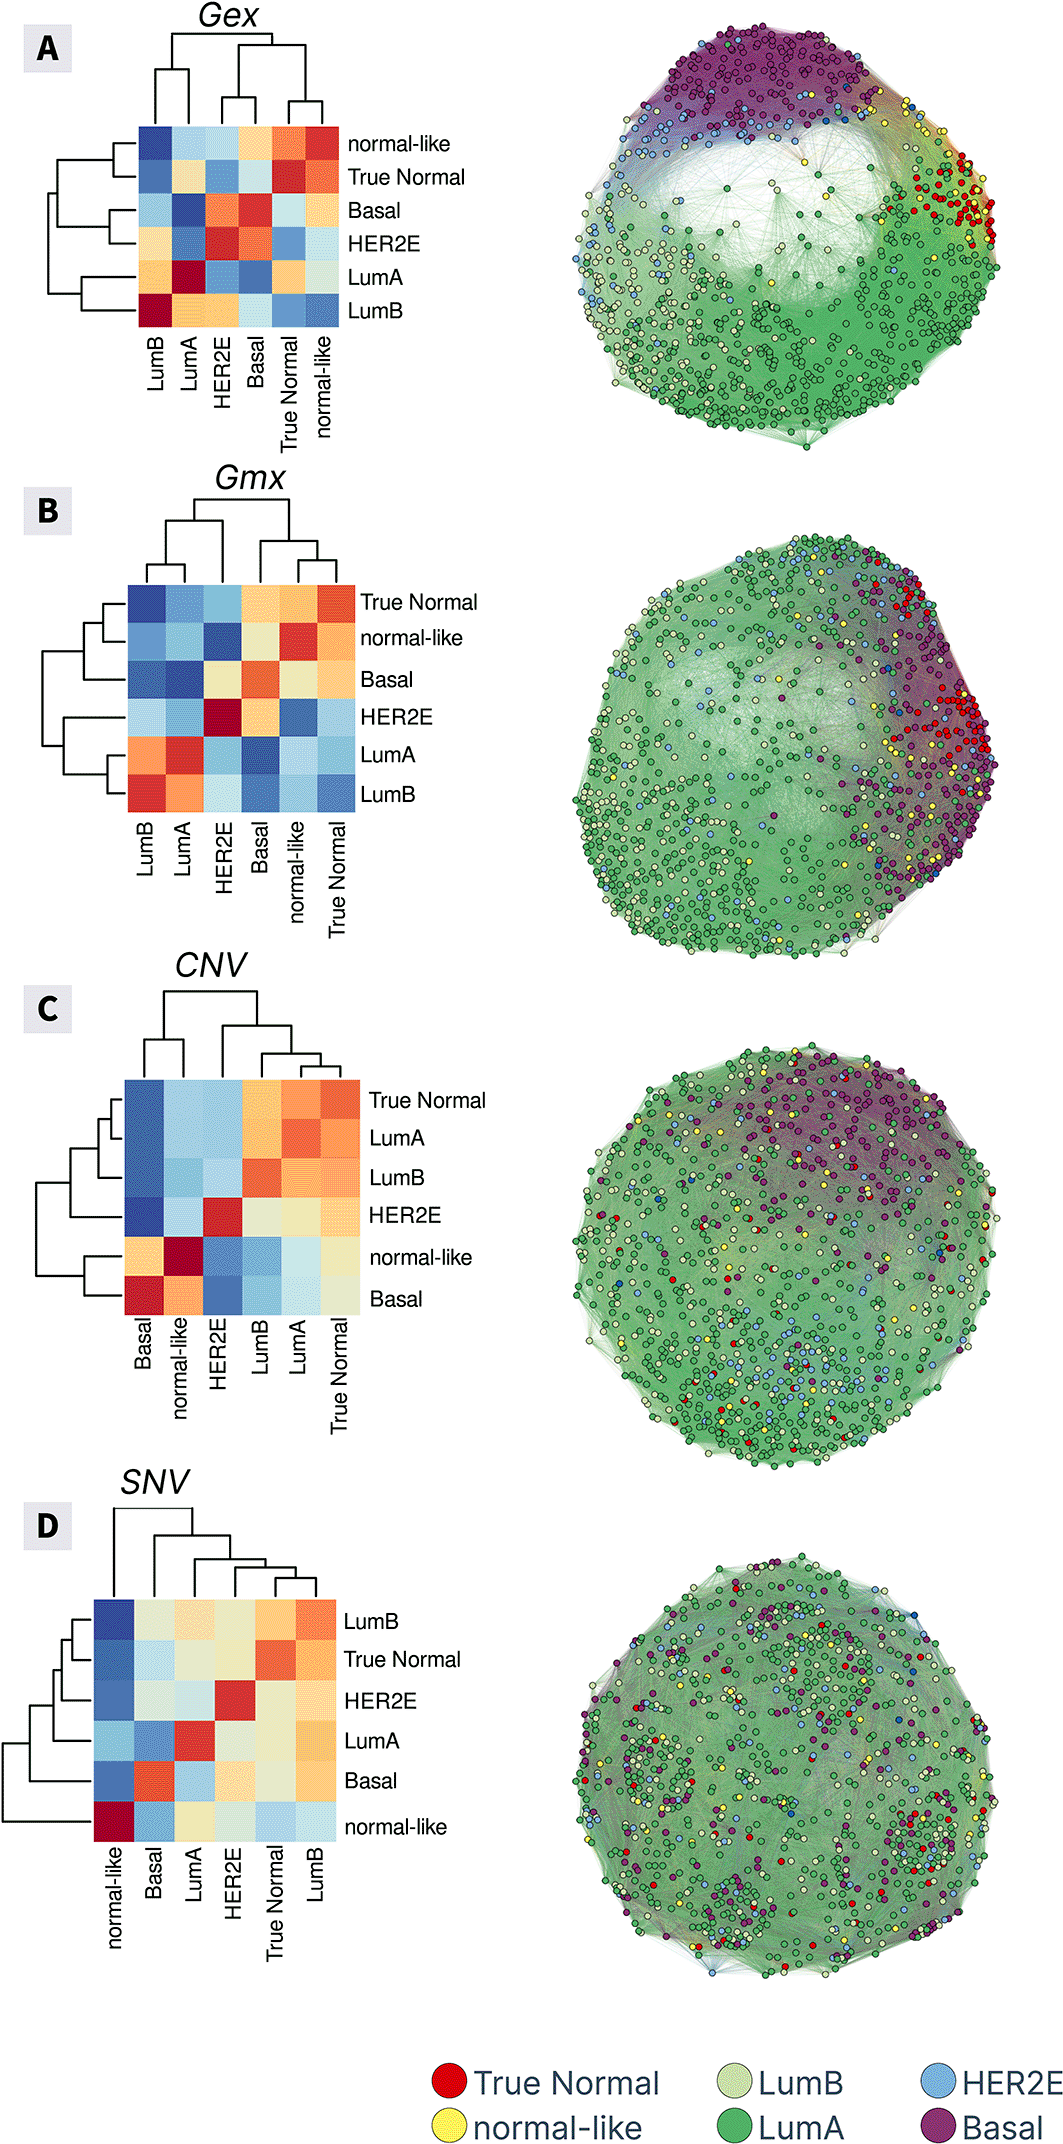
The left part of the figure shows the Pearson correlation-based heatmaps across data categories, where red indicates a positive correlation and blue indicates a negative correlation, respectively. Color intensity reflects the strength of the correlation. The right part displays correlations between individual samples, with colors indicating their respective PAM50 subtype memberships. The edges between samples indicate the Pearson correlation coefficient > 0.5.
The similarity net images in the right part of Figure 4 visualize the correlation of omic profiles on a single tumor level. It indicates the most pronounced clustering in the Gex layer and the weakest one for SNV data with CNV and Gmx taking intermediate positions.
Next, we analyzed the genes collected from most variant spots across the omic landscapes to identify mutual correlations, possible driver events, and functional associations with underlying cancer-related biological processes. For this, we used linear regression/ANOVA to evaluate the mean differences of spot levels in disease subtypes across the four omic layers (for example see Figure 5A). We further used post hoc Dunnett’s test to assess the differences in mean spot levels in cancer subtypes compared with normal tissues. The actual levels are indicated as boxplots (for example see Figure 5B).
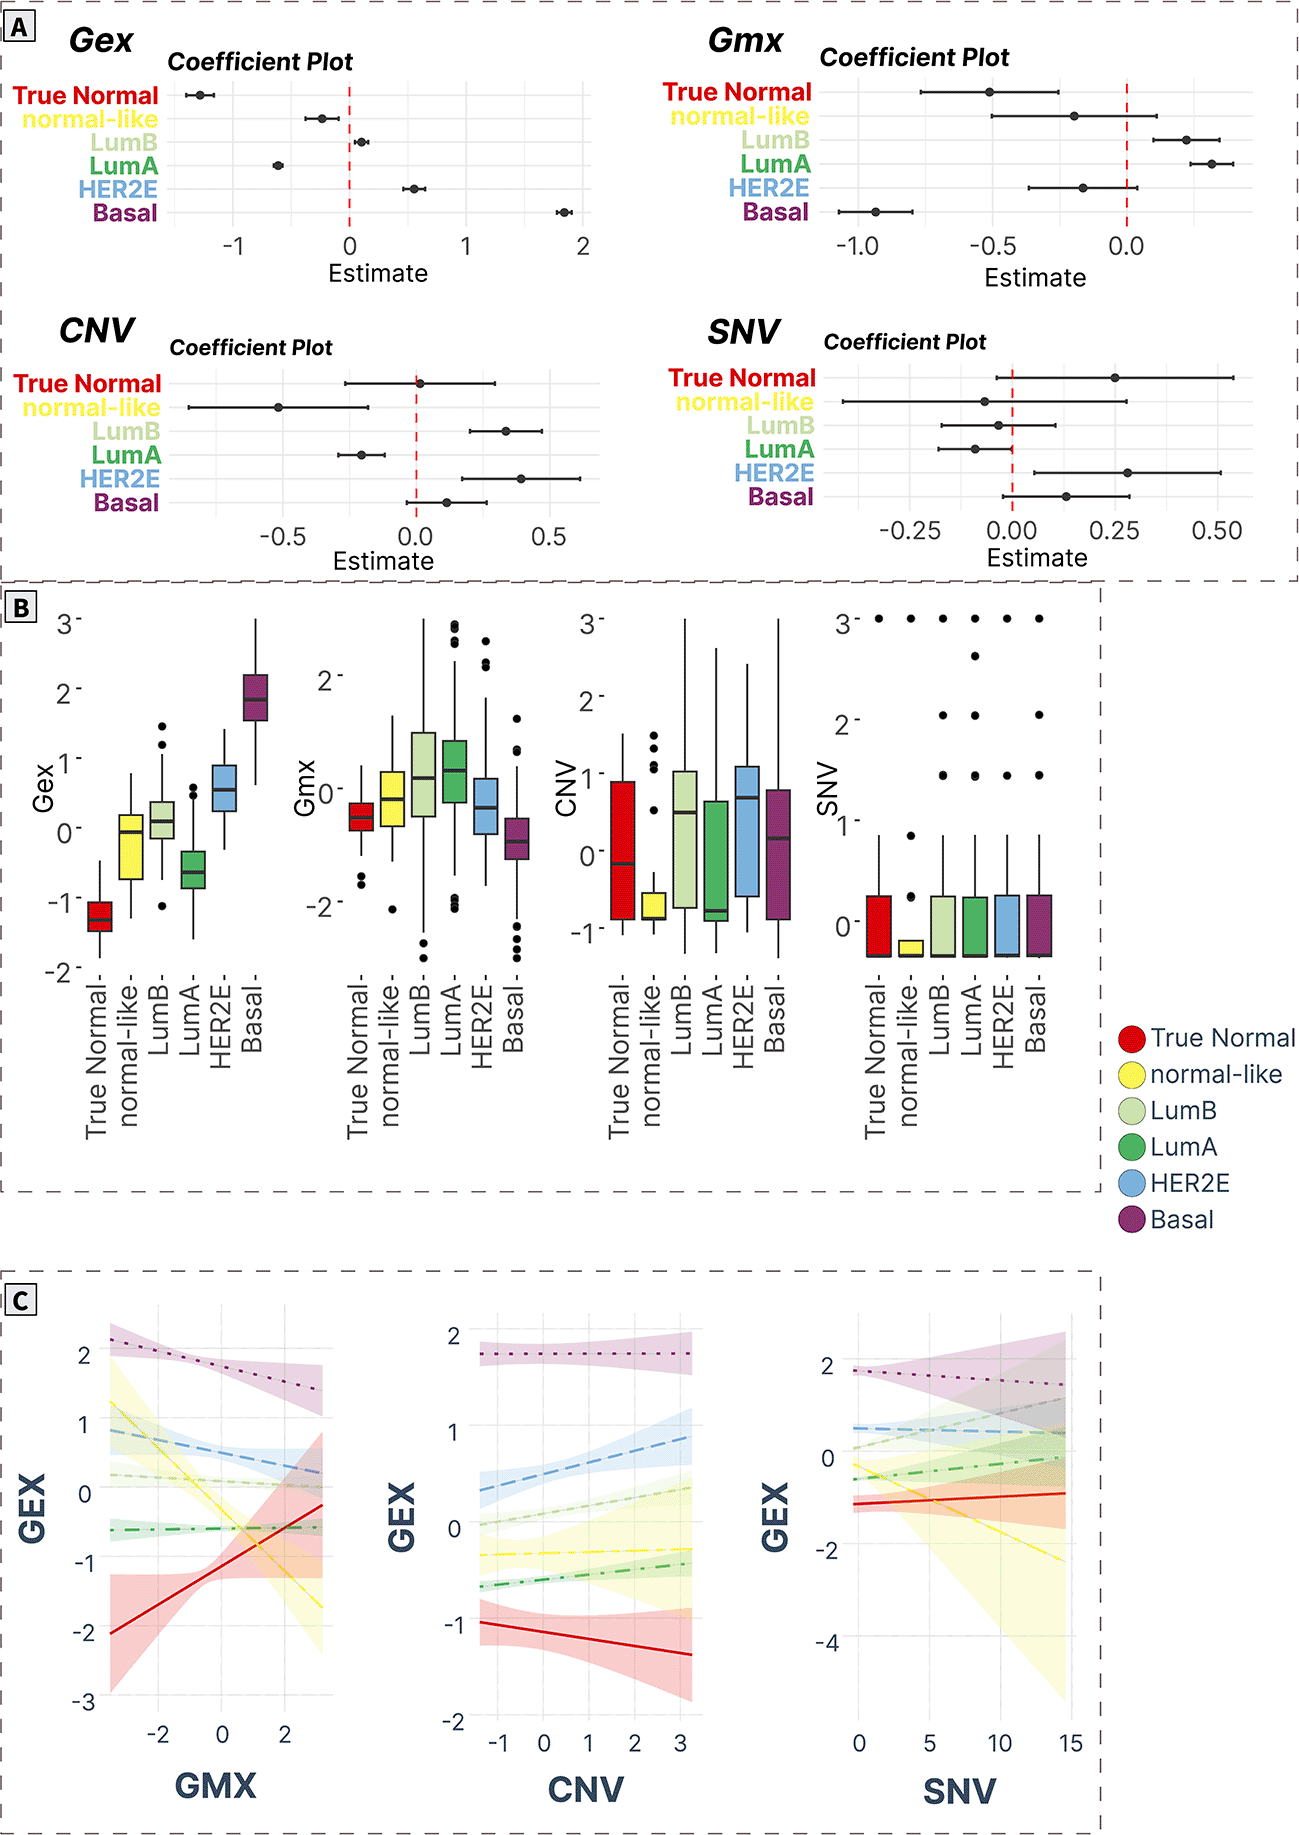
A) ANOVA/linear regression coefficient plots indicate the magnitude and significance of differences in mean levels in cancer subtypes compared to normal tissue. B) Boxplots of spot levels in cancer subtypes across SOM layers. C) Visualization of PAM50 subtype-characteristic association (regression slopes and confidence intervals) between expression (dependent variable) and epigenetic (methylation) and genomic (CNV, SNV) factors.
To understand the association between transcriptomic, epigenetic, and genetic features in each cancer subtype we used linear regression with expression spot levels as the dependent variable and other omic layers as well as their interactions with cancer subtypes. In this case, the slope coefficient for each interaction will show the level and direction of association in a subtype-characteristic manner. Thus, we could use this as a proxy for the impact of genomic/and epigenetic elements on the expression of spot-associated genes in cancer subtypes (for example, see Figure 5C). The samples of the CLOW subtype we excluded from further analyses because of their low number (n = 4).
Particularly, we considered cell cycle and EMT (spot A), DNA repair (spot C), luminal cancer signature (Spot E), vitamin D signaling (Spot F), immune response (Spot L), stroma and stem cells (Spot Q), RNA-splicing (Spot R) and estrogen receptor signaling (Spot S) activities (Figures 5-12, respectively).
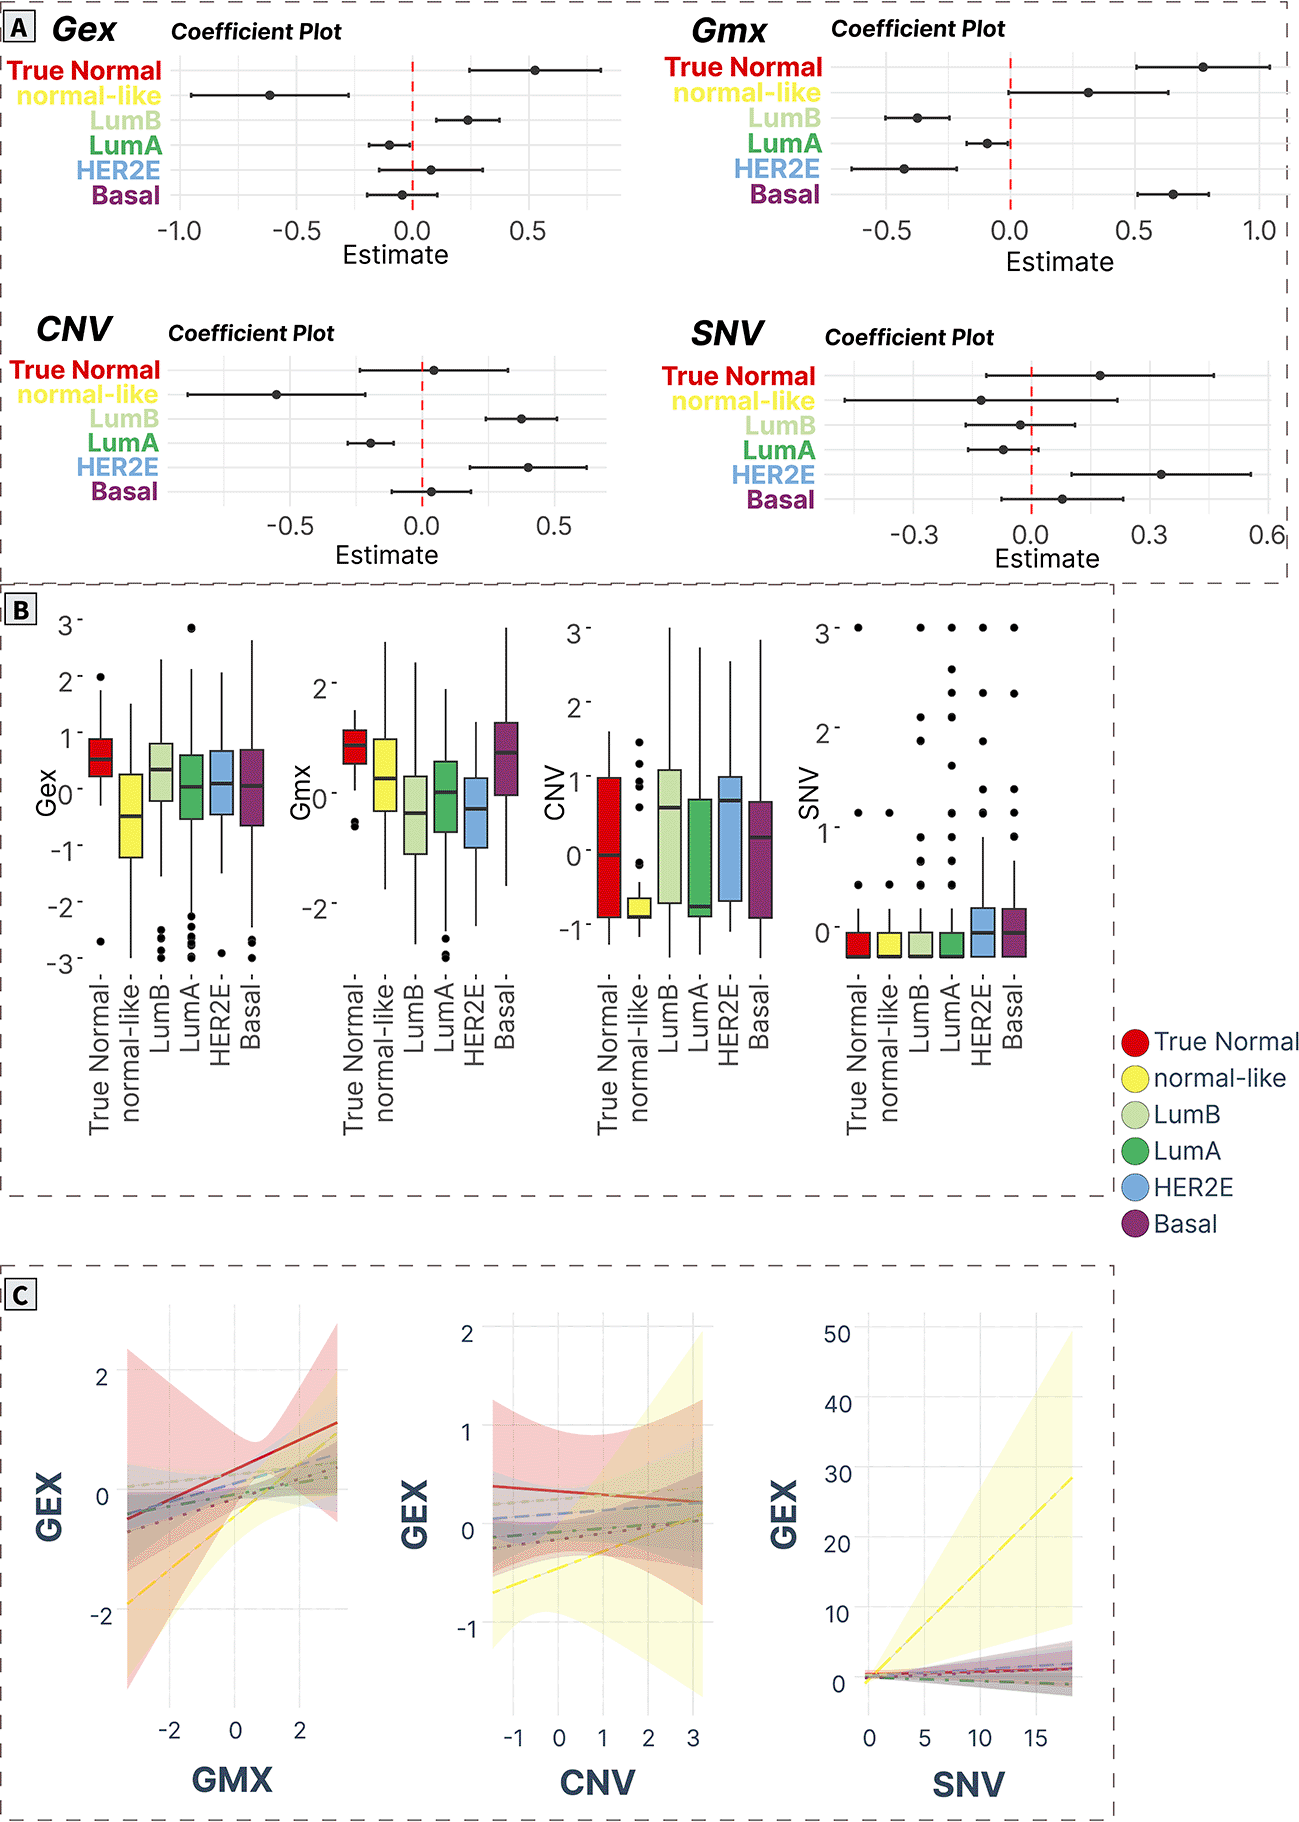
A) ANOVA/linear regression coefficient plots indicate the magnitude and significance of differences in mean levels in cancer subtypes compared to normal tissue. B) Boxplots of spot levels in cancer subtypes across SOM layers. C) Visualization of PAM50 subtype-characteristic association (regression slopes and confidence intervals) between expression (dependent variable) and epigenetic (methylation) and genomic (CNV, SNV) factors.
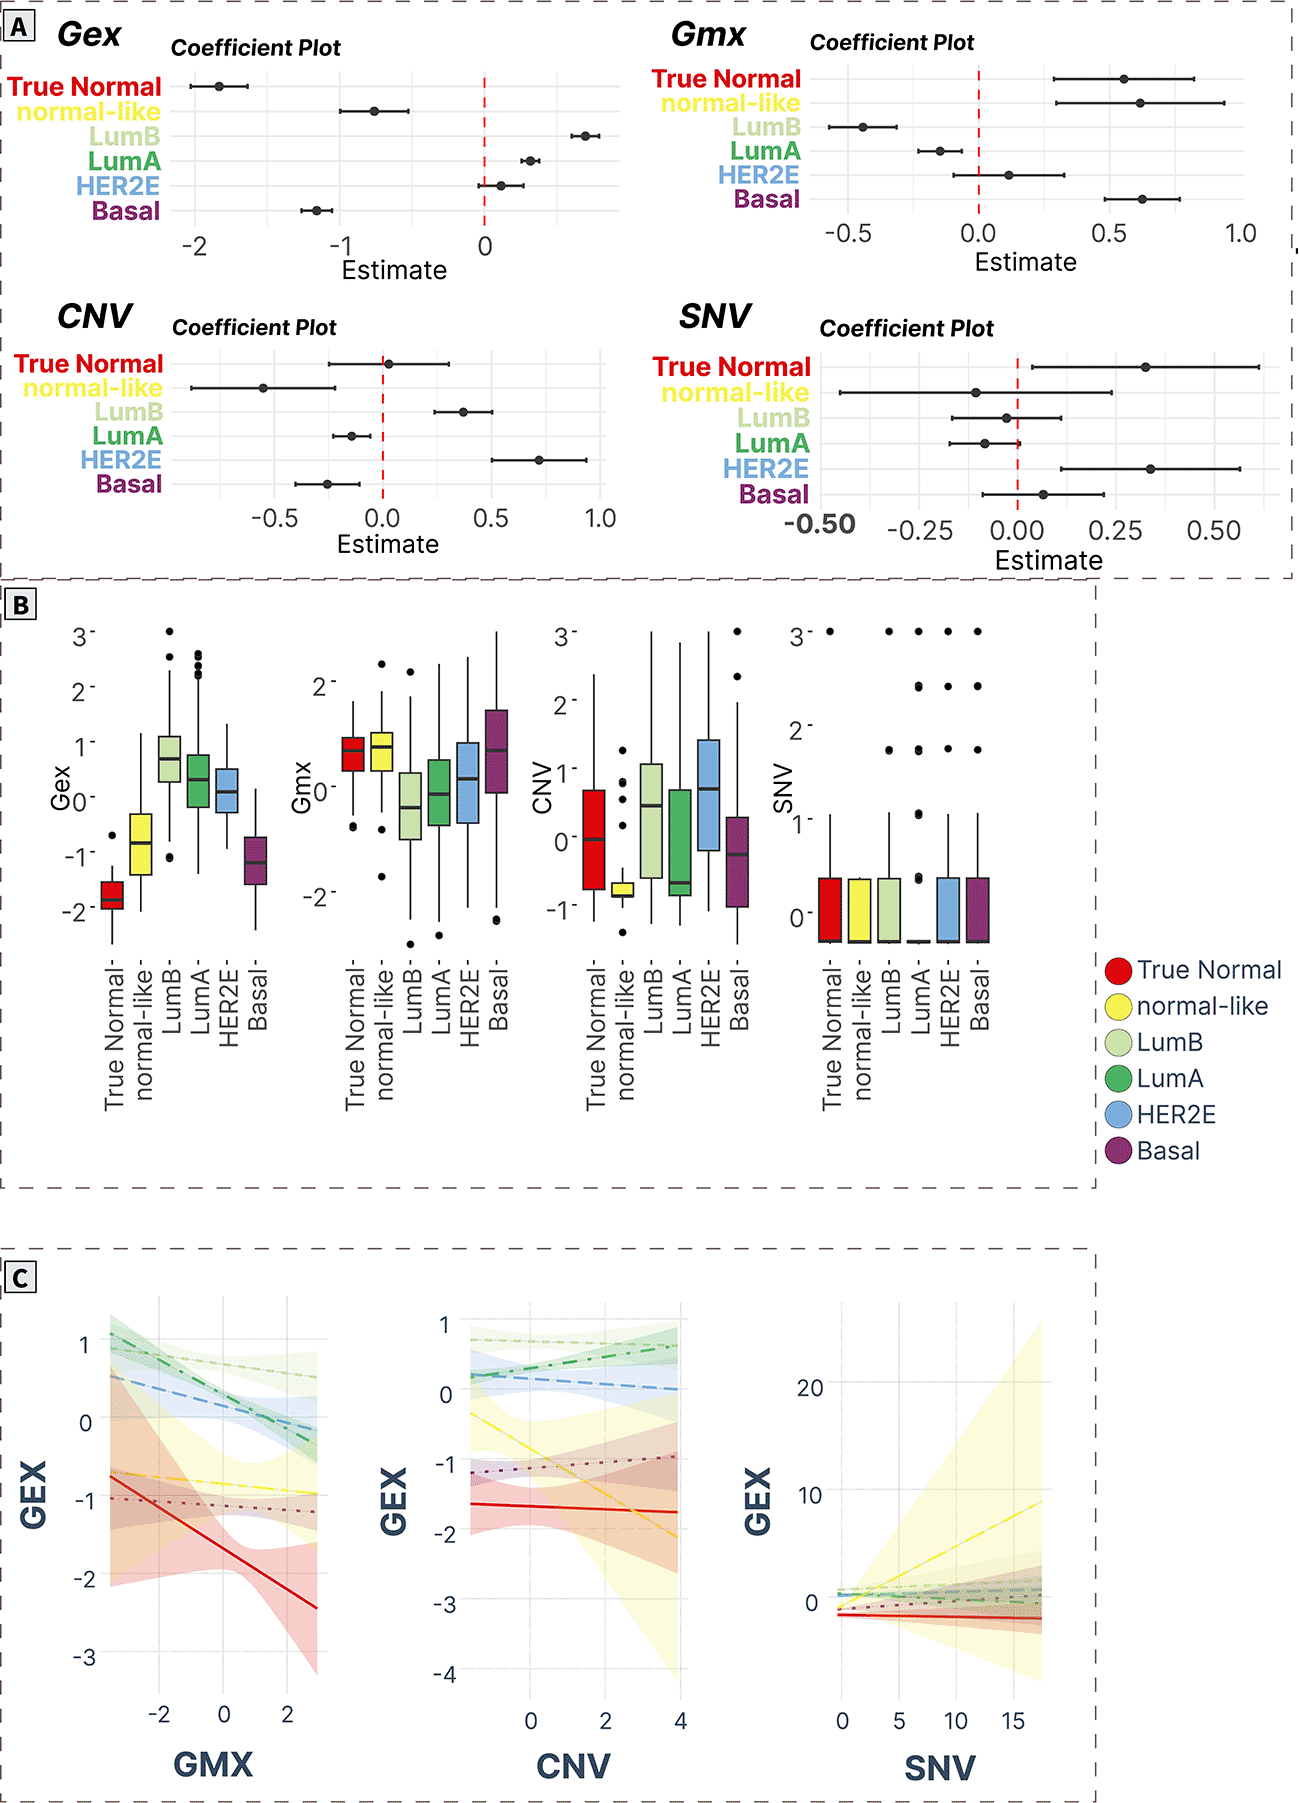
A) ANOVA/linear regression coefficient plots indicate the magnitude and significance of differences in mean levels in cancer subtypes compared to normal tissue. B) Boxplots of spot levels in cancer subtypes across SOM layers. C) Visualization of PAM50 subtype-characteristic association (regression slopes and confidence intervals) between expression (dependent variable) and epigenetic (methylation) and genomic (CNV, SNV) factors.
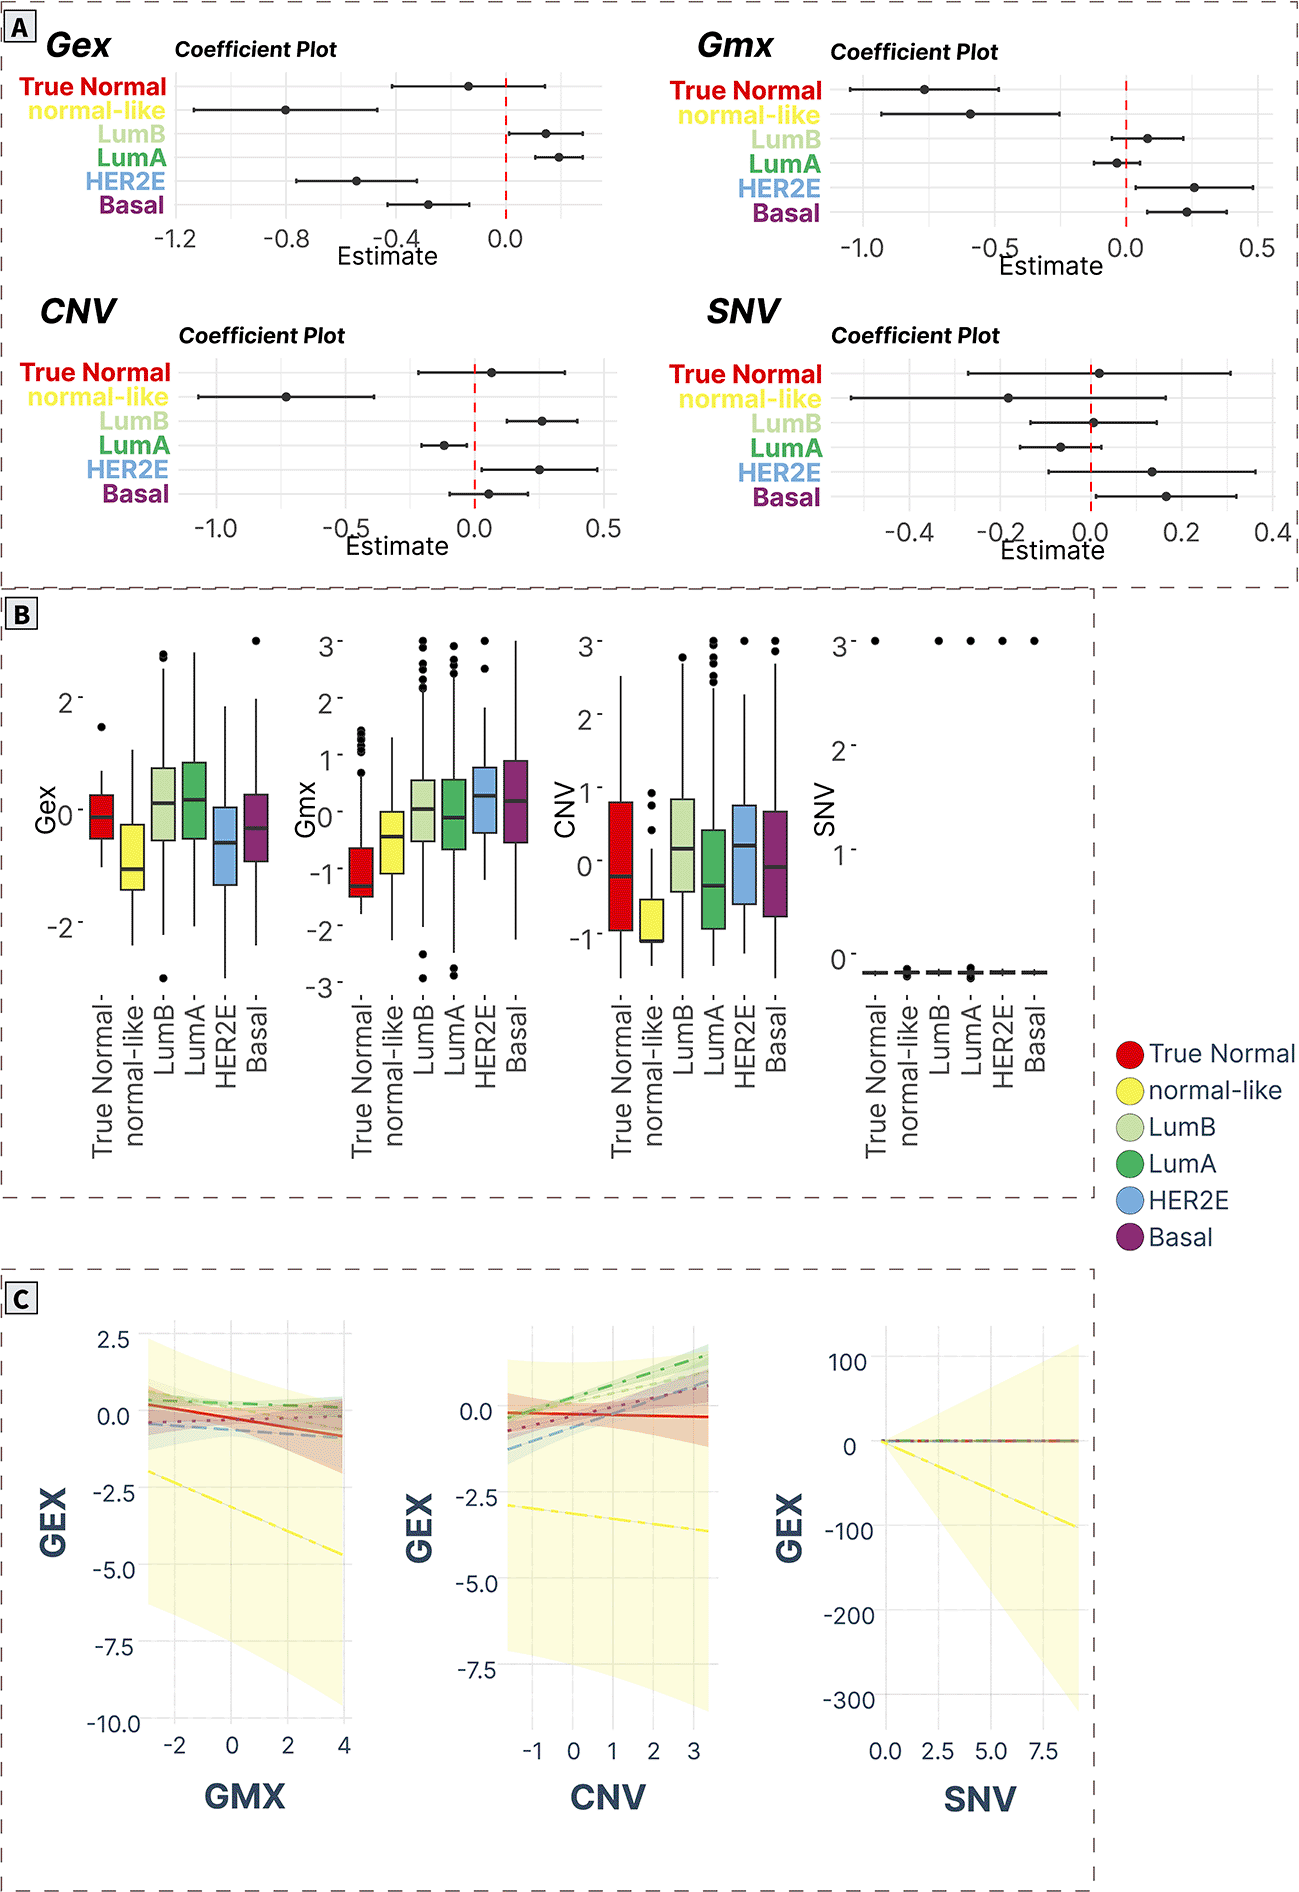
A) ANOVA/linear regression coefficient plots indicate the magnitude and significance of differences in mean levels in cancer subtypes compared to normal tissue. B) Boxplots of spot levels in cancer subtypes across SOM layers. C) Visualization of PAM50 subtype-characteristic association (regression slopes and confidence intervals) between expression (dependent variable) and epigenetic (methylation) and genomic (CNV, SNV) factors.
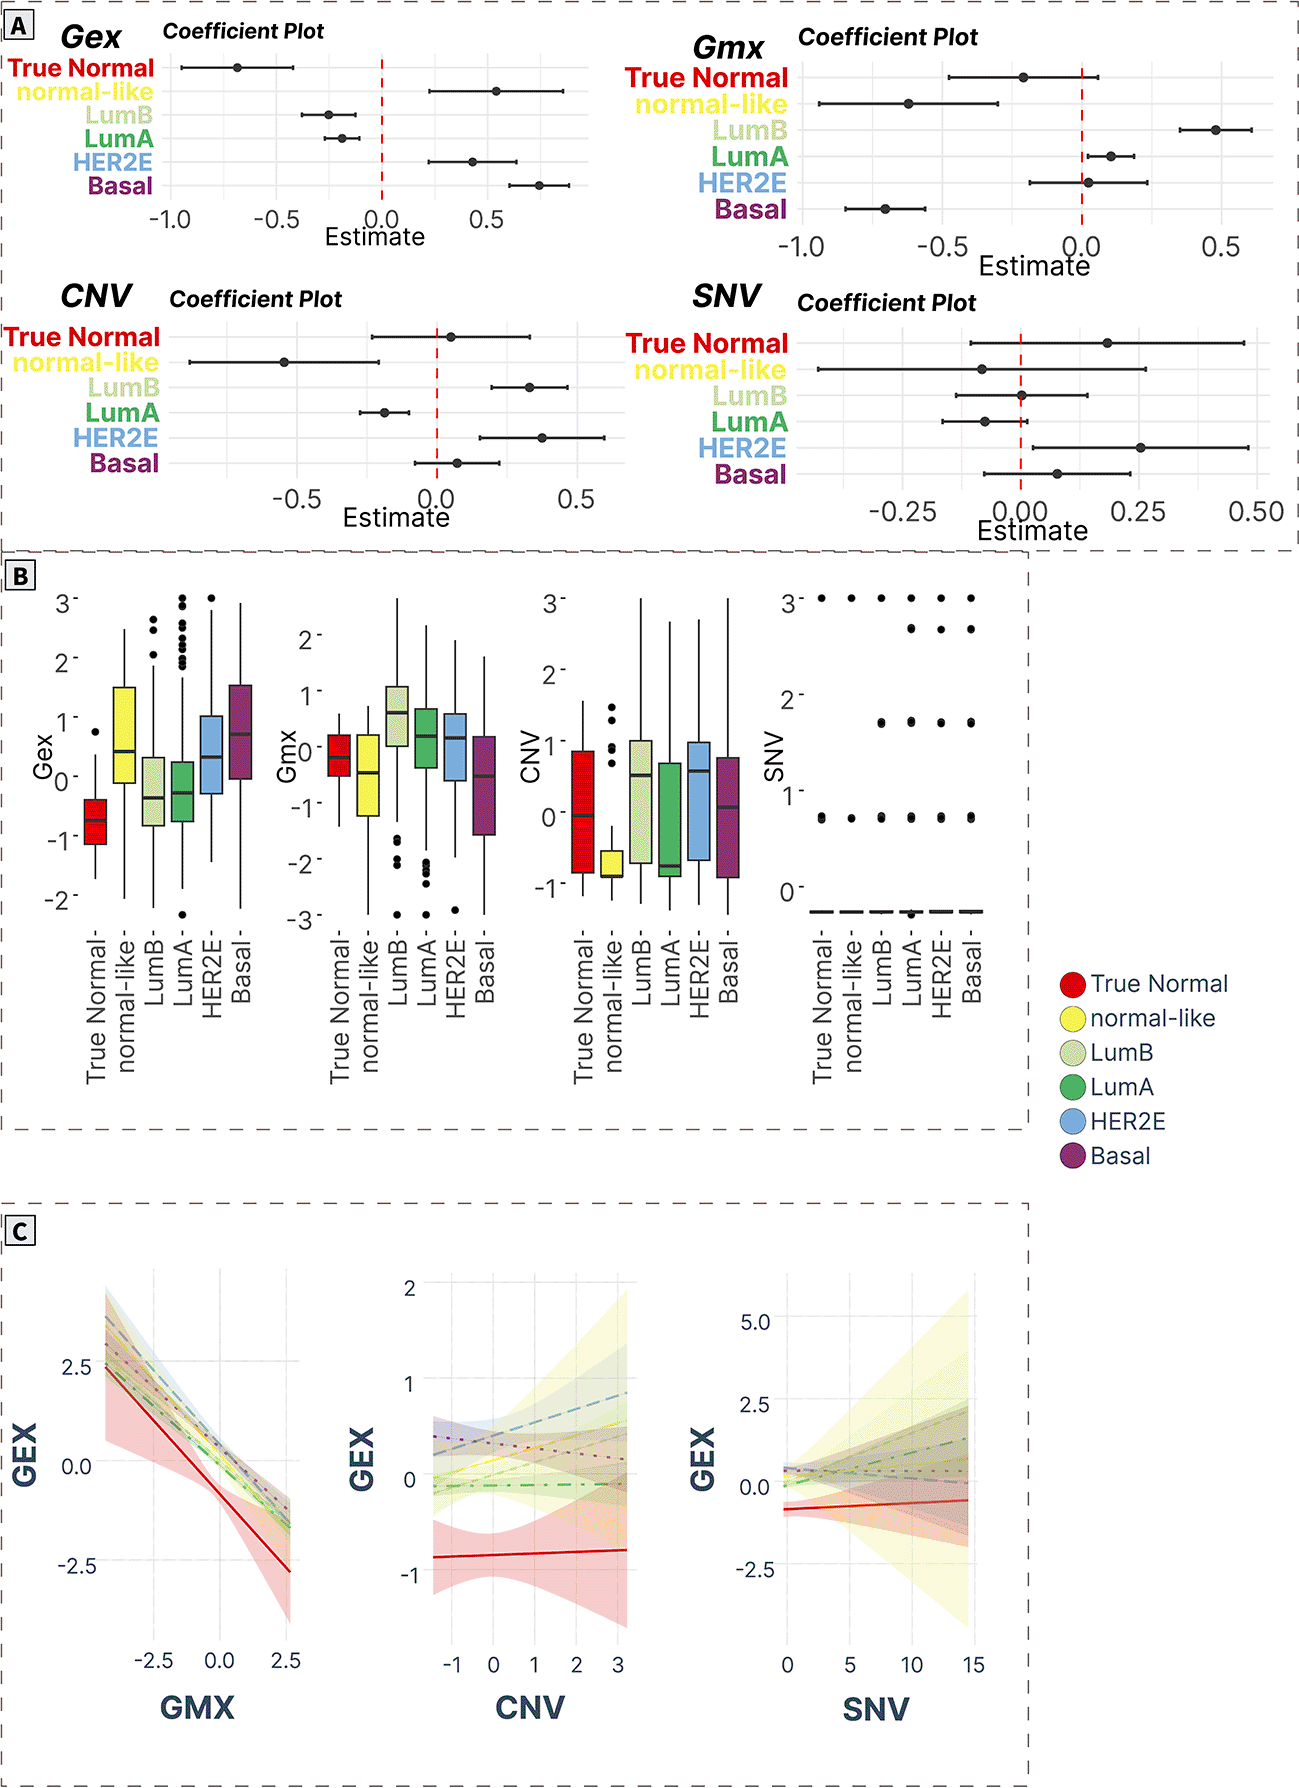
A) ANOVA/linear regression coefficient plots indicate the magnitude and significance of differences in mean levels in cancer subtypes compared to normal tissue. B) Boxplots of spot levels in cancer subtypes across SOM layers. C) Visualization of PAM50 subtype-characteristic association (regression slopes and confidence intervals) between expression (dependent variable) and epigenetic (methylation) and genomic (CNV, SNV) factors.
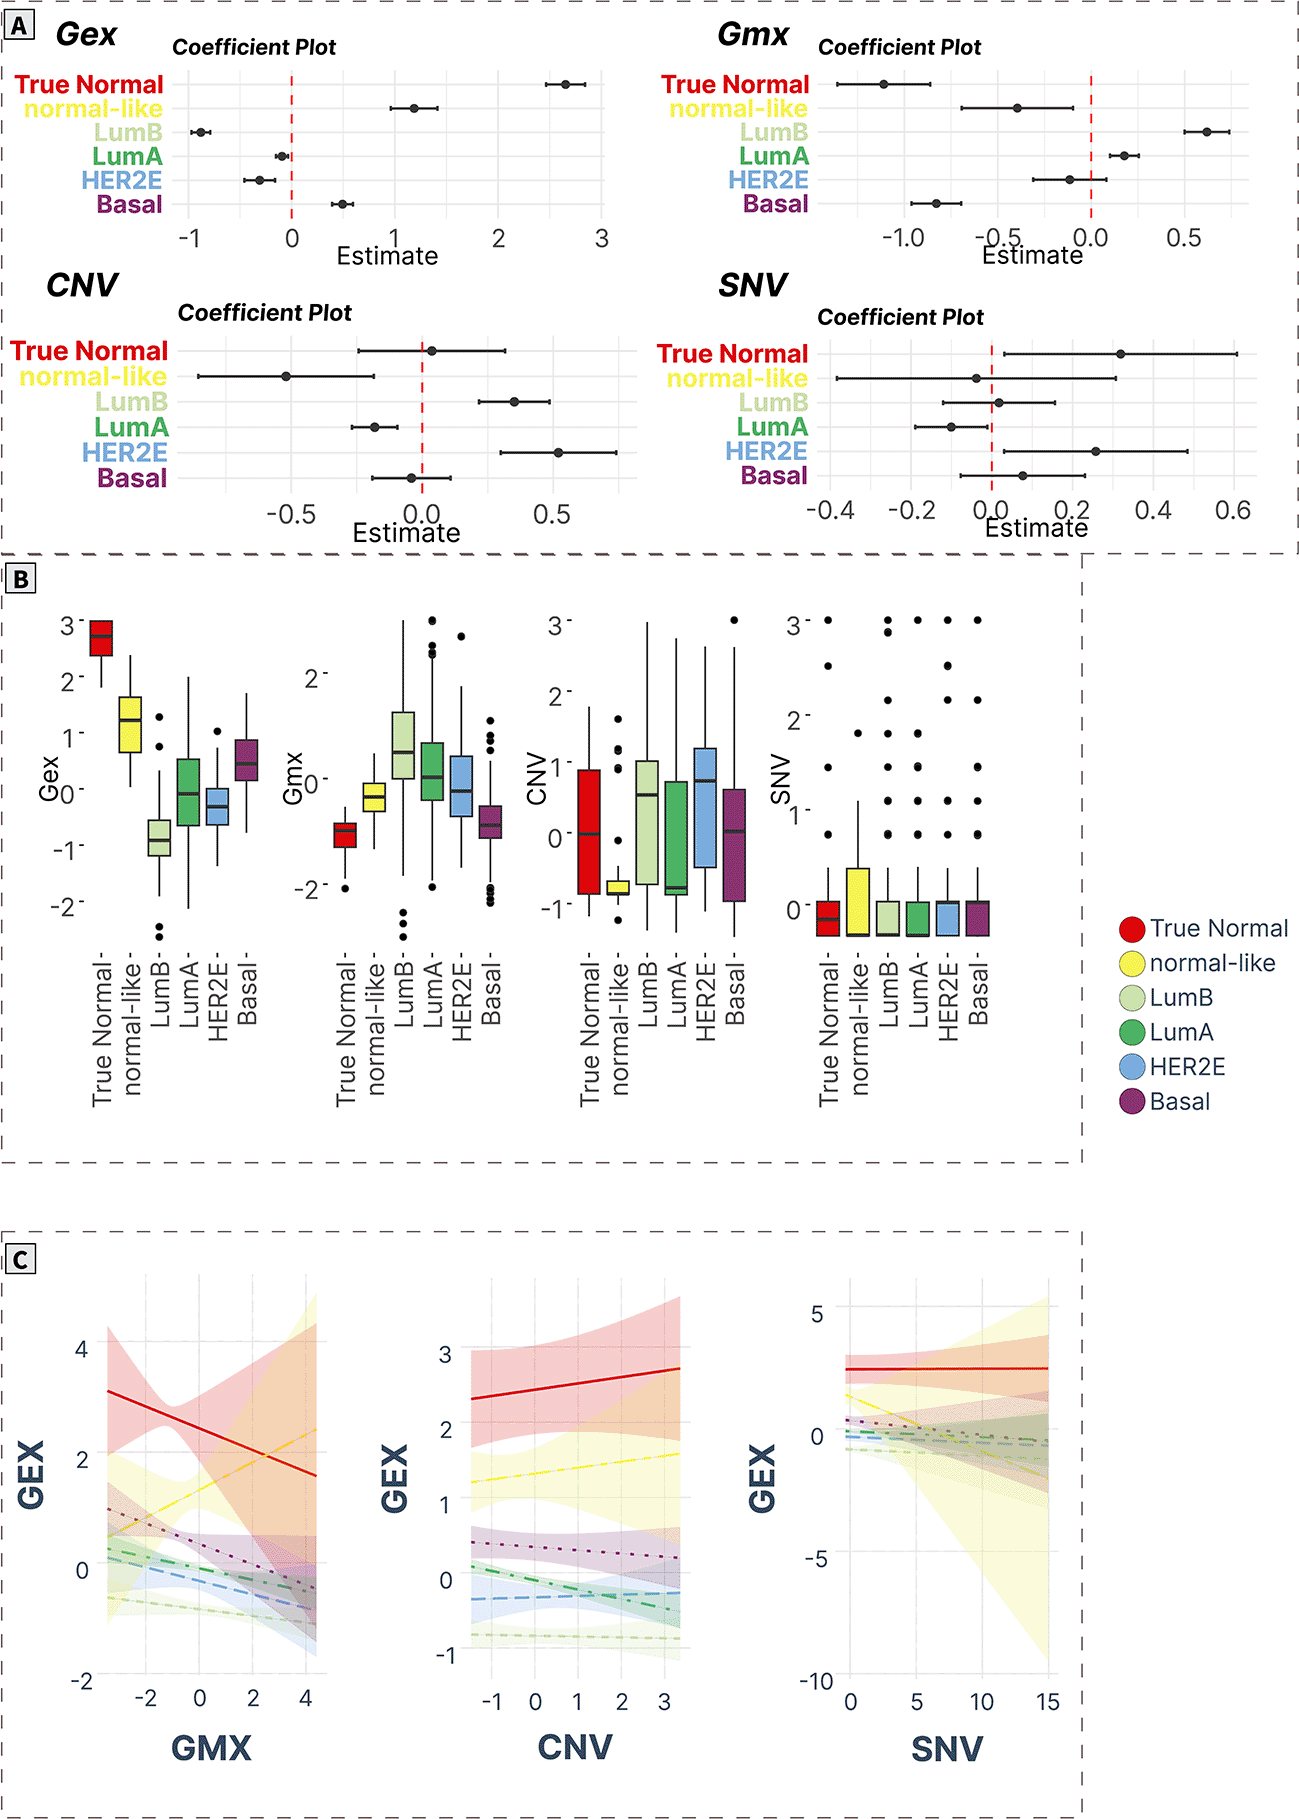
A) ANOVA/linear regression coefficient plots indicate the magnitude and significance of differences in mean levels in cancer subtypes compared to normal tissue. B) Boxplots of spot levels in cancer subtypes across SOM layers. C) Visualization of PAM50 subtype-characteristic association (regression slopes and confidence intervals) between expression (dependent variable) and epigenetic (methylation) and genomic (CNV, SNV) factors.
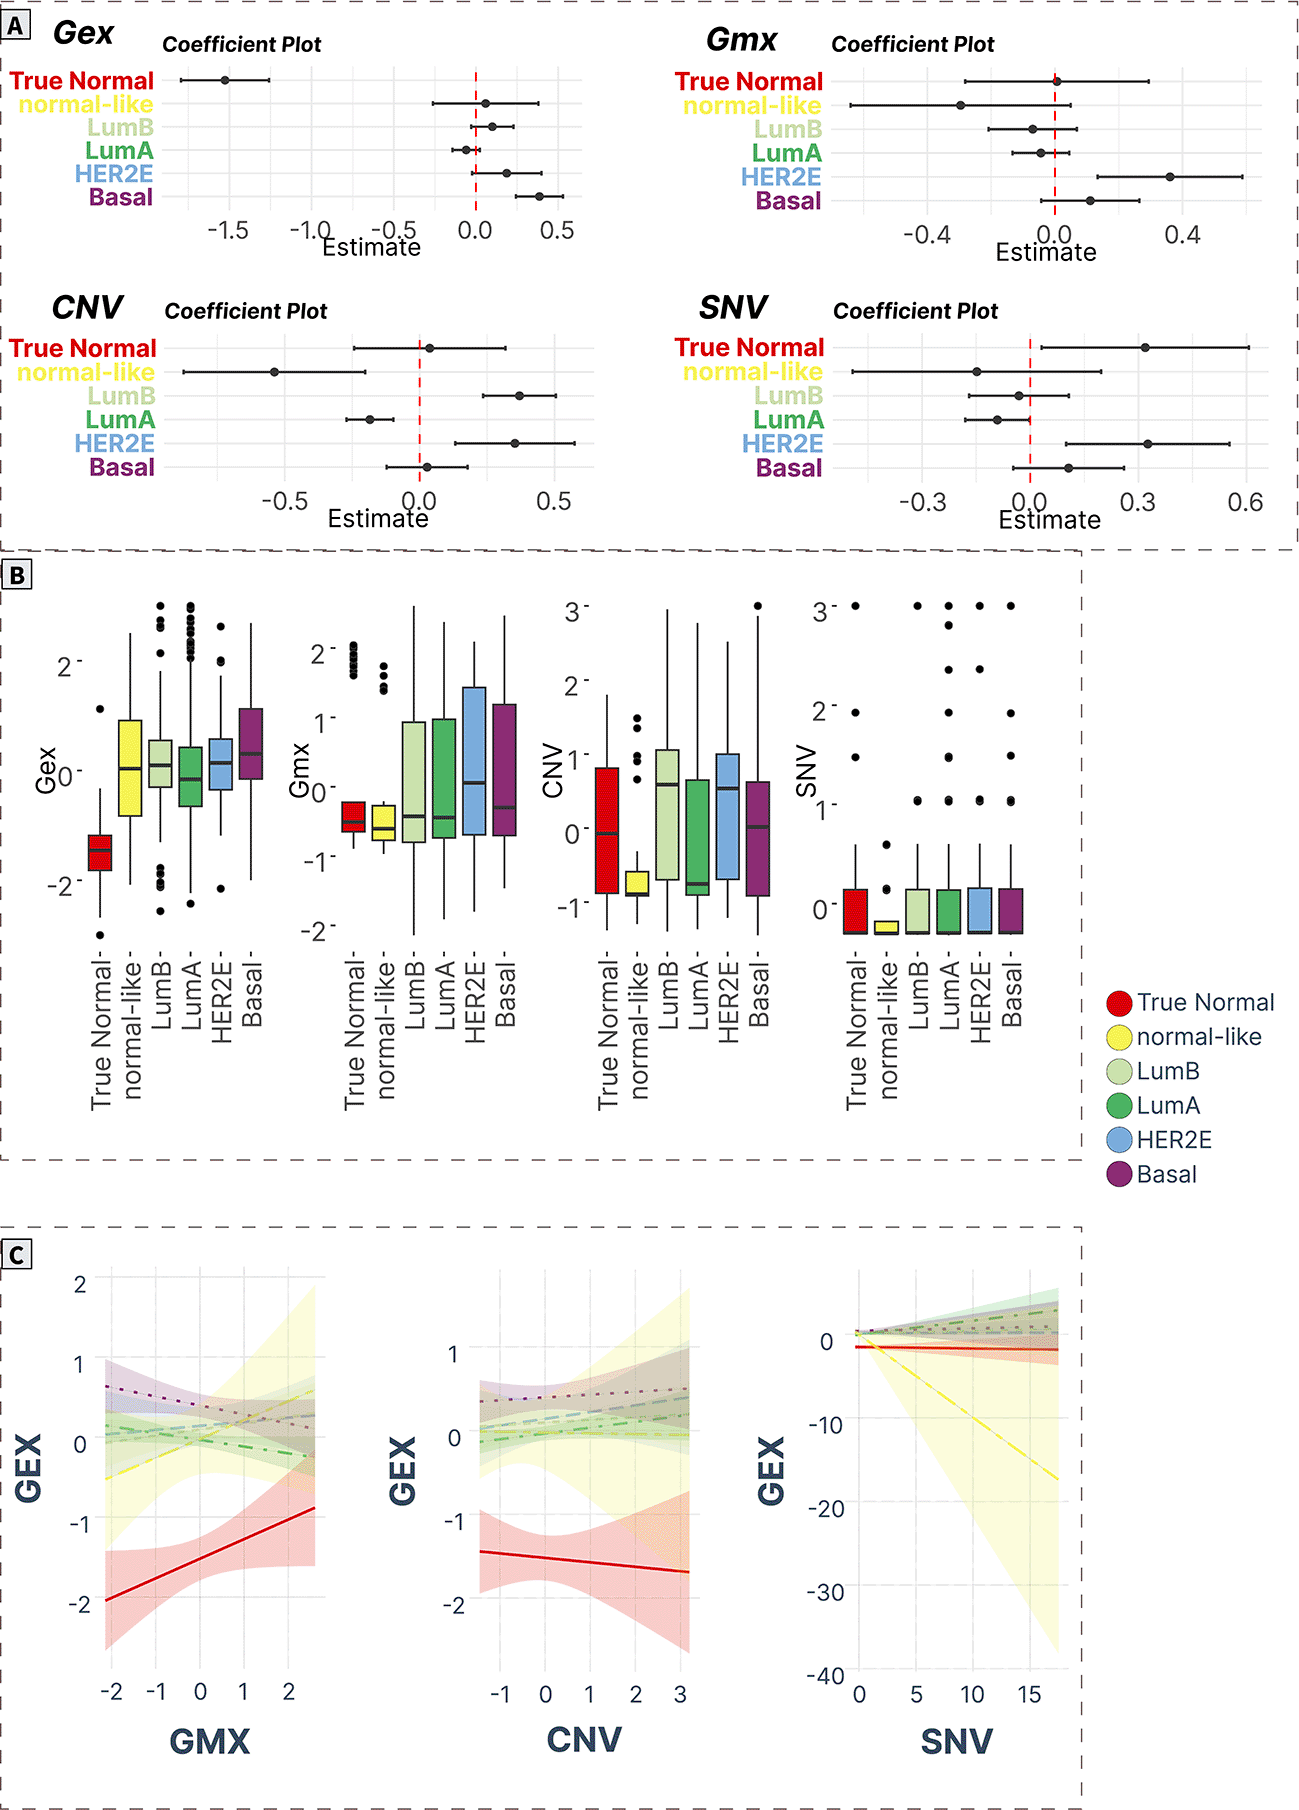
A) ANOVA/linear regression coefficient plots indicate the magnitude and significance of differences in mean levels in cancer subtypes compared to normal tissue. B) Boxplots of spot levels in cancer subtypes across SOM layers. C) Visualization of PAM50 subtype-characteristic association (regression slopes and confidence intervals) between expression (dependent variable) and epigenetic (methylation) and genomic (CNV, SNV) factors.
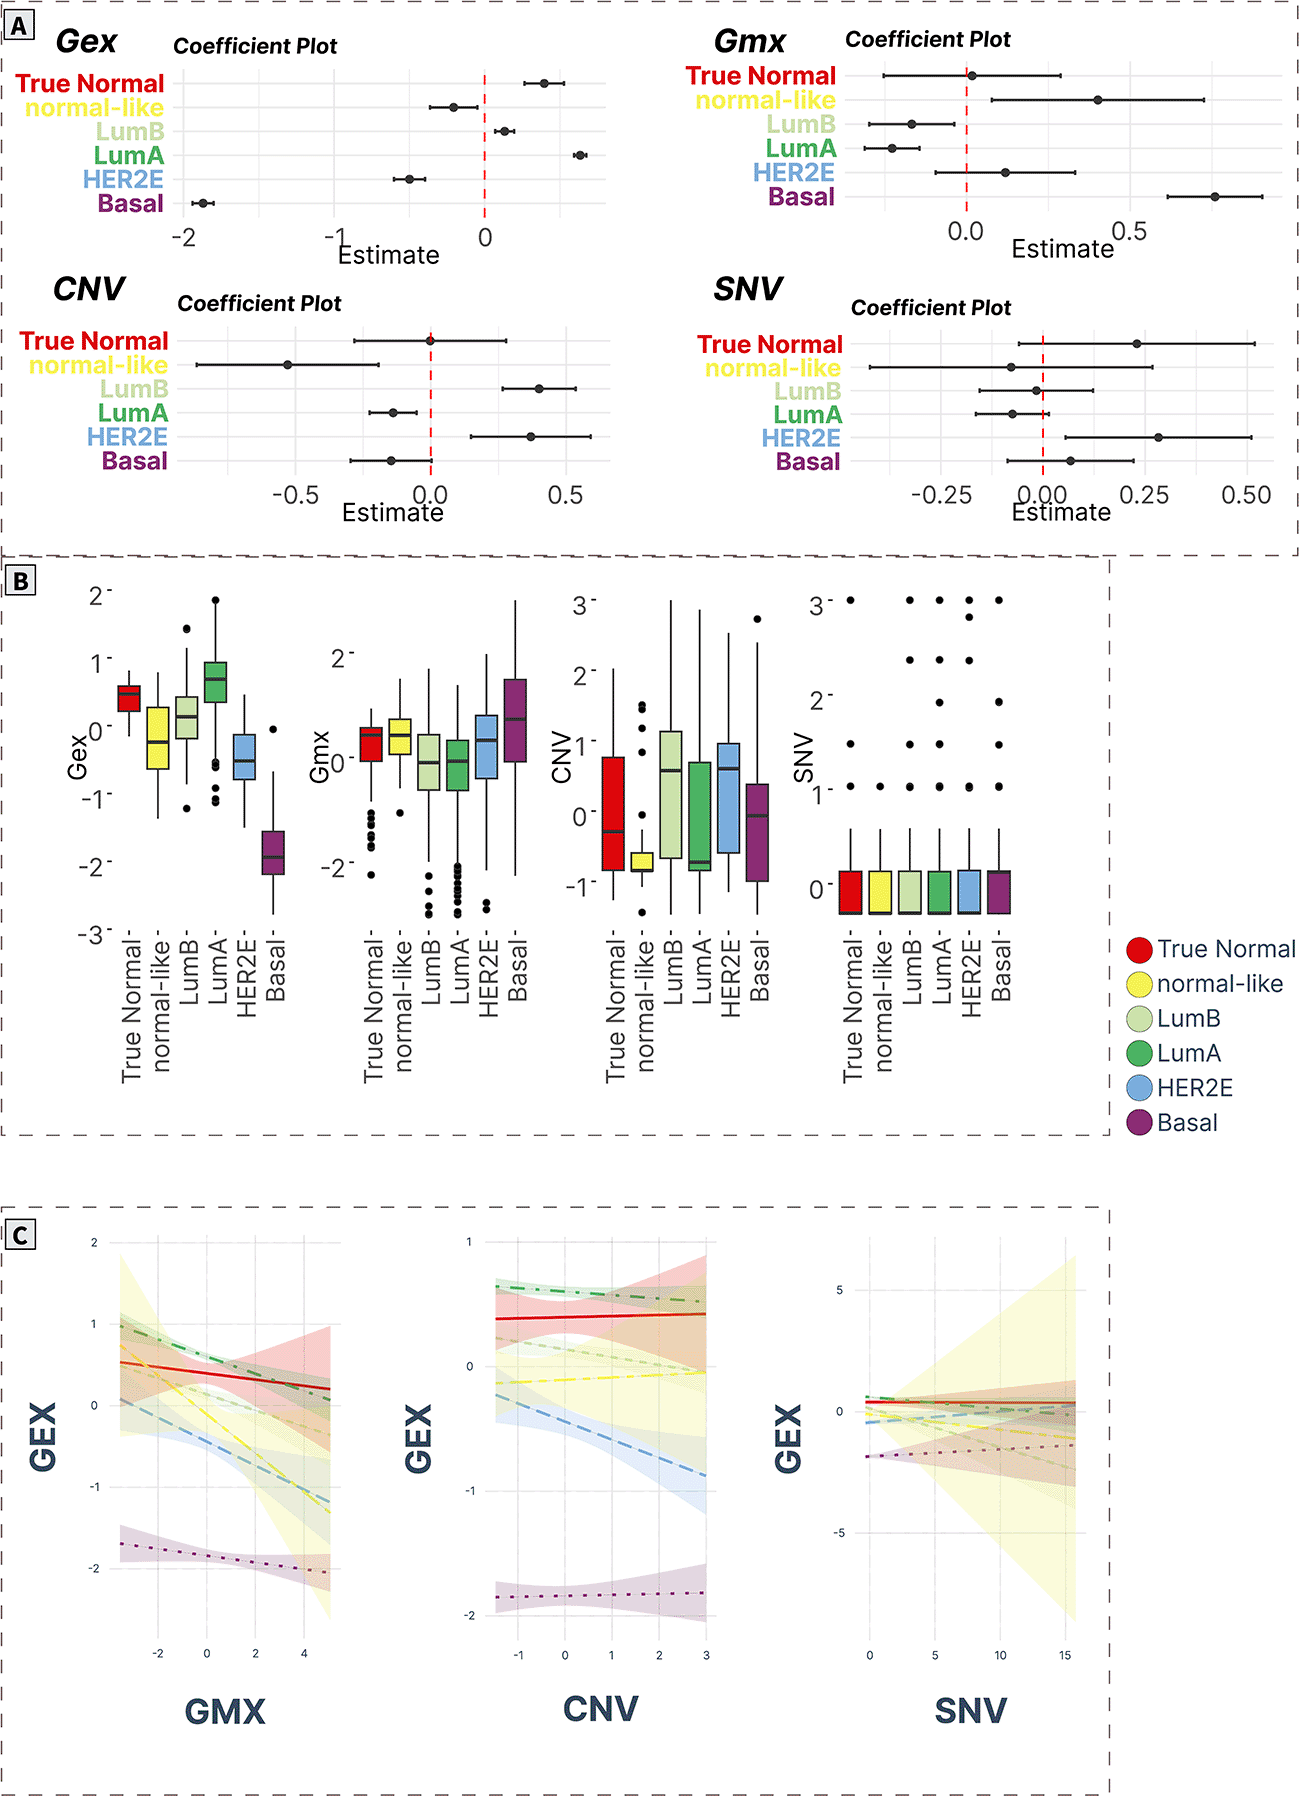
A) ANOVA/linear regression coefficient plots indicate the magnitude and significance of differences in mean levels in cancer subtypes compared to normal tissue. B) Boxplots of spot levels in cancer subtypes across SOM layers. C) Visualization of PAM50 subtype-characteristic association (regression slopes and confidence intervals) between expression (dependent variable) and epigenetic (methylation) and genomic (CNV, SNV) factors.
Cell cycle and EMT (spot A)
Spot A contained 114 genes (Supplementary Table S17 in Supplementary_Tables_S17-S24.xlsx file of “Extended data”, see Data and software availability) mostly associated with cell cycle and EMT. The Pearson’s correlation coefficient of the spot expression profile and its genes ranged from 0.21 to 0.81. The top correlated genes in the spot were KIF2C, DSCC1, RAD51AP1, DONSON, CDC123, MCM6, CLSPN, A2ML1, DKC1, and SKP2, which previously were implicated in breast cancers.41–47
The expression profiles of this gene module were significantly upregulated in all cancer groups compared to true normal tissue. Furthermore, the expression levels were gradually increased with the highest values in basal cancers compared to all other groups.
On the methylation layer, the Lum A and Lum B profiles were hypermethylated, while the basal cancers showed hypomethylation compared to true normal samples. Meanwhile, no differences were observed in the CNV and SNV layers (Figure 5A and 5B).
Mutual associations of expression with methylation and the genetic features across groups showed that the expression levels of spot A negatively correlate with methylation profiles in all cancer subtypes (except Lum A) being significant in Basal and Normal-like groups, while a significant positive correlation with CNV was observed for Lum A, Lum B, and HER2E tumors. No significant trend was observed for SNV in all cancer subtypes. Interestingly, in the true normal samples, we observed a significant positive correlation between methylation and expression (Figure 5C).
DNA repair (spot C)
DNA repair gene module (spot C) contained 165 genes (Supplementary Table S18 in Supplementary_Tables_S17-S24.xlsx file of “Extended data”, see Data and software availability) with a correlation coefficient in the range of 0.13-0.83. The top correlated genes in this module were HLTF, GIT2, ACAP2, OTUD4, ALG11, IREB2, EEA1, DCAF17, SEC24B, and GCC2.48–54
The expression profile of the spot was significantly downregulated in Lum A, basal and normal-like cancers. Methylation levels of the genes showed a significant decrease in Lum A, Lum B, and HER2E cancers compared with the true normal group. In normal-like cancers, there was also a significant decrease in CNV levels. SNV levels were not significantly different among all studied groups (Figure 6A and 6B).
Analysis of regression trends showed that the expression of spot C was positively correlated with methylation in all cancer groups, however only in Lum A, basal and normal-like groups the trends were significant (padj < 0.05). No association of expression with CNV was observed. A significant positive trend of expression-SNV counts association was observed only for normal-like cancers (Figure 6C).
Luminal cancer signature (Spot E)
The luminal gene signature (spot E) contained 118 genes (Supplementary Table S19 in Supplementary_Tables_S17-S24.xlsx file of “Extended data”, see Data and software availability) with a correlation coefficient in the range of 0.17-0.77, with the top genes being ROGDI, RAB26, HAGH, ZNF688, METRN, NPAS1, OCEL1, HDAC11, RSPH1, SLC22A18.55–60 The expression levels of this module were significantly upregulated in all cancer groups compared to true normal, with the highest values in Lum A and Lum B subtypes. Meanwhile, the methylation of these genes was significantly downregulated in the Lum A, Lum B, and HER2E cancers. The increase in CNV levels was observed only in HER2E cancers, while the SNV profile was decreased in Lum A (Figure 7A and 7B). Methylation was significantly negatively associated with expression in Lum A tumors paralleled with a positive correlation with CNV. No significant associations were recorded for SNVs in all cancer subtypes (Figure 7C).
Vitamin D signaling (Spot F)
Spot F contained only 9 genes (TATDN3, THEM4, DCAF8, DCAF6, QSOX1, SETMAR, PPA2, ATXN10, SNW1,61–65 Supplementary Table S20 in Supplementary_Tables_S17-S24.xlsx file of “Extended data”, see Data and software availability) mainly related to vitamin D signaling processes (Pearson’s correlation coefficient: 0.24-0.64). The gene expression profiles associated with this gene module didn’t change across most cancer subtypes compared with true normals except for downregulation in normal-like cancers. Furthermore, all cancers were characterized by significantly increased methylation levels (except normal-like cancers). Finally, CNV profiles were significantly downregulated in normal-like cancers. No difference in SNV levels was observed (Figure 8A and 8B).
The expression profiles were associated negatively with methylation in luminal B and normal-like cancers, and positively with CNV profiles in all groups except the true normal and normal-like groups (Figure 8C).
Immune response (Spot L)
The immune response gene module (spot L) contained 67 genes (Pearson’s correlation coefficient: 0.92-0.14). The top correlated genes in the module were FERMT3, PARVG, FMNL1, TMC8, C1QA, GMFG, LST1, BIN2, TNFRSF1B, ABI3 (Supplementary Table S21 in Supplementary_Tables_S17-S24.xlsx file of “Extended data”, see Data and software availability).66–72
The immune response signature expression profiles were upregulated in all cancers. In addition, methylation levels were significantly increased in Lum B cancer and decreased in basal cancers compared to normal tissue. CNV profile was significantly decreased only normal-like cancers (Figure 9A and 9B).
The expression of immune system genes was strongly negatively correlated with methylation profiles in all cancer subtypes. In addition, there was a positive association of expression with CNV in luminal B cancers as well as a positive association with SNV profiles in luminal A and luminal B breast cancers (Figure 9C).
Stroma and stem cells (Spot Q)
Stromal and stem cell gene module (141 genes, Pearson correlation coefficient: 0.21-0.81) with the top correlated CAV1, TGFBR2, RBMS1, CRYAB, CX3CL1, RCAN1, ETS1, ADAMTS9, LIMS2, GPX3 genes (Supplementary Table S22 in Supplementary_Tables_S17-S24.xlsx file of “Extended data”, see Data and software availability).73–80 Spot Q was characterized by downregulated expression and upregulated methylation profiles in all cancer subtypes (except basal cancers). CNV profiles were significantly upregulated in HER2E and normal-like cancers and SNV profiles were significantly downregulated in luminal A cancers (Figure 10A and 10B).
Methylation was negatively associated with the expression levels in Lum A and basal cancers. CNV levels were negatively correlated with expression in Lum A cancers. No notable correlation with expression profiles was observed for SNV (Figure 10C).
RNA splicing (Spot R)
RNA splicing gene module consisted of 207 genes (Pearson correlation coefficient: 0.14-0.85). The top correlated genes in this module were SSNA1, DRAP1, SURF2, PTGES2, RBM42, FASTK, BAX, LSM4, GUK1, and ZNHIT1 (Supplementary Table S23 in Supplementary_Tables_S17-S24.xlsx file of “Extended data”, see Data and software availability).81–85
The expression levels of the RNA splicing gene module were massively overexpressed in all cancers. In addition, CNV levels of this gene module were significantly decreased in normal-like cancers, while no other differences were observed across other omic profiles in the rest of the breast cancer subtypes (Figure 11A and 11B). No significant association between expression and other omic profiles was observed in the dataset, except for a significant positive association of SNVs in luminal A cancers (Figure 11C).
Estrogen receptor signaling (Spot S)
Finally, the expression profiles of the ESR1 signature (spot S, Pearson correlation coefficient: 0.24-0.82, top correlated genes: SCUBE2, ESR1, ABCC8, RALGPS2, APH1B, BBS4, MYB, GALNT10, LMX1B, HHAT,86–90 Supplementary Table S24 in Supplementary_Tables_S17-S24.xlsx file of “Extended data”, see Data and software availability) were significantly downregulated in Lum B, HER2E, basal, and normal-like cancers, while were significantly upregulated in the Lum A subtype. In addition, the methylation profiles in the basal subtype were significantly increased compared to the true normal tissue. CNV profiles were significantly upregulated in Lum B cancers, while no differences in SNV levels were observed (Figure 12A and 12B).
The expression profiles were negatively correlated with the methylation profiles in all cancers but were significant only for Lum A, Lum B, and HER2E subtypes. CNV profiles for HER2E and Lum B cancers also were significantly negatively correlated with the expression of ESR1 signature genes. Finally, we observed negatively correlated expression with SNV profiles in Lum A and Lum B cancers.
We aimed to summarize findings from multi-omic analyses based on breast cancer subtypes, focusing on gene modules, survival, and phenotypic characteristics. For this purpose, we constructed Cox regression models for the interaction of continuous expression, methylation, CNV, and SNV levels for each gene module and each cancer subgroup. We also generated so-called phenotype maps visualizing the association between clinical phenotype parameters with different omic layers as described in our previous publication.13
We found that gene signatures associated with EMT/cell cycle, luminal, immune system, and RNA splicing were upregulated across all cancer subtypes compared to normal tissue. Conversely, stromal/stem cell signatures were downregulated across all cancer subtypes. The expression levels of RNA splicing genes remained consistent across all cancer subtypes. Immune signature genes were notably higher in HER2E, basal, and normal-like cancers than in luminal A and B subtypes. For other gene modules, the extent of expression was varied along with cancer subtypes. Specifically, the expression of the EMT/cell cycle module progressively increased from luminal A through normal-like, luminal B, HER2E, to basal cancers, with the highest expression noted in basal cancers. Similarly, for luminal gene signature, the expression gradually increased from basal through normal-like, HER2E, luminal A to luminal B cancers. Finally, gradual downregulation of stromal/stem cell signature was observed from normal-like through basal, luminal A, HER2E to luminal B subtypes. Interestingly, these changes were paralleled with the increase in methylation levels. In addition, we observed consistently increased methylation levels of VDR genes across all cancer types, except the normal-like category. However, this was not associated with any notable changes in their expression levels. In addition to these changes shared by all cancer subtypes, there were more subtype-characteristic perturbations (Figures 5-12).
Thus, luminal A cancers were additionally, characterized by downregulation of expression and methylation of DNA repair genes, and overexpression of ESR1 signature genes as the most dominant feature for this cancer subtype. Finally, this subtype showed decreased counts of SNVs in the immune system, stromal/stem cells, and RNA splicing genes. Interestingly, EMT/cell cycle gene expression in this subgroup was upregulated despite increased methylation levels; however, their expression levels were positively correlated with CNVs. The survival in luminal A cancers was associated with several gene modules on different omic layers, with the highest impact of the low expression levels of EMT and DNA repair genes on favorable survival prognosis. The luminal A cancers showed multiple significant associations with clinical phenotypes (Figure 14). Particularly, the overexpression of DNA repair genes was associated with poor prognosis. Moreover, increased SNV profiles and decreased methylation of these genes in this cancer type were associated with advanced stages of American Joint Committee on Cancer’s (AJCC) tumor pathologic assessment; particularly with pathologic M (metastasis) and pathologic N (lymph nodes). Furthermore, the increased expression of luminal cancer gene signature was associated with the presence of prior malignancies.
The luminal B subtype exhibited expression changes similar to luminal A cancers, except for unchanged expression DNA repair genes and a downregulated ESR1 signaling gene signature (spot S). This specific downregulation in luminal B was not linked to significant changes in methylation or CNV when compared to luminal A cancers. However, it showed a negative correlation with the SNV profile, not observed in luminal A cancers. Moreover, the methylation profiles in these two luminal subtypes closely resemble, except for increased methylation of immune system genes in the luminal B cancers. We did not observe any significant association with survival in this cancer subtype, except for methylation of immune system genes with borderline significance (p=0.0678) (Figure 13). Phenotype portraits for this cancer subtype showed a positive association of advanced AJCC pathologic staging, and, in particular AJCC pathologic M with expression and methylation of RNA splicing genes as well as decreased expression and methylation of DNA repair genes. AJCC pathologic T (primary tumor) was positively associated with the increased CNV profiles of the EMT/cell cycle and immune response genes.
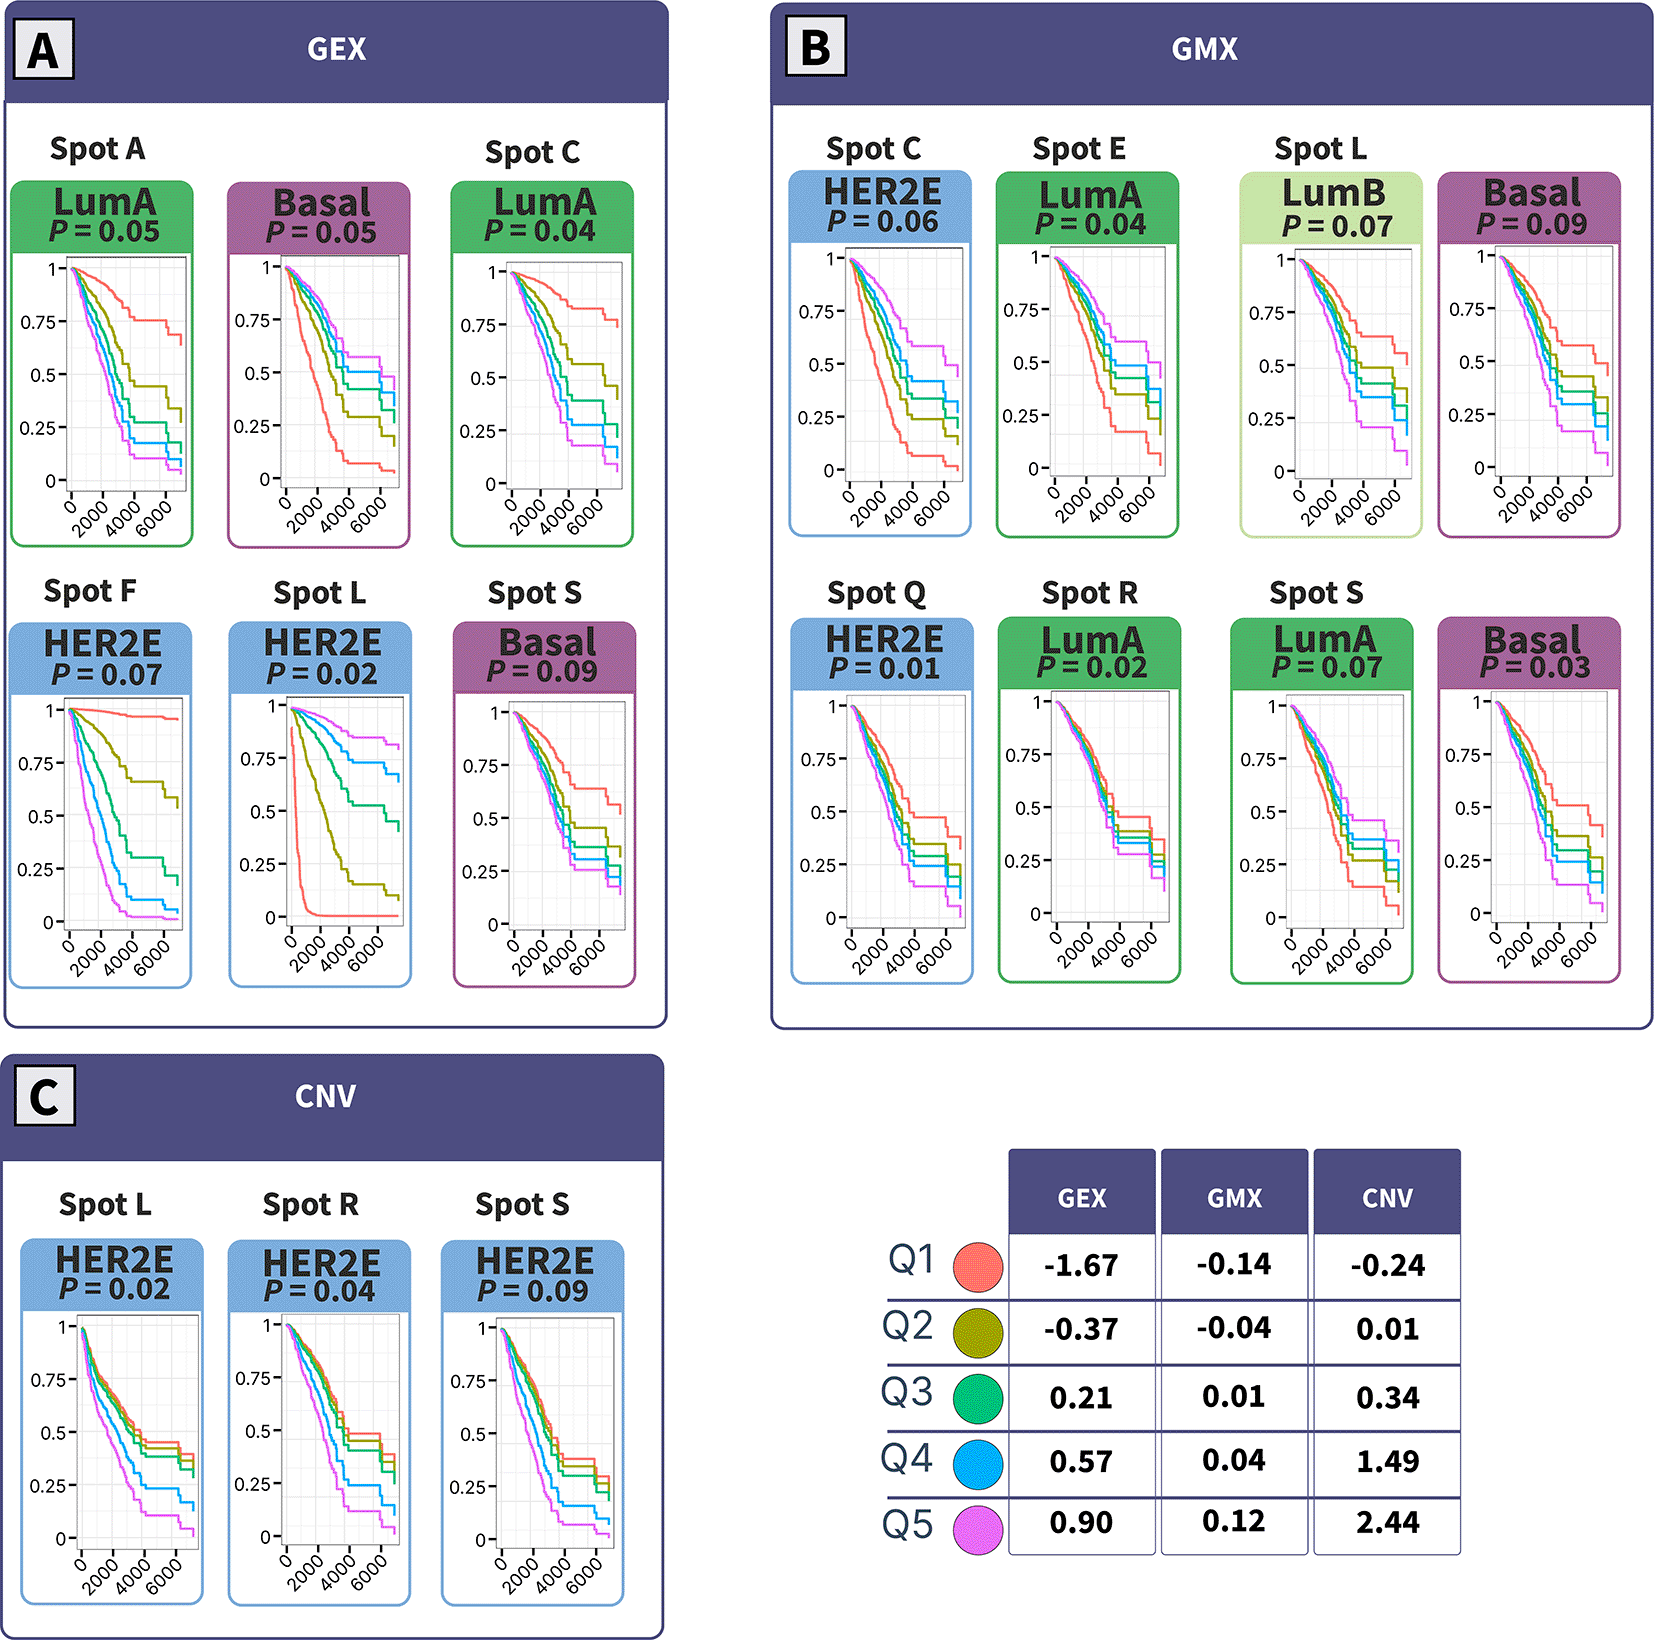
Survival analysis was performed using the Cox proportional hazards regression with the inclusion of spot levels as continuous variables using “contsurvplot”, “survival”, and “survminer” packages. Survival curves were visualized with range values with 5 intervals (Q1: minimum, Q2: 25th percentile, Q3: 50th percentile, Q4: 75th percentile, Q5: maximum). Only plots with survival-spot association with p-value ≤ 0.1 are displayed.
The transcriptome profiles for the HER2E subtype were closely aligned with those of luminal B, differing only in the magnitude of changes. Unlike in the luminal B subtype, methylation levels of EMT/cell cycle genes in the HER2E subtype remained unchanged compared to the true normal samples. Furthermore, this subtype exhibited increased CNV profiles for luminal and stromal/stem cell gene signatures. Notably, the survival impact for this cancer subtype was most influenced by the underexpression of the VDR gene signature and the overexpression of immune system genes (Figure 13). In agreement with the survival data, the negative association of vital status with the overexpression of immune system genes was observed. Moreover, the overexpression of the luminal cancer signature was positively correlated with advanced tumor staging (Figure 14).
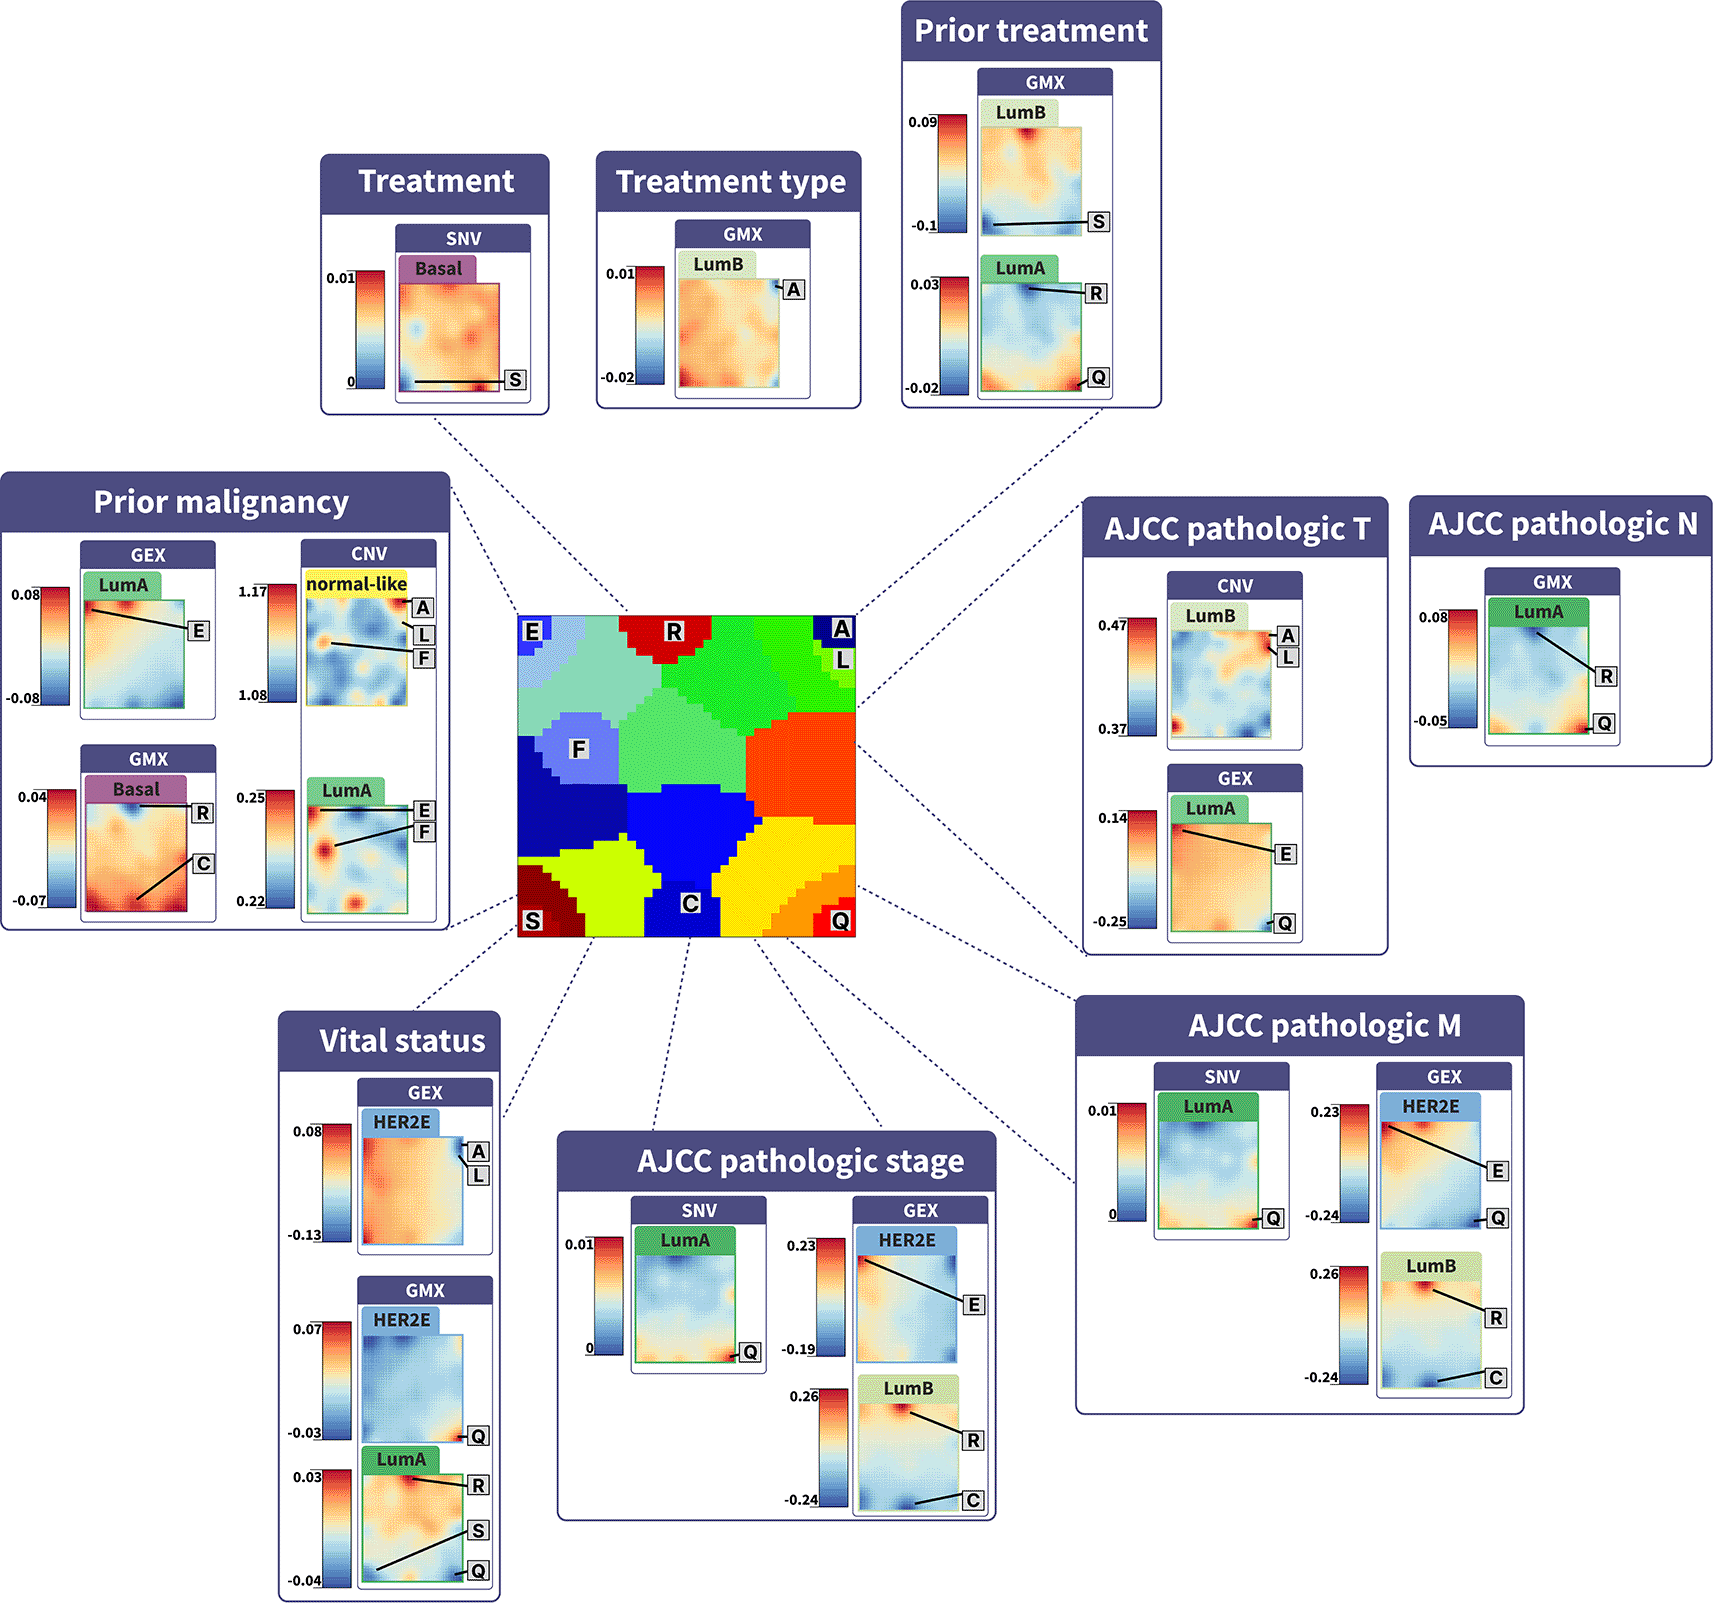
Phenotype portraits show the -log10(p) regression model of SOM metagene levels and clinicopathological stages, vital status, and treatment variables. Deregulated gene modules (spots) are indicated on the maps and coloring shows the significance of their association with evaluated parameters.
Unlike Lum A, Lum B, and HER2E cancers, in basal cancers, a strong negative correlation existed between the overexpression of EMT/cell cycle gene signatures and decreased methylation levels. A similar relationship between underexpression and methylation levels was noted for DNA repair genes. This cancer subtype’s survival was linked to various gene modules across omic layers, with hypomethylation of the ESR1 gene signature having the most significant positive impact on prognosis (Figure 13). Furthermore, the prior malignancy was positively associated with increased methylation of DNA repair genes and decreased methylation of RNA splicing genes (Figure 14).
Finally, the normal-like cancers were characterized with additional underexpression of VDR signaling signature and a decrease of CNV profiles in almost all gene modules (DNA repair, luminal cancer, VDR, immune response, stromal/stem cells, RNA splicing) compared to other cancer subtypes. No specific gene modules were significantly associated with survival for this cancer subtype, however, we observed a significant association of CNV increase in VDR signaling, EMT/cell cycle, and immune system genes with prior malignancy in this cancer subtype (Figure 14).
This study analyzed the omic landscapes in breast cancer PAM50 subgroups. Our results confirmed the multi-omic molecular heterogeneity of cancer subtypes as well as showed that this heterogeneity results in subtype-characteristic associations between transcriptomic, genomic, and epigenetic features as well as with clinical parameters and survival across disease subtypes (graphical representation is given in Figure 15).
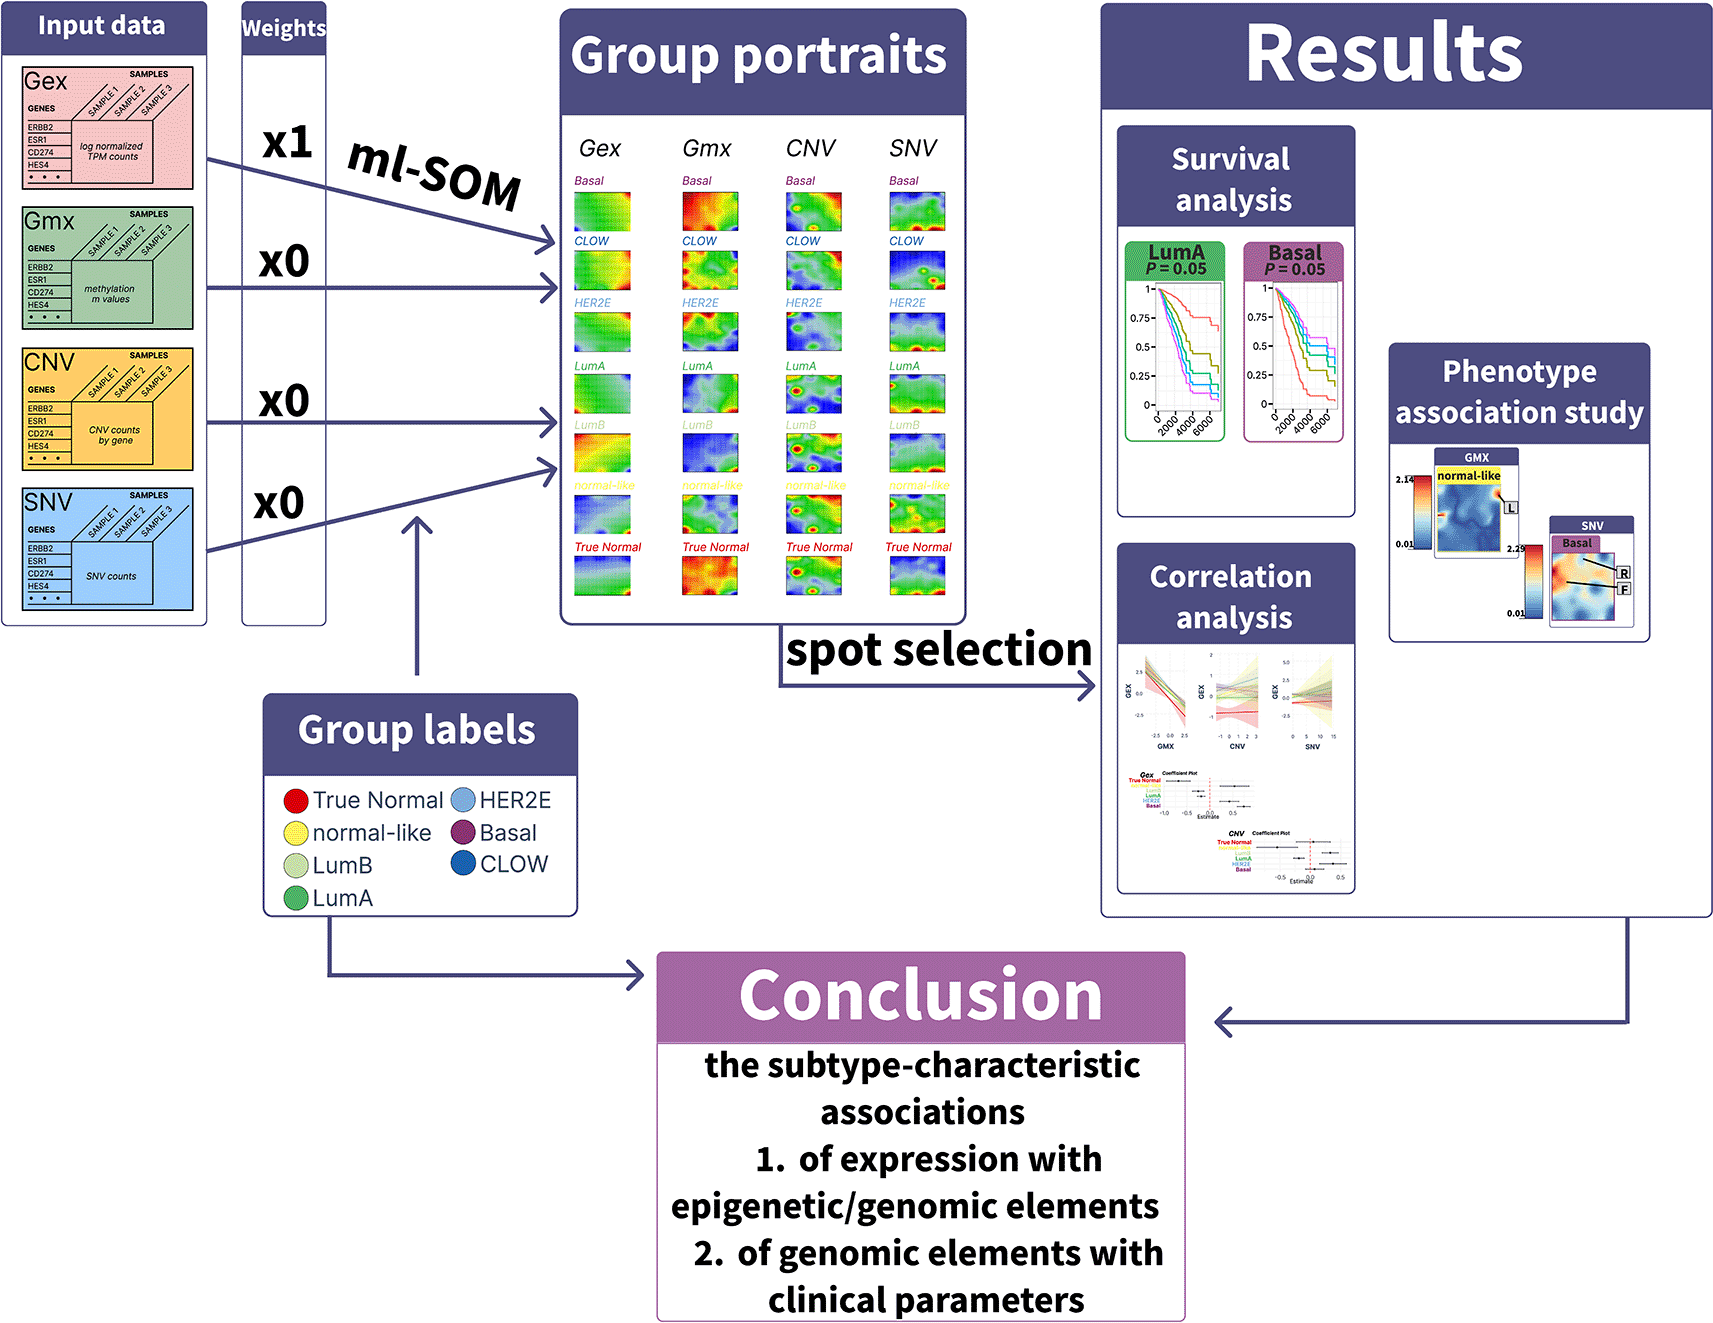
The results show that the molecular diversity of breast cancer is most comprehensively captured through a multi-omic overview of perturbed gene modules. The study also found subtype-specific associations between omic features, as well as distinct relationships between these features and subtype survival rates and clinical characteristics.
The changes in gene expression across cancer subtypes were more qualitative rather than quantitative. All breast cancer subtypes showed upregulation of EMT/cell cycle, luminal signature, immune response, and RNA splicing genes and downregulation of stromal/stem cell signature genes. These gene modules represent the fundamental processes related to breast cancers and were extensively studied elsewhere.91 However, the extent of deregulation of the modules showed considerable subtype association. Indeed, previous studies clearly demonstrated the differences in the expression of proliferative and metastatic signatures in basal cancers compared with the luminal cancers and HER2E cancers, indicating the more aggressive nature of the latter subtype.92,93 Immune/inflammatory gene signatures were lowest in luminal cancer subtypes and highest in normal-like, HER2E, and basal subtypes, which also corresponds to the previous findings.93,94 The luminal gene signature, in contrast, was reversed being highest in the luminal A and B cancers and lowest in the basal subtype. The most striking difference on the transcriptome layer was the overexpression of ESR1 genes in the luminal A subtype, while in other PAM50 subtypes including luminal B cancers, they were considerably lower. This finding is, however, confirmatory, since the higher expression of ER-related genes and lower expression of proliferative genes in luminal A cancers has been described previously.95,96
Methylation levels of perturbed gene modules showed higher diversity compared to expression levels. Indeed, EMT/cell cycle genes were hypomethylated in basal cancers which well agrees with their overexpression. However, overexpression of the same genes in HER2E cancers was not paralleled with significant changes in methylation compared to normal tissue; moreover, in luminal A and luminal B cancers, the same genes were significantly hypermethylated despite their increased expression. Immune response genes were significantly hypomethylated in luminal A, luminal B, and HER2E cancers, but no differences were observed for basal and normal-like cancers. We observed hypermethylation of the ESR1 gene signature in basal cancers, consistent with previously reported results.97 On the other side, the underexpression of the same gene module in other cancer subtypes was not associated with changes in the methylation levels. The differential methylation in PAM50 subtypes was reported previously,98 moreover, the incorporation of methylation caused improvement in class prediction of subtypes.99
CNV changes are common in breast cancers,100 moreover, they show subtype-characteristic amplifications or deletions.101 The CNV profiles of practically all gene modules were lower in normal-like breast cancers compared to other cancer subtypes. This subtype closely resembles normal breast tissue however11 and shows low levels of expression of genes associated with cell proliferation and higher expression of genes related to adipose tissue and normal mammary gland function.102 Despite their “normal-like” gene expression pattern, these cancers can still behave aggressively.103 Interestingly HER2E was characterized by a CNV increase in luminal gene signature that includes oncogenes on chromosome 9.104
Our study also indicated that somatic alteration counts were not much different between breast cancer subtypes. These findings corroborate prior research that reports no difference in somatic mutation load across PAM50 subtypes,105 although differences in the types of mutations are observed in the previous studies. For instance, TP53 mutations are more prevalent in basal subtypes, PIK3CA mutations are common in HER2-enriched subtypes, and mutations in GATA3, FOXA1, XBP1, and MYB are typically found in the luminal A subtype.98 Thus, the mutation counts in genes may not be a good characteristic for cancer subtypes.
The abovementioned results specifically demonstrate that similarities in expression levels do not necessarily reflect across other genomic and epigenetic layers. This raises the question if associations of omic data are similar or different across breast cancer subtypes. Multi-layer SOM approach allowed exploring this issue with considerable detail. It is well known that promoter methylation and CNVs are important regulators of gene expression.106,107 The general understanding is that methylation drives the silencing of gene expression,108 however, it has been demonstrated that many genes are active in the methylated state both in normal and cancer cells.109 Somatic CNVs, as well, can have both activating and silencing effects in cancer.100 The somatic single nucleotide variations (SNVs), which predominantly impact protein structure and function rather than regulatory mechanisms110 usually showed minimal effects on the transcriptome. Our results clearly demonstrated that expression-methylation-CNV-SNV associations substantially vary in different breast cancer subtypes. Perhaps, the most striking example is the expression of cell cycle and EMT genes overexpressed in all cancer subtypes. However, only in basal and normal-like cancers it was strongly associated with their hypomethylation,111 while, in Lum A, Lum B, and HER2E cancers CNVs were increased along with upregulated expression.112
The diversity of omic data associations across subtypes was reported previously in cancers,113,114 including breast cancer.115 Analysis of how different omic layers interact in cancers remains limited, but this is a crucial aspect of therapeutic development. Different approaches may be needed to target the same genes across various subtypes based on the understanding of these interactions.
Although the overall survival rate within the TCGA breast cancer cohort is relatively high,116 we demonstrated that within subtypes, survival rates could be linked with specific deregulations in gene expression, methylation, or copy number variation of described functional gene modules. This suggests that molecular alterations can have a significant impact on the prognosis within individual breast cancer subtypes and multi-omic type predictors can significantly improve assessment of survival and prognosis.117
The majority of omic data integration studies are focused on building multi-omic classifiers rather than understanding the relations between expression, methylation, and CNVs.118–121 An exemplary study was done by Ochoa and de Anda-Jáuregui who analyzed the gene expression regulation of 50 genes in the PAM50 subtypes and found a unique set of predictors for the expression of genes in the PAM50 signature associated with each of the molecular subtypes.122 However, only a few studies focus on the analysis of intricate omic features of breast cancer subtypes98 or try to understand the complexity of their interactions.123,124 In this sense, our study offers a significant advancement in understanding the complexity of molecular events and their interactions in breast cancer subtypes with the implications for survival and clinical parameters.
There are several limitations worth pointing out in this study. First, we didn’t integrate other regulatory elements such as transcription factors,125 miRNAs,126 or chromatin modifiers,127 which were shown to be implicated in breast cancers. Furthermore, the sample size per breast cancer subtype is imbalanced in the TCGA-BRCA cohort. The largest number of samples have Lum A subtype (480 samples), which implies higher statistical power to detect significant associations between different omic layers compared to normal-like (32 samples) or HER2E (74 samples) cancers.
Multi-omics SOM analysis allowed characterization of molecular diversity of breast cancer subtypes in term of perturbed gene modules across expression, methylation, copy number and single nucleotide variations. Moreover, the results highlight the complex subtype-characteristic associations between gene expression and epigenetic/genomic factors and their implications for survival and clinical outcomes.
Conceptualization - AA, HB; Data Curation - SD, GeM, GM, ACh, AM, HG; Formal Analysis - SD, AA; Funding Acquisition - AA; Investigation - SD; Methodology - AA, HB; Project Administration - AA, HB; Resources - AA; Software - SD, AA; Supervision - AA, HB; Validation - GeM, GM, ACh, AM, HG; Visualization - SD; Writing – Original Draft Preparation - SD, AA, HB; Writing – Review & Editing - SD, AA, HB. All authors have read and agreed to this version of the manuscript.
Zenodo: Integrated analysis of “-omic” landscapes in breast cancer subtypes: Supplementary Dataset. https://doi.org/10.5281/zenodo.10947982. 128
The project contains the following underlying data:
- BRCA_mlSOM_Dataset.zip (The Data folder contains TCGA-BRCA omic (RNA-Seq, methylation, CNV, and SNV) processed data and multi-SOM pipeline scripts. The BRCA-TCGA-mlSOM folder contains scripts for multi-SOM downstream analysis including functional annotation of gene modules (spots), comparison of their levels in cancer subtypes with true normal tissue, regression analysis for assessment of the association between omic layers, survival, and clinical parameter analysis. It also contains the file representing the results of the SOM analysis for each omic layer (expr - Results folder - expression, prom - Results folder - promoter methylation, cnv - Results folder - copy number variations, amd snv - Results folder - somatic single nucleotide variation), as well as phenotype portraits per omic laver (organized in pheno.exp, pheno.met, pheno.cnv, and pheno.snv) folders. The Supplementary data folder contains supplementary tables and figures cited in the text.)
Zenodo: Integrated analysis of “-omic” landscapes in breast cancer subtypes: Supplementary Dataset. https://doi.org/10.5281/zenodo.10947982. 128
The project contains the following extended data:
- BRCA_mlSOM_Dataset.zip (The Data folder contains TCGA-BRCA omic (RNA-Seq, methylation, CNV, and SNV) processed data and multi-SOM pipeline scripts. The BRCA-TCGA-mlSOM folder contains scripts for multi-SOM downstream analysis including functional annotation of gene modules (spots), comparison of their levels in cancer subtypes with true normal tissue, regression analysis for assessment of the association between omic layers, survival, and clinical parameter analysis. It also contains the file representing the results of the SOM analysis for each omic layer (expr - Results folder - expression, prom - Results folder - promoter methylation, cnv - Results folder - copy number variations, amd snv - Results folder - somatic single nucleotide variation), as well as phenotype portraits per omic laver (organized in pheno.exp, pheno.met, pheno.cnv, and pheno.snv) folders. The Supplementary data folder contains supplementary tables and figures cited in the text.)
Data are available under the terms of the Creative Commons Attribution 4.0 International license (CC-BY 4.0).
Grammar checks and text style revisions were conducted with the support of ChatGPT, an AI-based tool.
| Views | Downloads | |
|---|---|---|
| F1000Research | - | - |
|
PubMed Central
Data from PMC are received and updated monthly.
|
- | - |
Is the work clearly and accurately presented and does it cite the current literature?
Yes
Is the study design appropriate and is the work technically sound?
Yes
Are sufficient details of methods and analysis provided to allow replication by others?
Yes
If applicable, is the statistical analysis and its interpretation appropriate?
Yes
Are all the source data underlying the results available to ensure full reproducibility?
Yes
Are the conclusions drawn adequately supported by the results?
Yes
Competing Interests: No competing interests were disclosed.
Reviewer Expertise: Genomics, breast cancer, transnational medicine
Is the work clearly and accurately presented and does it cite the current literature?
Yes
Is the study design appropriate and is the work technically sound?
Yes
Are sufficient details of methods and analysis provided to allow replication by others?
Partly
If applicable, is the statistical analysis and its interpretation appropriate?
Partly
Are all the source data underlying the results available to ensure full reproducibility?
Yes
Are the conclusions drawn adequately supported by the results?
Yes
Competing Interests: No competing interests were disclosed.
Reviewer Expertise: Computational transcriptomics
Alongside their report, reviewers assign a status to the article:
| Invited Reviewers | ||
|---|---|---|
| 1 | 2 | |
|
Version 1 03 Jun 24 |
read | read |
Provide sufficient details of any financial or non-financial competing interests to enable users to assess whether your comments might lead a reasonable person to question your impartiality. Consider the following examples, but note that this is not an exhaustive list:
Sign up for content alerts and receive a weekly or monthly email with all newly published articles
Already registered? Sign in
The email address should be the one you originally registered with F1000.
You registered with F1000 via Google, so we cannot reset your password.
To sign in, please click here.
If you still need help with your Google account password, please click here.
You registered with F1000 via Facebook, so we cannot reset your password.
To sign in, please click here.
If you still need help with your Facebook account password, please click here.
If your email address is registered with us, we will email you instructions to reset your password.
If you think you should have received this email but it has not arrived, please check your spam filters and/or contact for further assistance.
Comments on this article Comments (0)