Keywords
power function distribution, weighted power function distribution, attribute control chart, truncated life test, average run length, simulation
power function distribution, weighted power function distribution, attribute control chart, truncated life test, average run length, simulation
Statistical process control is used as an effective tool to monitor the manufacturing process and prevent products from being out of the given provisions. Two different types of control charts are available in the literature: variable control charts and attribute control charts. When numerical measurements of the variable of interest from any process are available, the use of a variable control chart is preferred. However, there are many processes that have a variable of interest in the form of attributes and are not measurable. In such situations, it is preferable to use attribute control charts instead of variable control charts.
Attribute control charts are used to monitor a process with two possible outcomes: conforming and nonconforming. The basic condition for using these charts was the assumption of normality. However, in real-life situations, whenever a process is working, the outcome may not follow a normal distribution.
It is possible that the shape of the distribution is skewed. For such cases, many studies, such as Chang and Bai,1 Lin and Chou,2 and Rao and Subbaiah,3 have been conducted. Work on attribute control charts considering different skewed distributions has also been done by Aslam et al.,4 Karagöz,5 and Noiplab and Mayureesawan.6 We can also refer to Zaka et al.,7 who modified the attribute control chart for the shape of the process using the power function and survival-weighted power function distribution.
The shape of any distribution can be studied by estimating its shape parameter. Several estimators have been developed to estimate the shape parameters of any distribution. Zaka et al.7 introduced and studied an attribute control chart for the shape of the process using the power function and survival-weighted power function distribution. Dallas8 introduced the power function distribution (PFD) as a powerful tool to study many processes in reliability and health sciences, which was further assumed and modified to increase its applicability in unequal probability theory by Zaka et al.9 as the weighted power function distribution (WPFD). Jabeen and Zaka10 proposed modified control charts based on shape parameters.
We introduce the PFD and WPFD in Section 2. In Section 3, we propose an attribute control chart for PFD and WPFD. A discussion of the use of the proposed control chart is presented in Section 4.
The weighted power function distribution (WPFD) was used by Zaka et al9 by modifying the existing Power function distribution (PFD). The cumulative distribution function and probability density fuction for PFDand WPFD is given asintroduced
The control limits for attribute control charts to monitor the shape parameter of weighted Power fuction distribution is illustrated in from Zaka et al.7 and similarly the control limits for attribute control charts is given by Aslam et al.11 , the proposed control limits are given as:
where p0 is the failure probability, n is the sample size, and L is the control coefficient. Thus, it is obtained from (1) and (2) as follows:
where are scale parameters and are the shape parameters for the two proposed distributions.The control limits are presented as
where is the average number of failures over the subgroups.We can find the ARL using the following formulae
where the probability of the control chart for being in the state of control is2.1.1. The probabilities of failure for PDF in out of control process are
→ When the shape parameter varies →
→ When the scale parameter varies →
→ All the parameters vary →
2.1.2. The probabilities of failure for WPFD in out of control process are
→ When the shape parameter varies →
→ When the scale parameter varies →
→ All the parameters vary →
We used when the shape parameters varied from for the first and second distributions, respectively. We also used when the shape parameters varied from for the first and second distributions, respectively.
When the parameter is shifted from , the probability in the control process is
We adopt . The probability of in-control for the shifted process is
The ARL to compare the efficiency of the process after the shift is
When the scale and shape parameters are shifted as and we get the probability
The ARL for the shifted process is
Zaka et al.7 provided the simulation steps to conduct the monitoring of the shape parameter of weighted power function distribution. By considering these steps we assumed different observations of the ARL, shape parameter, and a. For these observations of ARL, we took the values of the shape and scale parameters of the control chart and sample size (n) in such a way that the ARL from equation (ARL0) was close to R0. Using equation (ARL1) and the values fixed in equation (2), we found ARL1 using different values of c,, R0, a, and n, which are in Tables 1-4.
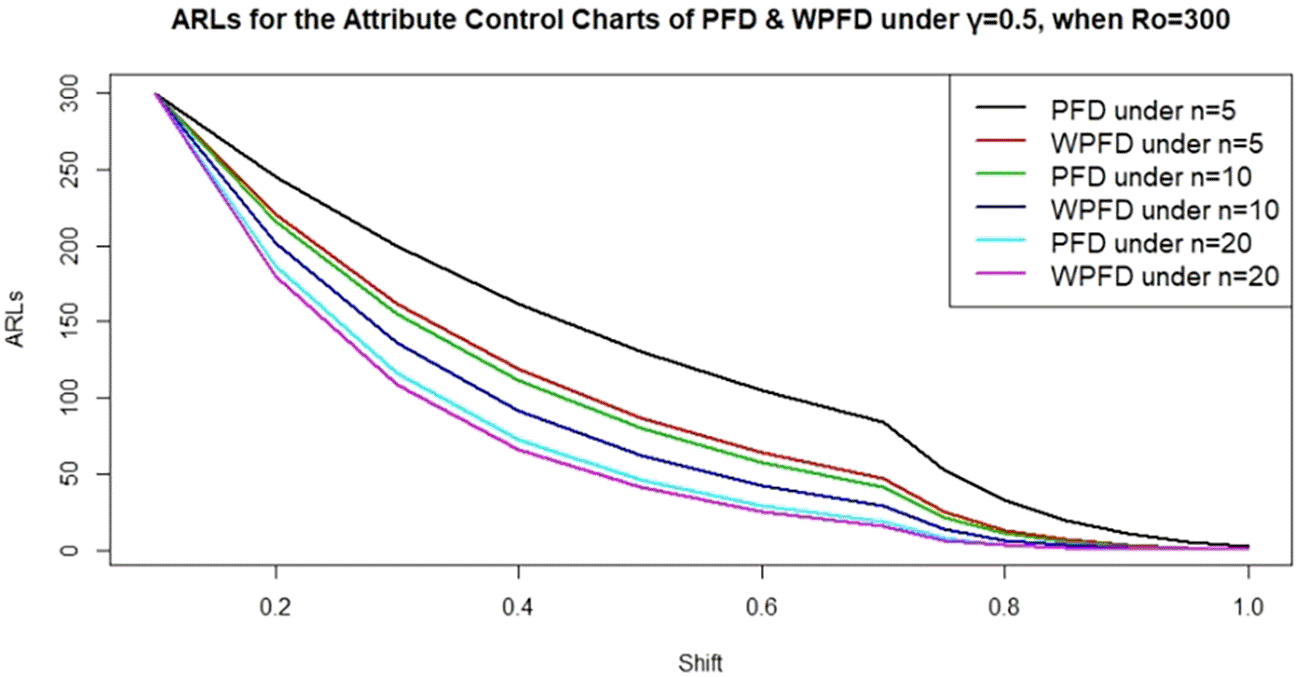
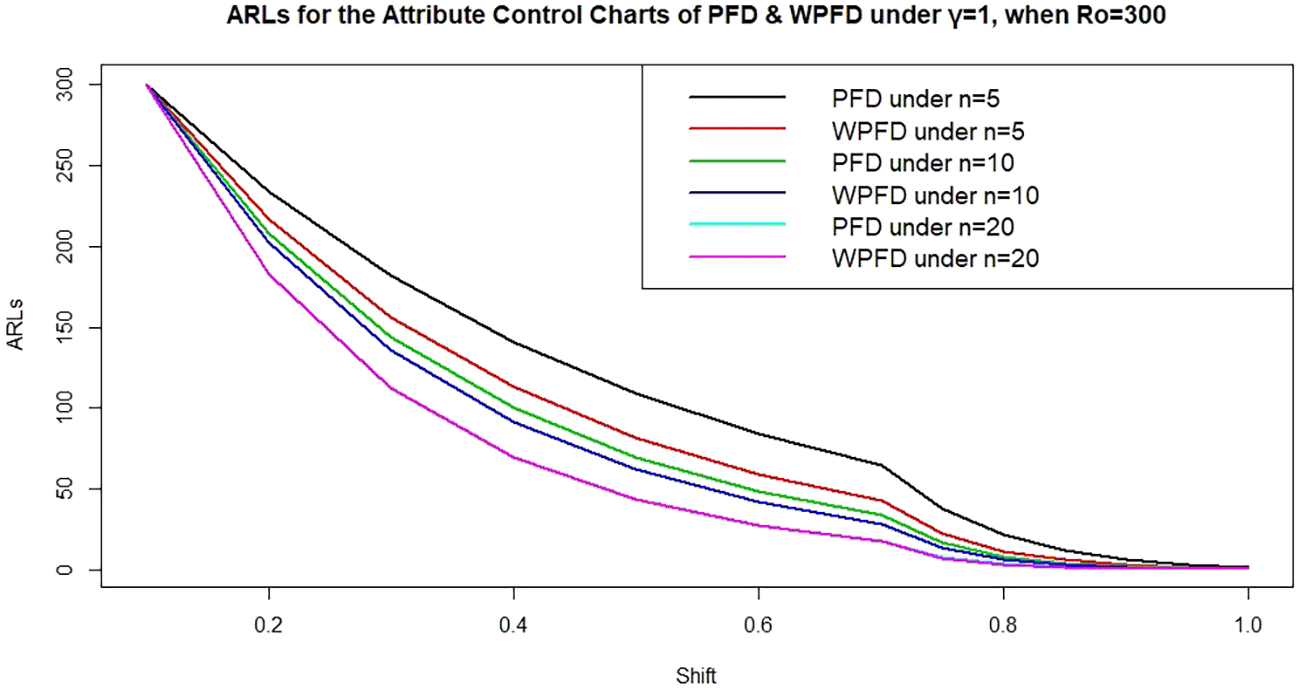
To study the proposed control charts (Section 3), we assume the shape parameter as We also assumed a target ARL value of 300 and simultaneously for the in-control process. We assume a shift of 0.1 in the shape parameter for PFD and WPFD, and n = 5, 10, and 20. The results are presented in Tables 1-3 and Figures 1-2. We observed a rapid decrease in ARL for WPFD compared to PFD, with a decrease in C and an increase in n. We see that for to , there is an early detection in out of control ARLs for both the PFD and WPFD control chart. We also observed that with an increase in the size of the sample and the value of the shape parameter, the WPFD proved to be more reliable for use instead of PFD.
In this section, we generated data from the PFD and WPFD. Let n=10 and R0=300,and , where i=1, 2. We generated the first 10 observations from the process under control and the next 20 observations from the shifted process using shift = 0.85, as presented in Table 4. We used the life test termination times t01=0.31259*and t02=0.2235101*. Figures 3 and 4 show the 30th observation (10th observation after the shift) using the WPFD control chart. We conclude that WPFD is more efficient than the PFD control chart.
| PFD | WPFD |
|---|---|
| 6 | 3 |
| 2 | 2 |
| 4 | 5 |
| 5 | 4 |
| 2 | 6 |
| 1 | 3 |
| 3 | 4 |
| 4 | 2 |
| 5 | 5 |
| 7 | 5 |
| 3 | 6 |
| 2 | 2 |
| 4 | 3 |
| 5 | 2 |
| 4 | 1 |
| 2 | 3 |
| 1 | 5 |
| 4 | 5 |
| 5 | 5 |
| 6 | 2 |
| 7 | 3 |
| 6 | 4 |
| 3 | 6 |
| 5 | 7 |
| 4 | 1 |
| 4 | 5 |
| 6 | 4 |
| 3 | 2 |
| 2 | 5 |
| 5 | 4 |
| 7 | 8 |
| 3 | 2 |
| 5 | 5 |
| 4 | 5 |
| 4 | 2 |
| 3 | 3 |
| 2 | 5 |
| 1 | 1 |
| 5 | 3 |
| 4 | 2 |
We used survival time data for a group of patients given by Bekker et al.12 The data consisting of survival times (in years) for 46 patients were: .0470, .1150, .1210, .1320, .1640, .1970, .2030, .2600, .2820, .2960, .3340, .3950, .4580, .4660, .5010, .5070, .5290, .5340, .5400, .6410, .6440, .6960, .8410, .8630, 1.0990, 1.2190, 1.2710, 1.3260, 1.4470, 1.4850, 1.5530, 1.5810, 1.5890, 2.1780, 2.3430, 2.4160, 2.4440, 2.8250, 2.8300, 3.5780, 3.6580, 3.7430, 3.9780, 4.0030, 4.0330.
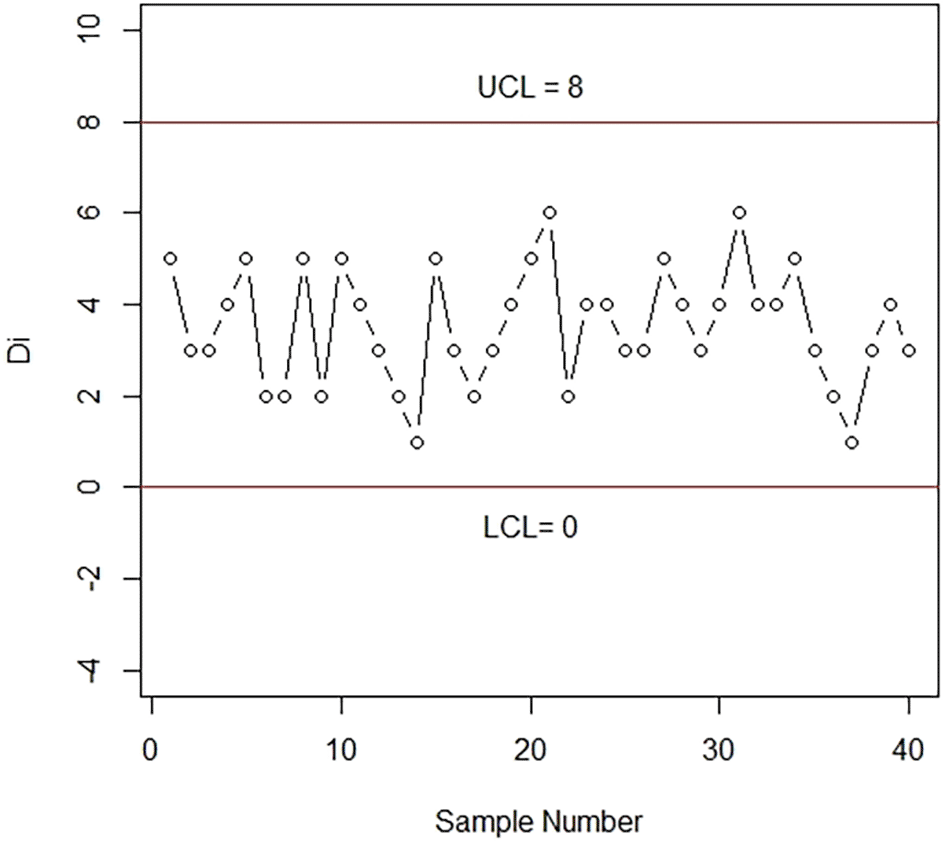
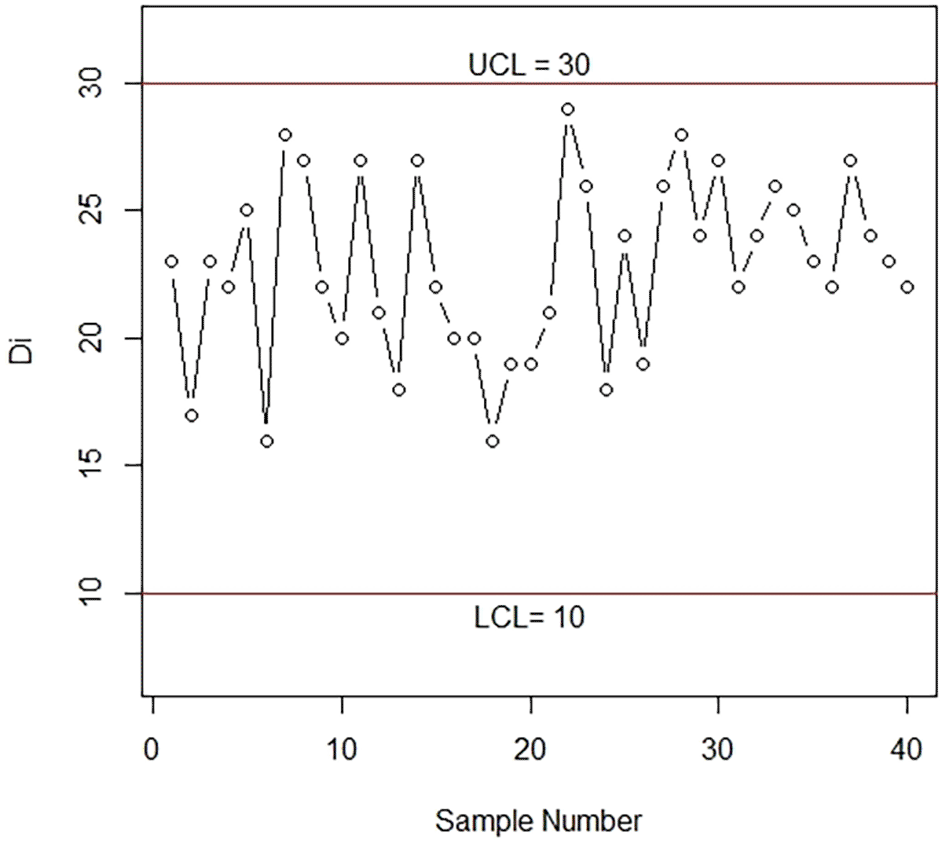
We used the maximum likelihood estimator (MLE) to estimate the PFD and WPFD parameters. The statistics used to show the application of the control charts are shown in Figures 5 and 6. Zaka et al.9 showed that the above data follow the WPFD with the shape parameter. We also assumed that . We obtained the control coefficient of the proposed chart as , n=15, and p01 = 0.465220. From Figure 5, we observe that the control chart based on the PFD shows an in-control situation. All the points lie between the control limits.
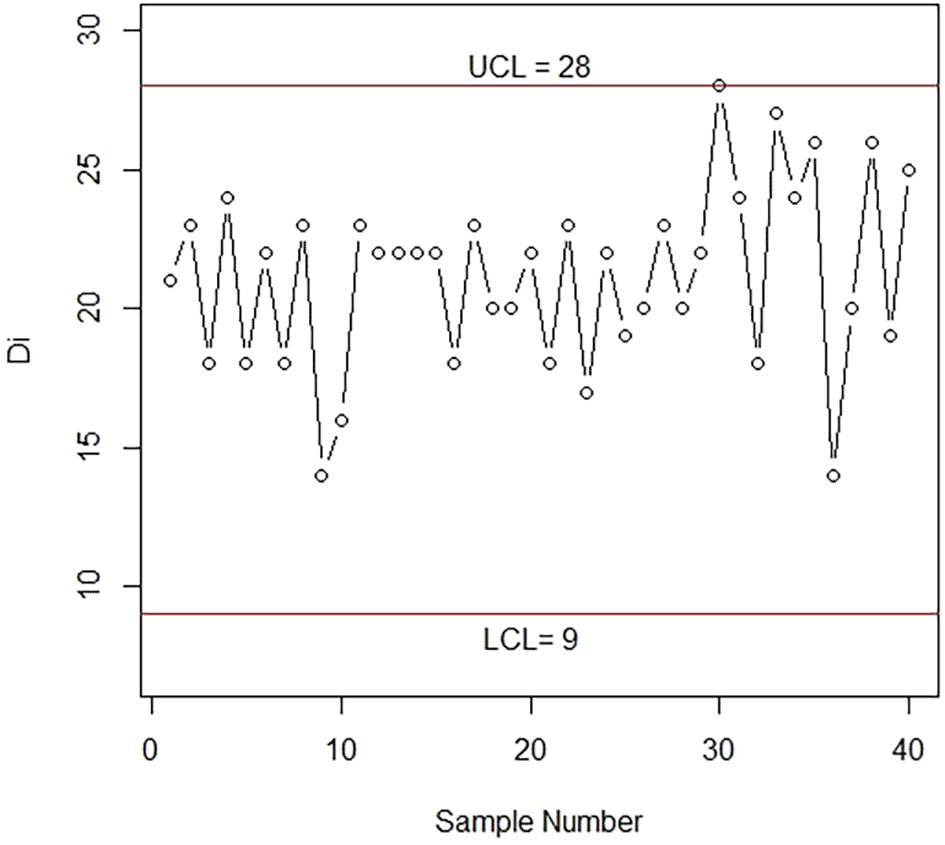
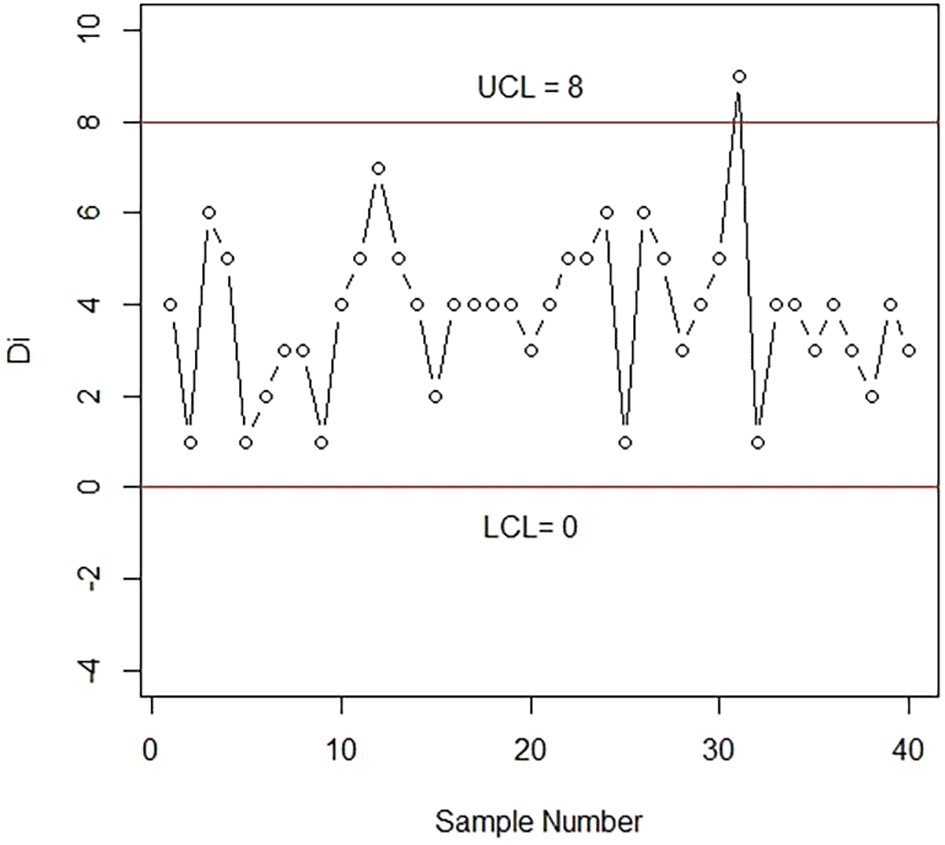
From Figure 6, the WPFD control chart is presented with shape parameter . The plotting statistics are shown in Figure 6, which are used to apply the proposed control chart. The data are known to follow the WPFD with shape parameter and control coefficients , n=15, and p02 = 0.423427. From Figure 6, we see that all points are in the control area, but the 30th observation shows an out-of-control situation.
We see that it is better to use the WPFD-based control chart to control the process than the PFD control chart.
In this paper, we proposed attribute control charts assuming that the lifespan of the products under study follows the PFD and WPFD simultaneously when the shape parameter is unknown. We used the average run length (ARL) as the performance criterion to assess the competence of the proposed idea. The results of the ARLs are presented in the form of tables using different parameter values and sample sizes. The paper is concluded as follows.
• We observed that the WPFD is a more applicable control chart because of its narrower control limits than the PFD control chart.
• We also observed that the detection ability of the proposed control charts increased with increasing sample size.
• A real-life application and simulation study were conducted to demonstrate the applicability of the proposed control charts, which showed the outstanding execution of the suggested idea.
• The proposed control charts can be extended using other sampling schemes, such as repetitive sampling and multiple dependent state sampling, in future work.
• The proposed chart under WPFD efficiently detected the shift in the process.
• We suggest further applications of the proposed work in Engineering and Medical Sciences. In addition, more probability distributions could be used to construct the ACC under TTLT.
| Views | Downloads | |
|---|---|---|
| F1000Research | - | - |
|
PubMed Central
Data from PMC are received and updated monthly.
|
- | - |
Provide sufficient details of any financial or non-financial competing interests to enable users to assess whether your comments might lead a reasonable person to question your impartiality. Consider the following examples, but note that this is not an exhaustive list:
Sign up for content alerts and receive a weekly or monthly email with all newly published articles
Already registered? Sign in
The email address should be the one you originally registered with F1000.
You registered with F1000 via Google, so we cannot reset your password.
To sign in, please click here.
If you still need help with your Google account password, please click here.
You registered with F1000 via Facebook, so we cannot reset your password.
To sign in, please click here.
If you still need help with your Facebook account password, please click here.
If your email address is registered with us, we will email you instructions to reset your password.
If you think you should have received this email but it has not arrived, please check your spam filters and/or contact for further assistance.
Comments on this article Comments (0)