Keywords
CBG, Exergy, HCRT, HRV, VLFHF
This article is included in the Global Public Health gateway.
CBG, Exergy, HCRT, HRV, VLFHF
The current work is an extension of the conference paper in ECBIOS-2021, which was awarded as the best paper[1],1 and focused on the increase in heat (thermogenesis) through an increase in resting metabolic rate by hand clasping with a specific finger pose (HCFP).2 Thermogenesis through inhalation of hot humid air3 and whole-body heating4 improves the innate immune system response, which is a key parameter that resists the spread of the pathogen.2 Drugs such as caffeine, mirabegron, glucagon, spironolactone, ephedrine, and foods such as garlic and cinnamon are well-known sources of thermogenesis.5 A firm hand-clasping with the raised thumb (HCRT) as a thermogenic source is explored in the current study along with the clinical use of type II diabetes mellitus (T2DM). The HCRT technique considered in our study involves interlocking the fingers of the left and right hands with the right thumb kept upright.
Thermal element is always associated with a particular physiological state, such as fever, food, sleep, and muscle metabolism. The thermal elements of fever activate the innate and adaptive immune responses.6 The effect of mild hyperthermia treatment on healthy adults enhances innate and adaptive immunity.7 Therefore, to bolster the immune system, mimicking the condition of hyperthermia is achieved externally through heat ingestion from various sources, such as water circulation at 34 °C through the perfused suit8 and exposure to a cold environment (ice water bath, cryotherapy),5 which reduces arterial stiffness by increasing the metabolic rate innervated by sympathetic activation. Heat induction in the body involves several mechanisms.9 The metabolic rate depends on brown adipose tissue (BAT) activity, which generates heat in the body.10 Infrared thermal (IR) imaging of the skin has been used for several decades to assess spatial skin temperature distributions.11 The spatiotemporal distributions of temperature are heat generation (thermogenesis) measures as per Penne's bio-heat equation, including heat associated with both metabolic and tissue blood perfusion.12 The study of HCRT on spatial change in temperature gradient () and slope of temperature change over time is crucial for investigating thermogenesis in general and specifically for the geriatric population.
HRV is widely used for the clinical assessment of the autonomic nervous system (ANS).13 It has been widely used to study the effects of thermogenesis on heat stress.14 HRV has various time, frequency, and nonlinear parameters for physiological assessment,15 which are altered during thermogenesis. In the frequency domain, the very low-frequency (VLF) band of HRV (0.0039–0.04 Hz) responds to thermoregulation.16 The VLF increases significantly in response to core cooling, peripheral vasoconstriction, and shivering, while both very low and low (0.04 - 0.15 Hz) frequency powers increase in response to skin-surface cooling.17 However, when exposed to hot environmental conditions at 30 °C, the low to high frequency (LFHF) ratio increases.18 HRV decreases owing to an increase in the LFHF ratio when the skin is exposed to both cold and hot environments beyond the thermal comfort range (22 – 27 °C).19 The VLF power increased during core cooling. Thermogenesis by exercise and external hot environments shows a reduction in parasympathetic nervous system (PNS) tone with elevated sympathetic nervous system (SNS) tone.20 In contrast, the very high-frequency (VHF) band of HRV (0.4-0.9 Hz) responds to cardiovascular autoregulation.21 Autoregulation is improved by thermogenesis for a 0.4 °C increase in internal temperature.14 This study explored the unique mechanism of thermogenesis by HCRT and its effect on HRV. The heat depends on the rate of change of temperature, and . The former was captured from the core (axillary22) temperature slope measured by the LM-35 sensor.23 The is measured from thermal images captured by IR-camera.
Thermogenesis through exposure to high heat stress conditions improves HRV in T2DM subjects24 and glucose metabolism.25 Exergy analysis assesses the efficiency of thermogenesis based on physical activity,26,27 altitude change,28 thermal sensation,29 and respiration.30 According to the literature, performing moderate or intense exercise can lead to a decrease in exergy and increase in metabolic heat. In the current study, HCRT intervention was used to evaluate the exergy from the breath to measure the quality of thermogenesis.
Measurement: Exergy depends on the pressure, temperature, and velocity of the exhaust breath. The MEMS pressure sensor, composed of BMP-280, measures both the pressure31 and temperature32 of the breath. An anemometer was used to measure breath velocity. The standard measurement of dissolved glucose in the blood is the laboratory-estimated venous plasma glucose (VPG) test (glucose oxidase-peroxidase method). However, point-of-care measured capillary blood glucose (CBG) values with a glucometer (Accu-Chek) at a 2-h plasma glucose level can be used for gestational diabetes mellitus (GDM) assessment.33
The sympathetic division of the autonomic nervous system (ANS) contributes to the effect of the metabolic heat rate through active and passive heat acclimation. The metabolic rate through non-shivering thermogenesis includes many techniques, of which sitting while clasping hands is very natural. Its effects on thermogenesis and ANS are unknown.
We hypothesized that HCRT causes thermogenesis with a higher HRV. Although higher HRV could be attributed to resting alone, HRV further increased due to HCRT. To test this hypothesis, we measured the spatial gradient and temperature slope with respect to time using thermal images and axillary and breath temperatures before, after, and during HCRT intervention. We also examined the effect of HCRT on the CBG values of subjects with T2DM to validate our hypothesis. Our study shows that, in addition to temperature, the spatiotemporal distribution of temperature is an important parameter that affects HRV.
This study was divided into two parts. 1st part aims to observe the changes in temperature over time and space with 15 healthy participants (height, 160 ± 10 cm; weight, 65 ± 10 kg), and 2nd part focuses on the clinical validation with 12 type-II DM subjects (eight male, four female) for only the CBG test before and after the HCRT intervention. The inclusion criteria for healthy participants with no medications required them to be between the ages of 24 and 60. Female participants were excluded from the first part of the study, as we collected thermal images of their bare bodies to keep them dry and avoid any impact of clothing on heat transfer.
The protocol of this study involving humans was approved by the Institutional Ethical Committee (IEC) of IIT Madras (IEC/2023-03/MM/02/03) on 1st December 2023 for a period from 11/12/2023 – to 10/12/2024. The study conforms to the standards set by the latest revision of the Declaration and was conducted to comply with local legislation and institutional requirements. We collected written consent forms from each participant according to ethical guidelines. The data collection from the participants is from 18th January 2024 to 25th January 2024.
The duration of the experiment was 50 min per subject. The duration consists of three phases: pre-hand-clasping normal (N1, 10 min), hand-clasping (HCRT, 20 min), and post-hand-clasping normal (N2, 20 min). The experiment followed a 10 min time window for the analysis: N1 (0–10 min), HCRT1 (10–20 min), HCRT2 (20–30 min), and N2 (35–45 min). The subjects were asked to breathe normally during the experiment. The study included various sensors to assess the effects of the HCRT intervention. The duration and mode (continuous and discrete) of recording by each sensor during the experiment are listed in Table 1. We collected ECG, transient body temperature, and thermal images of the participants. The ECG was collected by an ECG-Amplifier coupled with an Arduino UNO with a sampling frequency of 182 Hz.34 The transient body temperature was measured by the LM-35 sensor with a range of −50 °C to 150 °C and an accuracy of ±0.2 °C at 25 °C. The ambient temperature was maintained at 30 °C. LM-35 records the temperature under the armpit at 1.2 Hz. The sensor records the axillary temperature for 1.5 min as the reading saturates at 35.5 °C to 36.04 °C35 after reaching the steady state; it provides the rising transient response of temperature. LM-35 was then kept at ambient temperature for 1.5 minutes to allow it to reach the initial temperature. A KT-150 IR camera captures thermal images of dimension 120 pixels × 120 pixels, with a spectral range of 8–14 μm and a resolution of 0.1 °C. The emissivity (ε) in KT-150 was set to 0.98 for all images resembling the emissivity of the skin. The exergy of the exhaust breath was calculated from its pressure, temperature, and velocity using BMP-280, and the anemometer was recorded for 60 s at the end of the experimental phases, recorded at 1000 Hz, such as N1, HCRT1, HCRT2, and N2. The capillary blood glucose level is measured by a glucometer before and after the HCRT. A schematic of the experimental setup is shown in Figure 1. Thermal images were captured once at every 1.5 min intervals.
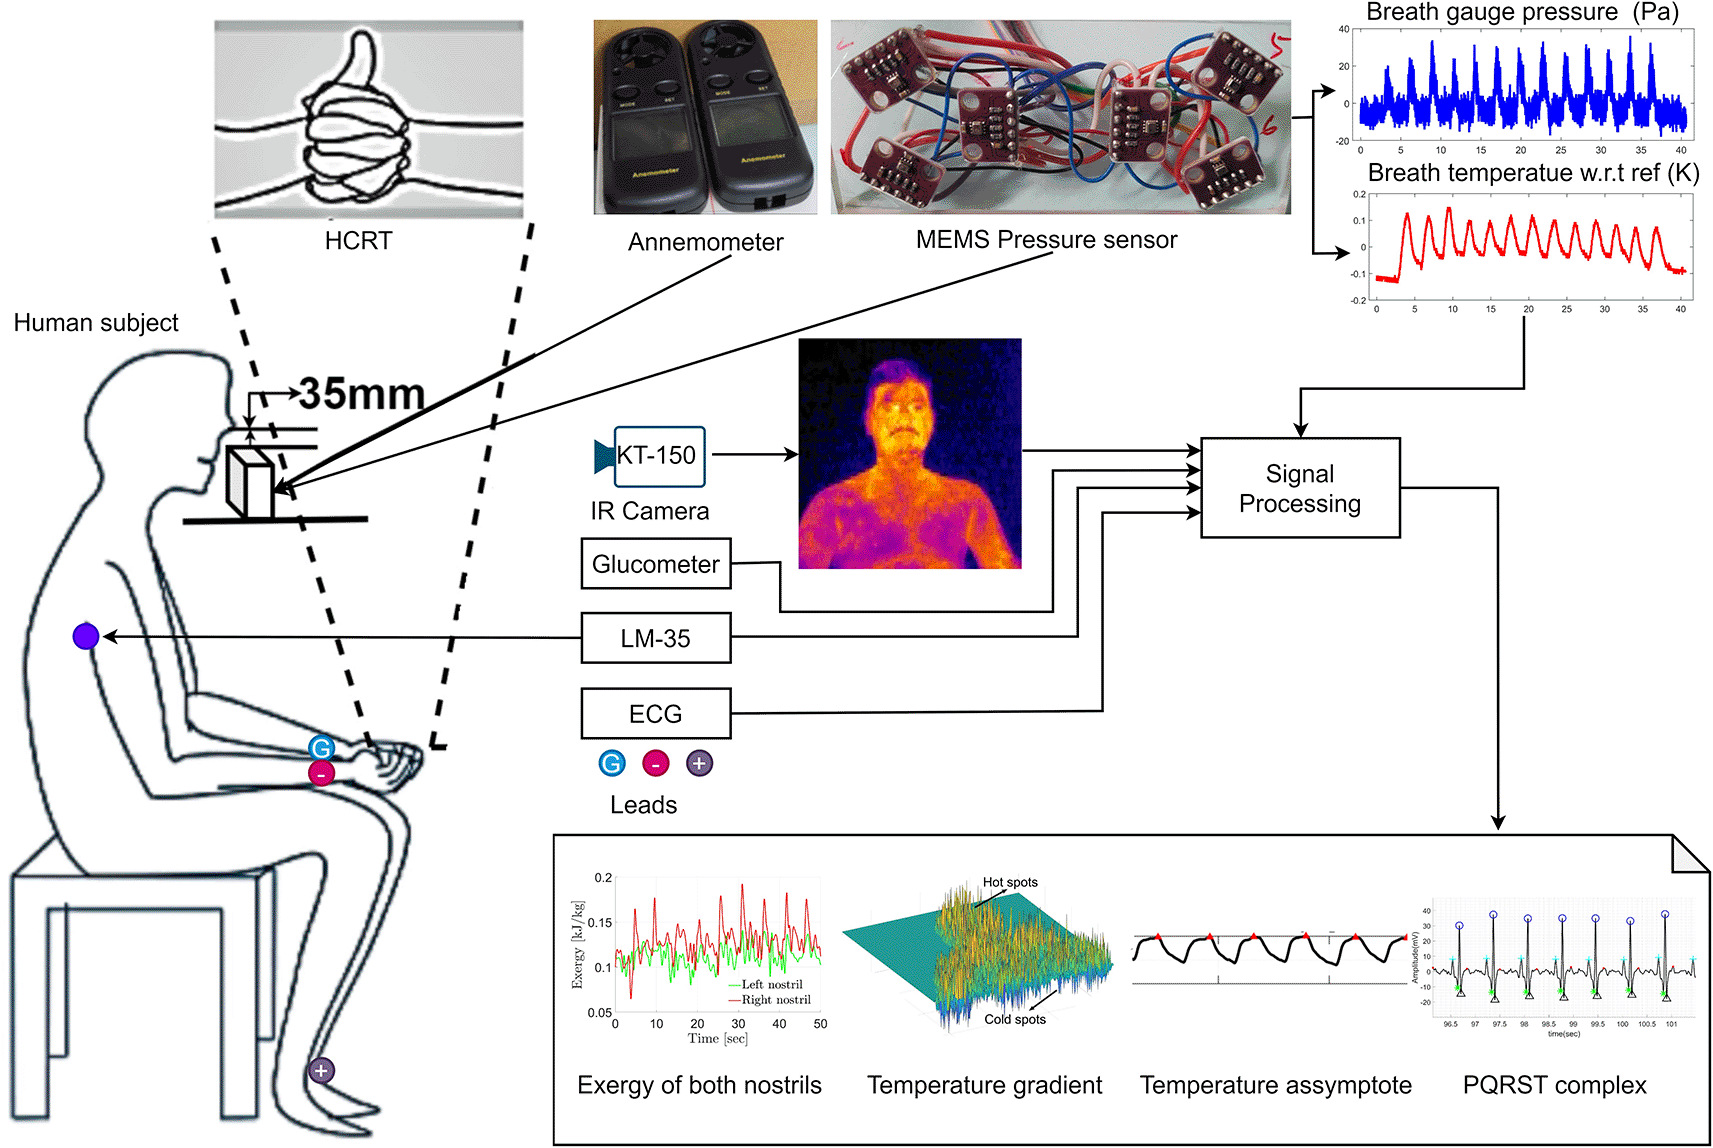
The experiment uses six sensors: 1) MEMS barometer (breath temperature and pressure), 2) anemometer (velocity of the breath), 3) KT-150 (thermal imaging), 4) LM-35 (axillary temperature), 5) ECG amplifier (ECG), and 6) glucometer (CBG). The processed out- puts are shown in terms of temperature slope and spatial change in temperature gradient, exergy, and filtered ECG signal with PQRST complex for HRV.
The axillary temperature signal and IR images were processed as per the flow chart in Figure 2, described in subsections, to evaluate the spatiotemporal variation of temperature and its impact on HRV.
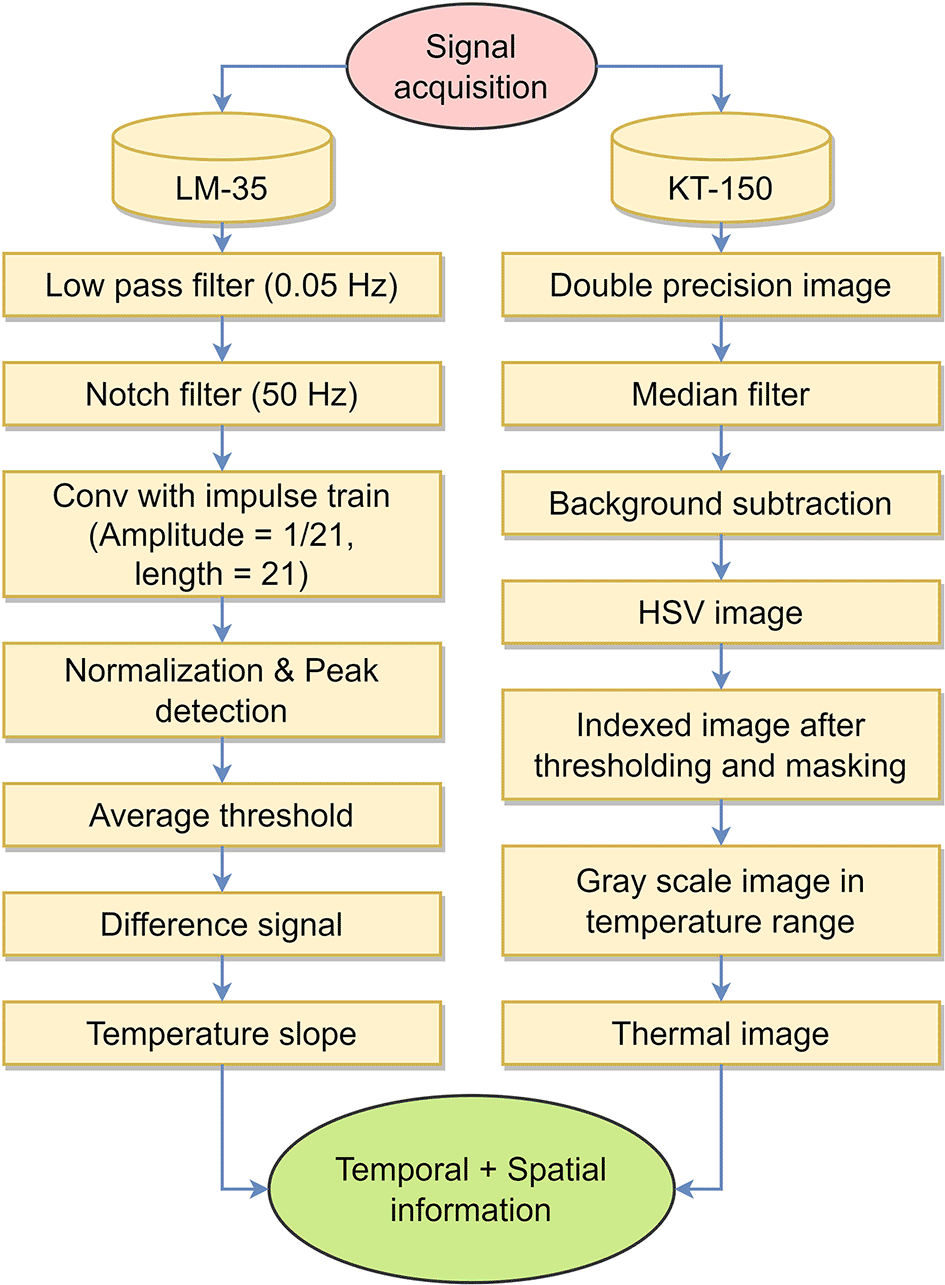
The normalized axillary temperature, as in equation (1), was 50 Hz from the powerline and high-frequency noise, which were filtered by a notch and low-pass filtered at the cutoff frequency (fc = 0.05 Hz). The filtered signal is convoluted with the impulse train results to obtain the fitting line on the temperature variations with an average mean square error of 0.004, as shown in Figure 3a. The differential signal from the average thresholding operation provides a rising slope in the temperature signal, as shown in Figure 3b.
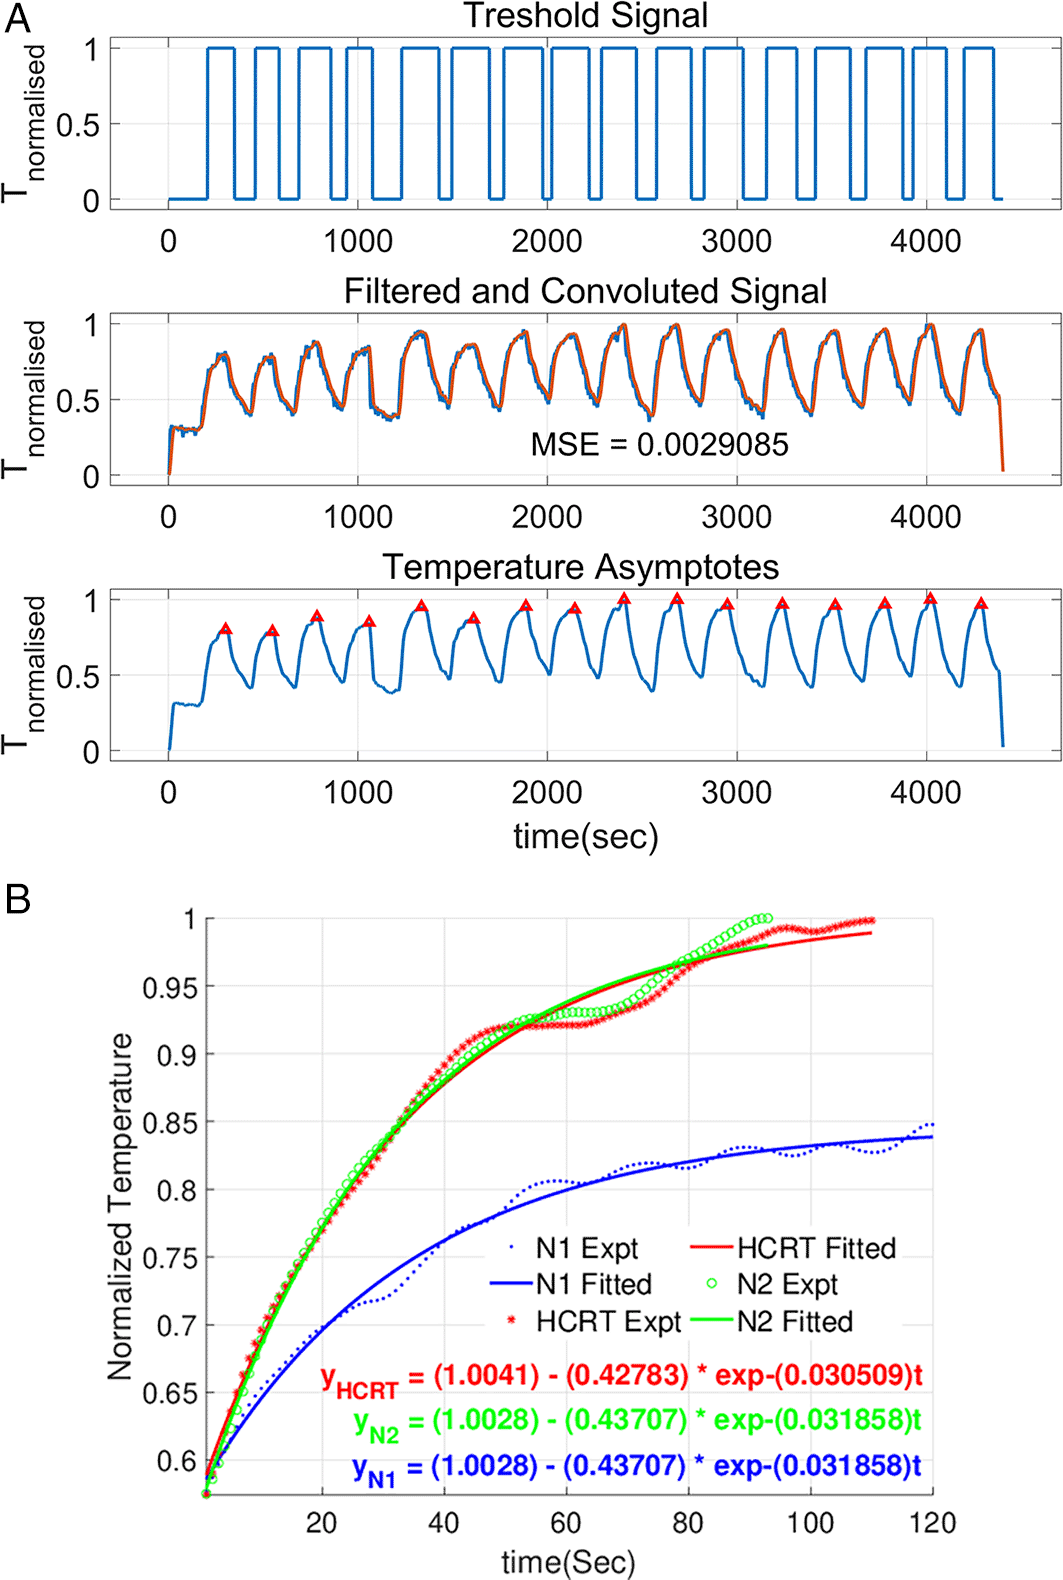
The maximum slope of the temperature increase was of higher significance. It was obtained from the exponential fitting operation to the positively sloped region of the body temperature, as shown in Figure 4c. Image noise in the form of shadows is removed by applying median filtering36 to the double-precision image of the raw IR thermal image. The emissivity was set to that of the skin (ε = 0.98).37 Regions of interest were obtained through image processing techniques of background subtraction that differentiate between the subject and the background,38 having only thoracic and facial areas, making the region of interest (ROI) pixel dimensions 120 × 120. The dominant colors in the image are orange and red; therefore, the thermal image is converted to a hue- saturation-value (HSV) image to obtain the intensity of the pure colors in the IR image. This helps to clearly distinguish between the hot and cold pixels. The average thresholding with a threshold of 0.3 on the HSV image provides grayscale images. The hue and saturation are masked to zero, while the value of the HSV images is masked to one to obtain the indexed image. The indexed image was then scaled between 30 °C to 35 °C to obtain the temperature image. This range is based on the skin and the core temperature difference, which lies between 2 °C and 4 °C,39 with an ideal core temperature of 37 °C. The temperature field obtained during postprocessing is shown in Figure 4d.
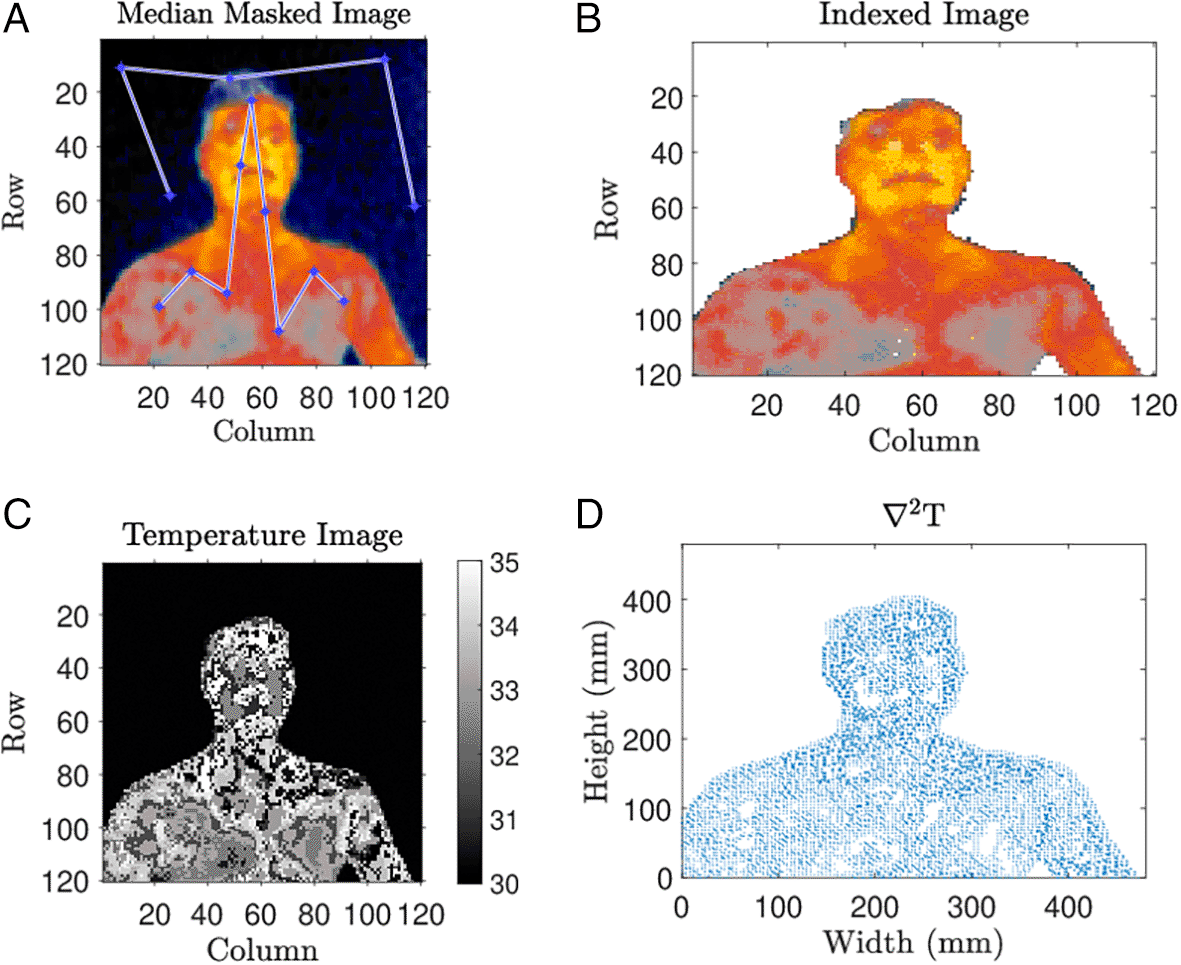
a) A set of co-ordinates of the pixels in foreground and background of the median masked image, b) Back- ground subtracted Indexed image, c) Grayscale temperature image d) Vector field of .
We quantified the effect of thermogenesis through indirect calorimetry from the temporal and spatial temperature changes using Penne's bioheat equation,40 given below in equation (2):
, is the tissue blood perfusion heat per m3, and are the density, specific heat, and thermal conductivity of the skin, respectively. T is the skin temperature and is the core (axillary) temperature. is the specific heat of the blood.
Therefore, predominantly depends on the spatiotemporal changes in temperature. In this study, the maximum slope of axillary temperature, and are analyzed to observe the thermogenesis during HCRT.
We used the finite difference method to find the spatial change of the temperature gradient, as given below in equation (3):
The thermal conductivity of the dermis of the skin, which is just below the epidermis and has a thermal conductivity (k) of 0.47 W m−1 K−1, density () of 1085 kg m−3 and specific heat (CP) of 3680 J kg−1 K−1.41 We used the max − min value of to differentiate between the hot and cold spatial regions of the skin. Each pixel in these regions is called a hotspot (HS) or cold spot (CS). The distribution of these spots follows a kernel probability distribution function (PDF). The distance between the peaks of the distribution is referred to as spot-width (SW). We estimate the variability measures in thermogenesis by the maximum range, the standard deviation of change in the temperature gradient, the Frobenius norm, and the maximum eigenvalue of which are given below in equation (4):
HRV requires RR intervals from the filtered ECG. Raw ECG have power line interference and baseline movements due to respiration and hand motion. The power line interference in the ECG was removed using a 50 Hz notch filter. A symbol of order four is used as the mother wavelet to remove baseline wandering in ECG, and the approximate ECG is reconstructed by summing the wavelet coefficients from 3rd -5th level of the decomposed ECG42 to obtain an enhanced QRS-region. The peak detection algorithm was used to obtain an undistorted RR interval for evaluating HRV. HRV is a measure of oscillation in heart rate over a minimum period of five minutes.16 It has various time, frequency, geometric, and nonlinear features16 to describe its physiological significance. In this study, HRV analysis constituted the frequency domain metrics alone. This focuses on one metric for a specific understanding of the power under frequency bands and their physiological significance solely due to HCRT. The primary analysis was to observe the VLF power and sympathovagal response due to HCRT. In the subsequent analysis, sub-band-spectrum analysis was carried out to find the frequency zone in the VLF responsible for HCRT, as the VLF power components respond to thermoregulation.17 The sub-band of VLF-power is obtained by dividing the VLF range (0.0033 Hz to 0.04 Hz) equally into five different bands: 0.0033–0.0106, 0.0106–0.018, 0.018–0.0253, 0.0253–0.0327, and 0.0327–0.04 Hz.
The sensor setup had six BMP-280 MEMS sensors as shown in Figure 5 with a sampling frequency of 156 Hz, as shown in Figure 5. The BMP sensor module (pressure resolution: 1 Pa and temperature resolution: 0.01 °C from BOSCH) was used with an ST microcontroller (STM32F401CCU6 black-pill board) to record breath pressure and temperature at 1000 Hz. It runs in Real-Time-Operating-System (RTOS) mode and SPI proto- col to communicate with six pressure sensors. However, the inward sensors (3,4 in Figure 5) near the nostril, there- fore are used for measurement. Additionally, an off-the- shelf anemometer (range: 0.1 m s−1 to 30 m s−1, resolution: 0.1 m s−1, and accuracy: ±5 %) was used to obtain the velocity of the breath. The planar axis configuration for measuring breath parameters is inspired by.43 Exergy analysis was carried out considering the following assumptions:
• The standard fluid in and out of the nostril is air
• The inlet and exit air through the nostril is ideal gas
• The temperature and pressure of the inlet and exit fluids are the temperature and pressure of the surrounding and exhaust air from the nostril, respectively.
• The properties of air remains constant (specific heat at constant pressure):
• The turbulence effects are neglected
• The velocity of the inlet state is the same as that of the surroundings (V0 = 0), and the maximum velocity from the anemometer in the exit state is considered for the availability analysis rather than a set of continuous measurements.
• exergy due to change in humidity has been neglected, considering the inlet and end-expiratory air conditions to be 100 % saturated.
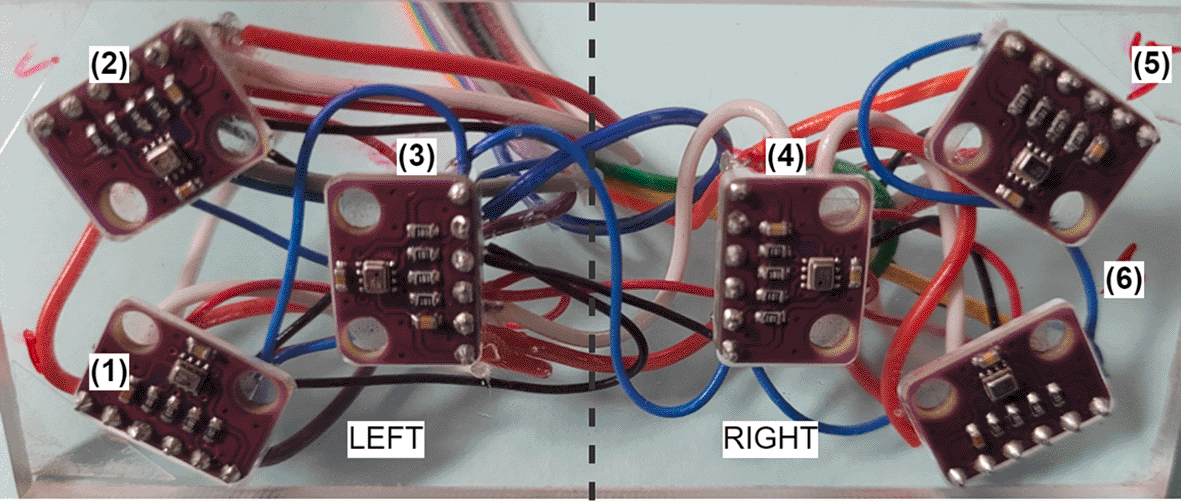
Six off-the-shelf MEMS pressure sensors assembled in isometrically for left and right nostrils.
Exergy constitutes enthalpy, kinetic energy, and entropy generation per \SI{}{kg} for an open system, as given in Equation (5).
Heat therapy is a medical technique that uses heat for therapeutic intervention. In this study, we explored the potential impact of a hand gesture called Linga Mudra (HCRT), which involves interlocking the fingers of both hands together (knuckle pointing out) with the thumb upright. This gesture is known to generate heat and improve the breathing capacity. Here, we aimed to emphasize the benefits of heat therapy (HT) in improving diabetic conditions through metabolism and glycolysis. Our study quantified thermogenesis using Penne’s heat equation (2) and analyzed its relevance to the frequency domain metric of the HRV parameters, exergy. We also included instantaneous fasting glucose levels obtained from the CBG test in our clinical results.
Thermogenesis has two components: temporal and spatial variations in temperature. We have taken a 10 % change in the median value of the parameters as a significant difference,44 as thermoregulation is a slow process. The is shown in Figure 6a, which has two regions such as hot and cold depending on the maximum value of the minimum value of tensor max (min()). The hot and cold regions are defined with greater, and lesser than max (min()) respectively. The histogram of at both zones provides the kernel distribution pattern as shown in Figure 6c. The spot width (SW) in Figure 6d is the distance between the peak values in the distribution, which depicts the effect of thermogenesis. An increase in thermogenesis causes a reduction in SW and vice versa.
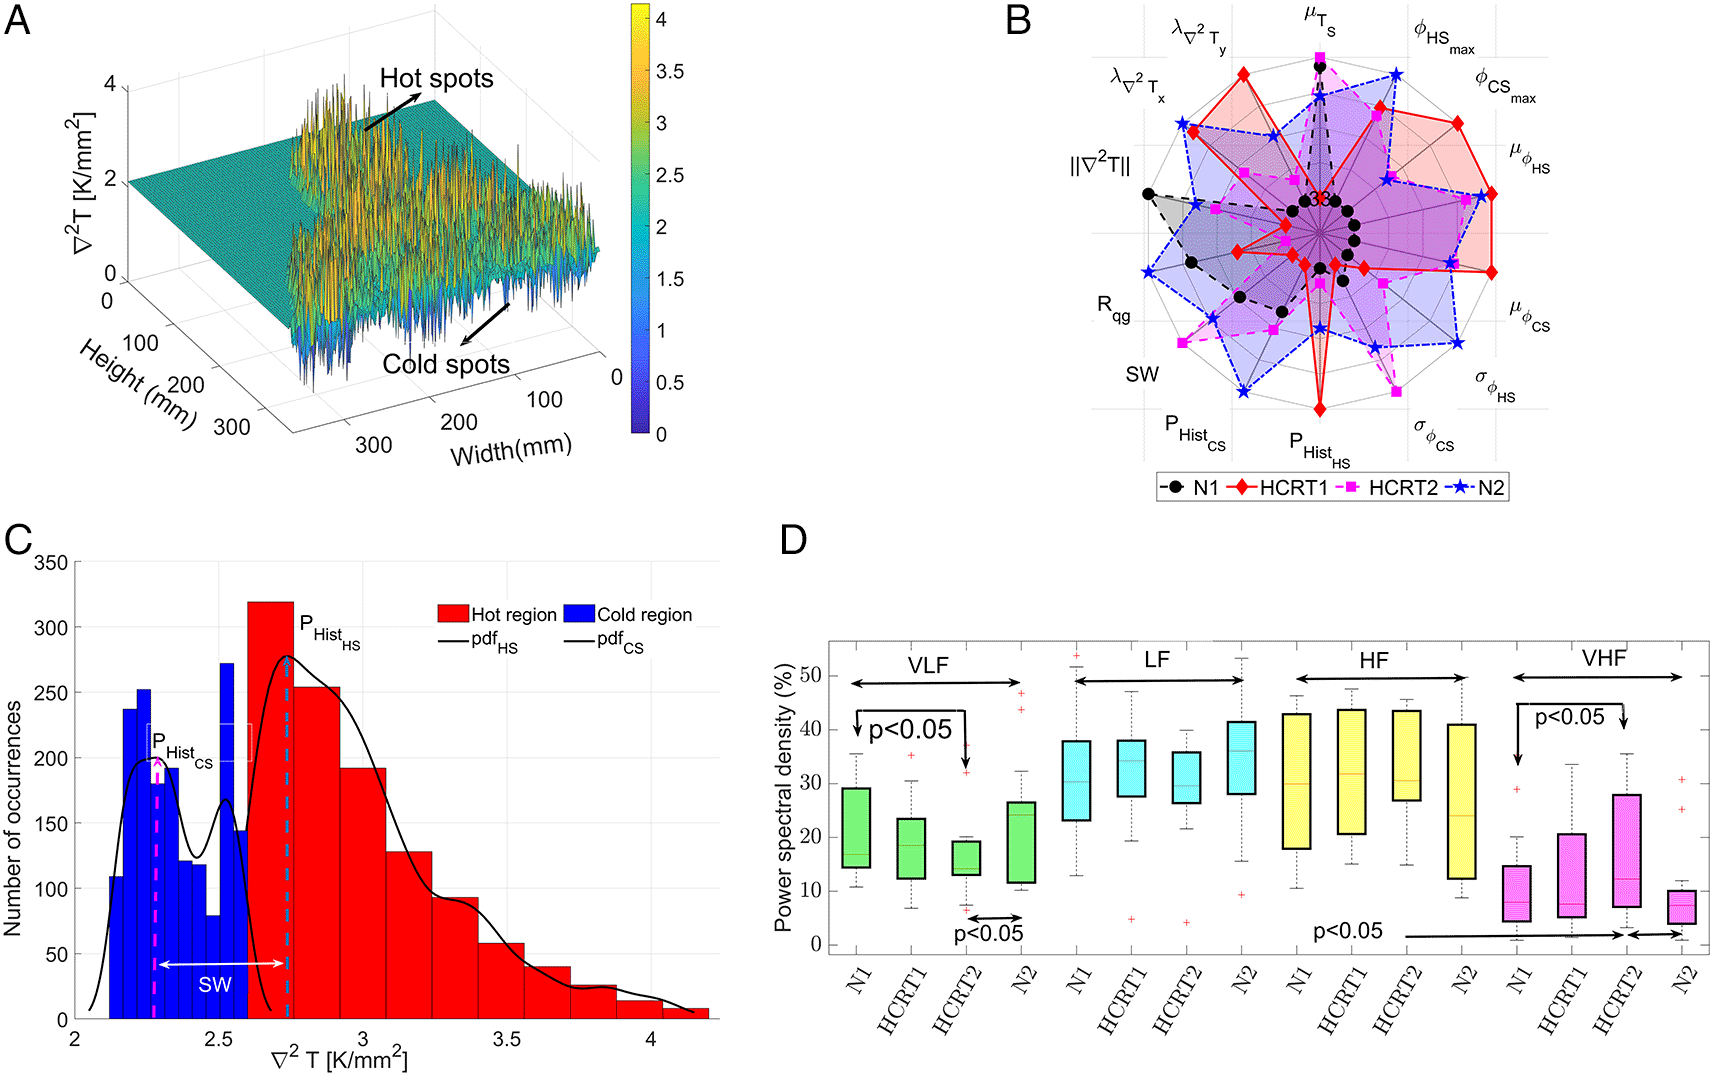
The parameters of − matrix are tabulated in Table 2, and are plotted in the spider plot as shown in Figure 6b. The magnitudes of the maximum, mean, standard deviation, and peak of the PDF are increased during HCRT1 and sustained during HCRT2. Homogenization due to heat addition can be observed from the reduction of magnitudes in SW, range, and the Frobenius norm of (). The post-normal phase N2 has a higher spread in the spider plot showing an overall increase in parameters than pre-normal phase N1. The plots show a clear activation of thermo-regulation by heat addition during HCRT, reflected on the ∇T than only the temperature. There is an increase in thermogenesis, evident from an increase in the temporal slope of temperature and . The average value of at hot and cold regions rises by 3.42 %, 2.78 %, and 2.53 %, 1.84 % during HCRT1 and HCRT2 respectively compared to N1. The maximum value of has relatively increased during the HCRT phase than N1. The standard deviations of the at hot and cold spots increased by 1.47 % and 1.84 %, respectively, during HCRT2 than HCRT1 owing to the entropy generation by heat addition to the system. It eventually propagated to the post-normal phase N2, with an increase of 4.55 % at the hot spots. The peak value of kernel distribution at spots increased by 9.26 % during HCRT1, signifying the heat addition to the system during 1st phase of HCRT. This is evident as the axillary temperature slope increased by 11.54 % during HCRT1, as shown in Table 2. The field parameters during HCRT2 sustained the thermogenic effect of HCRT1. The skin temperature almost remains constant in the range of 32.72 °C to 32.76 °C, as shown in the Table 2. The median temperature of breath in both left and right nostrils is equalized by HCRT as the difference between breath temperature of left and right reduced by 88.6 % during HCRT1 and 23.03 % during HCRT2. The breath temperature rose significantly for both left (p < 0.001) and right (p = 0.0064) nostrils during HCRT1, dropped further during HCRT2 due to thermoregulatory effects, and increased further for both left (p < 0.001) and right (p = 0.0060) nostrils during N2 compared to HCRT2.
HRV improved during HCRT with a non-significant increase in HF power and a significant reduction (p < 0.05) in VLF power during HCRT2. This is evident from the VLFHF ratio for HCRT2 being significantly lower (p < 0.05) than N2 by 52.62 %, as shown in Figure 7a, with minimal changes in LF power, as shown in Figure 6d. The percentage of power in the sub-VLF-HRV band of 0.0327 Hz to 0.04 Hz during HCRT2 is significantly (p < 0.05) higher by 41.7 %. Therefore, shows the precise sub-band of VLF contributing to thermoregulation by HCRT, as shown in Figure 7b, which is a unique feature of this study. The other sub-bands did not show any significant differences during the HCRT. Moreover, there was a significant increase (p < 0.05) in the VHF power of HRV by 54.2 % and 66.54 % during HCRT2 in comparison to N1 and N2, respectively.
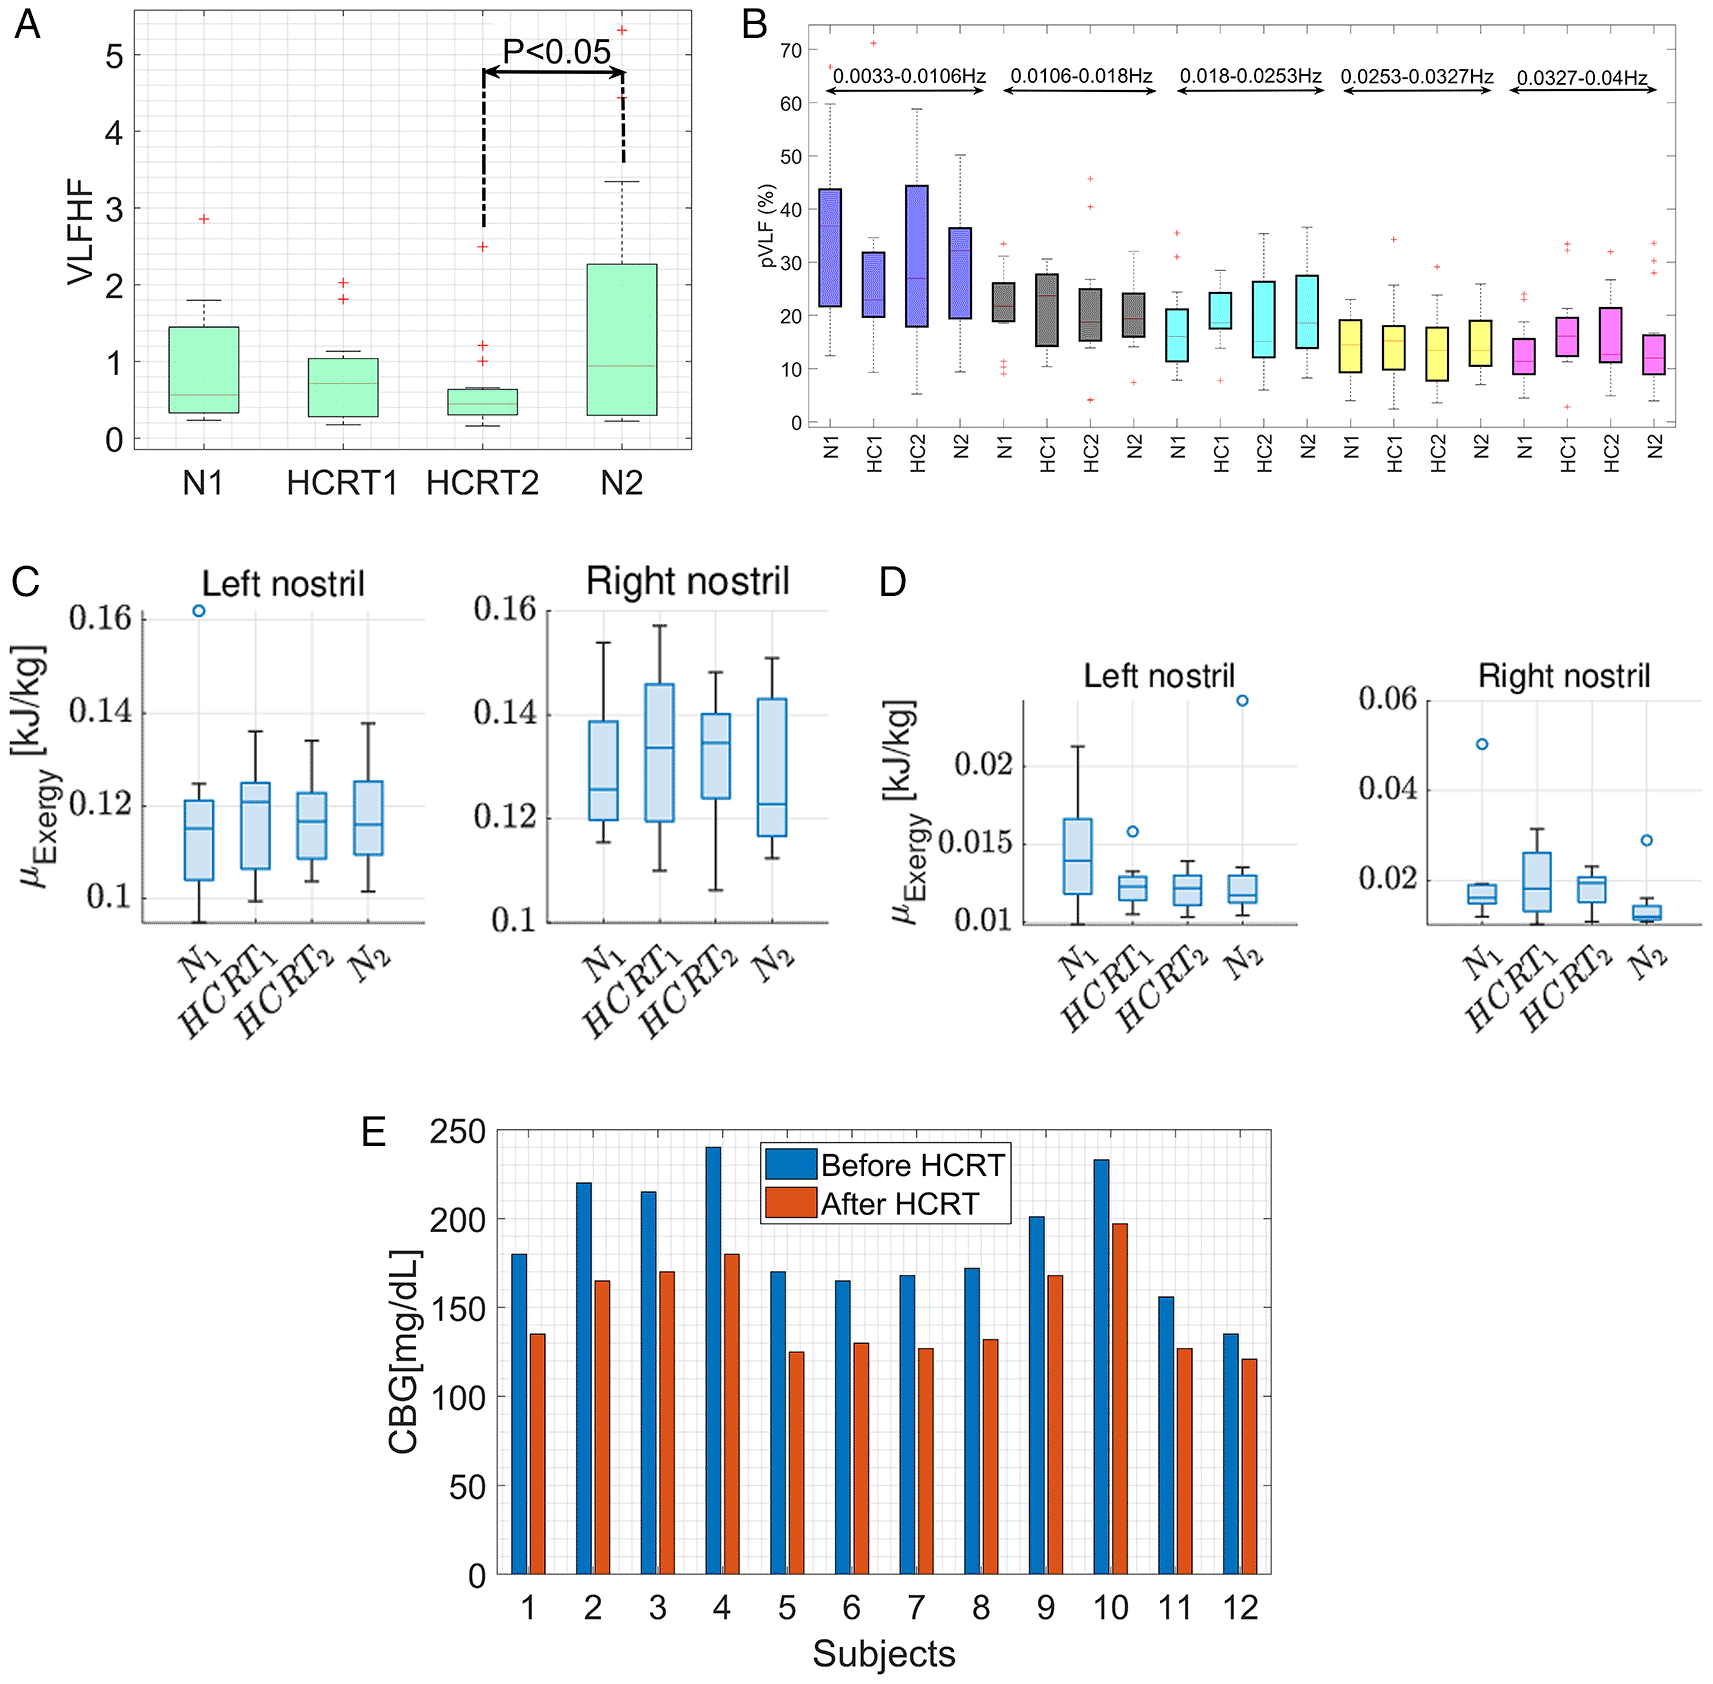
The boxplot in Figure 7c indicates a non-significant increase in the average exergy in both nostrils during the HCRT. However, there was a significant difference in the standard deviation of the exergy between HCRT2 and N2 (p < 0.05), as presented in Figure 7d. During HCRT1, σexergy is high for the right nostril owing to the larger box width, and subsequently decreases in HCRT2 and N2. The σexergy in the left nostril was reduced non-significantly by HCRT. Thermogenesis by HCRT is mediated by the right nostril exergy transfer, which may be attributed to the upright position of the right-hand thumb.
The CBG was measured from the prick test by the glucometer before and after the HCRT intervention of twenty minutes. The bar plot in Figure 7e shows the effect of HCRT on CBG for with twelve II DM. There was a significant reduction (p < 0.001) in CBG value by 24.14 %, as shown in Table 2. The results showed a definitive thermogenesis process during HCRT, which facilitates glycolysis. Hand clasping creates resistance to blood flow to the fingers because of the partial compression of artery branches on the lateral side of the fingers. It accelerates the heat exchange from the muscle to the blood, which may be responsible for glycolysis. The glucose utilization rate of the body is regulated by the secretion rate of insulin from the pancreas. Usually, the amount of glucose that can diffuse into cells is restricted, except for the liver and brain cells. Insulin significantly increases this diffusion. The effect of HCRT on insulin production requires further study.
Heat generated by thermogenesis (extrinsic or intrinsic) is frequently used as a therapeutic intervention in medicine. Our study examines the intrinsic mechanism of thermogenesis using hand gestures, specifically the Linga Mudra. Mudra involves interlocking the fingers of both hands with the knuckles pointing out and thumbs upright. This technique results in auto-thermogenesis and is referred to as HCRT in our study. This hand gesture is known to have the potential impact of generating heat and enhancing breathing capacity, which was explored in our study to emphasize heat therapy (HT) in improving diabetic conditions by metabolism, and thereby glycolysis. Thermogenesis through hot baths or saunas causes a reduction in oxidative stress, inflammation, apoptosis, arterial stiffness, and blood pressure, thereby improving cardiovascular health.45 Heat therapy (HT) is also important in alleviating the symptoms of peripheral artery disease (PAD) by reducing diet-induced fat accumulation in the skeletal muscle, thereby improving contractility. This practical treatment is useful for patients with Type-2 DM and obese PAD who are unable to undergo conventional exercise regimens,46 as the CBG value reduces significantly. HCRT causes arm muscle contraction due to the constant force applied during clasping. The literature shows that during ex vivo isotonic and isometric contraction of the trabecula muscle in “Auckland Microcalorimeter” results in of heat rate.47 A Similar thermogenesis mechanism may be attributed to isometric muscle contraction during HCRT. Additionally, hand clasping reduces heat dissipation from the fingers owing to its minimal surface area, similar to the fin heat transfer mechanism. Hand clasping also compresses the digital arteries, converting the kinetic energy of flow into the potential energy of pressure,48 which aids in effective heat transfer from muscles to blood. The pattern of increased thermogenesis in HCRT1 and decreased thermogenesis during HCRT2 indicates the activation of thermoregulation during HCRT2.
It has been observed that the thermogenesis triggered by HCRT does not affect the body temperature significantly. This suggests that the body is more responsive to temperature dynamics than temperature alone. During HCRT1, the auxiliary temperature slope increased, whereas it decreased during HCRT2. This observation is consistent with the literature, where a rise in body temperature from 1 °C to 2 °C was observed during passive heat strokes,49 followed by a dip during active heat strokes due to evaporation loss. A similar pattern was also observed for breath temperature change. This periodicity is due to the thermoregulation effect, as the thermogenesis in HCRT1 and HCRT2 counter each other.
The role of upright position of thumb: The maximum eigenvalue of in y-axis is higher than that of x-axis for HCRT1. The significance of this observation is that the heat field is directed upward during the HCRT1. This may be attributed to the upright position of the thumb during the hand clasping. However, during HCRT2 and N2, the eigenvalue of the along the x-axis is greater than that of the y-axis, signifying the spread of the horizontally due to thermoregulation. Therefore, the upright position of the thumb is important for controlling the temperature distribution.
HRV: HCRT induces both thermoregulation and autoregulation, reflected in VLF and VHF power, respectively. Thermoregulation is related to changes in the VLF power of HRV, whereas the change in VHF power is related to autoregulation. Hyperthermic conditions such as whole-body infrared-A irradiation (WBIAI) cause an increase in the low/high-frequency ratio (LFHF)50; in contrast, during HCRT, the LF and HF powers and their ratios have minor variations across study phases. The minimal changes in LF and HF indicate that the HCRT-governed thermogenesis plays a role in equalizing the SNS and PNS branches of ANS, which is supported by the convergence temperature difference between the left and right nostrils during HCRT by 88.6 %. The literature shows that breathing through the left and right nostrils is associated with sympathetic and parasympathetic activation, respectively.51 Hypothermia conditions increase the VLF power.17 The hyperthermia condition induced by HCRT2 significantly decreased the VLF, which is a key finding of this study. However, a significantly higher sub-VLF in 0.0327 - 0.04 Hz during HCRT2 confirms the particular sub-band of VLF responsible for thermogenesis during HCRT. In addition, an increase in the VLF power suggests more intensive sympathetic activity,52 which is attributed to 0.0327-0.04 Hz. Furthermore, the VLF/HF ratio was significantly lower during the HCRT2 phase than during the N2 phase, confirming higher HRV. A similar pattern of VLFHF was observed across sleep phases such as pre-sleep-wakefulness, non-rapid eye movement stage 2, slow-wave, and first rapid-eye-movement sleep (REM1).53 The dips significantly during slow-wave sleep compared to REM1.53 Therefore, HCRT may serve as an alternative to sleep therapy. The significant increase in VHF during the HCRT2 phase compared to the normal phase provides improved cardiovascular autoregulation, implying enhanced perfusion.
Exergy: The exergy analysis in this study sheds new light on the enhancement of the quality of thermoregulation through HCRT. HCRT shifts nostril dominance towards the right nostril. While most of the literature shows a decrease in exergy for the metabolic heat generated by moderate and extreme exercises,30 there is a relative increase in average exergy, and a significant increase in in the right nostril with heat production in the body due to HCRT is evident from exhaust breath.
The results showed a definitive thermogenesis process during HCRT, which facilitates glycolysis with a significant reduction in CBG in T2DM subjects. Hand clasping creates resistance to blood flow to the fingers due to the partial compression of artery branches at the lateral sides of the interlocking fingers, thereby causing better heat exchange from the muscle to the blood, which was not examined in the current study. Future work will include demonstrating the underlying mechanism behind the thumb’s role in the thermogenesis effect during isometric contraction of hand muscles, creating a bio-heat exchanger model, and solving the bio-heat equation with HCRT.
The HCRT causes thermogenesis in the body during HCRT1 through a significant increase in temperature slope and a non-significant increase in compared to that of normal states and regulated during HCRT2. However, changes in the parameters indicate thermoregulatory behavior. We observed the thermoregulatory control intervention from an intermittent variation of maximum eigenvalue and standard deviations of heat distribution in hot and cold spots, higher during HCRT1 and lower during HCRT2. The spatial distribution of the temperature from the thermal camera shows heat nucleation as the spot width decreases gradually during HCRT, equivalent to the convergence of the nostril temperature. Therefore, the combination of spatial and temporal effects causes a significant increase in thermogenesis solely because of HCRT. Thermogenesis by HCRT causes an enhancement in HRV with VHF dominance and relatively small changes in skin temperature. Moreover, a significant decrease in the VLF power indicates the thermogenic effect of an increase in core heat. The specific band responsible for the thermogenesis process during HCRT was 0.0327-0.04 Hz. HCRT had a noticeable effect on CBG in controlling diabetes.
Limitation and future work: The hypothesis requires an experimental study of calorimetry. Various physiological parameters, such as cardiac output, carotid-to-femoral pulse wave velocity, and electromyogram (EMG) of the lower arm muscles should be measured during the study phase. Pulse-wave velocity is an important parameter for arterial stiffness, and thermogenesis may result in lower arterial stiffness, which improves cardiovascular function. Moreover, sensible and latent heat measurements from exhaled breath through psychrometric analysis will strengthen thermogenesis by HCRT. A bio-heat exchanger model from the muscle to the blood will aid in understanding the bio-heat transfer mechanism.
Conceptualization, MM, KKD, DS;
methodology, DS, PKR;
software, DS, PKR;
visualization, DS;
validation, MM, KKD;
formal analysis, DS;
investigation, MM, KKD;
resources, PKR;
data curation, DS, PKR;
writing---original draft preparation, DS, PKR;
writing---review and editing, DS, PKR, MM, KKD;
supervision, MM, KKD;
All authors have read and agreed to the published version of the manuscript.
The protocol of this study involving humans was approved by the Institutional Ethical Committee (IEC) of IIT Madras (IEC/2023-03/MM/02/03) on 1st December 2023 for a period from 11/12/2023 – to 10/12/2024. The study conforms to the standards set by the latest revision of the Declaration and was conducted to comply with local legislation and institutional requirements. We collected written consent forms from each participant according to ethical guidelines.
| Views | Downloads | |
|---|---|---|
| F1000Research | - | - |
|
PubMed Central
Data from PMC are received and updated monthly.
|
- | - |
Provide sufficient details of any financial or non-financial competing interests to enable users to assess whether your comments might lead a reasonable person to question your impartiality. Consider the following examples, but note that this is not an exhaustive list:
Sign up for content alerts and receive a weekly or monthly email with all newly published articles
Already registered? Sign in
The email address should be the one you originally registered with F1000.
You registered with F1000 via Google, so we cannot reset your password.
To sign in, please click here.
If you still need help with your Google account password, please click here.
You registered with F1000 via Facebook, so we cannot reset your password.
To sign in, please click here.
If you still need help with your Facebook account password, please click here.
If your email address is registered with us, we will email you instructions to reset your password.
If you think you should have received this email but it has not arrived, please check your spam filters and/or contact for further assistance.
Comments on this article Comments (0)