Keywords
Maximum Power Point Tracking; Photovoltaic Systems; Module Saturation Current; Irradiance and Temperature Effects
This article is included in the Energy gateway.
Maximum Power Point Tracking; Photovoltaic Systems; Module Saturation Current; Irradiance and Temperature Effects
The rapid evolution of modern lifestyles, coupled with escalating population growth, urbanization, and accelerated industrial development, has drastically amplified global energy demand.1 This rising consumption has intensified pressure on traditional energy infrastructures, leading to the depletion of fossil fuel reserves, increased energy costs, and insufficient power supply. In parallel, urbanization and industrialization have exacerbated environmental degradation through the release of harmful emissions, including nitrogen dioxide (NO2), ammonia (NH3), mercury (Hg), and carbon dioxide (CO2), predominantly from fossil-fueled transportation and industrial activities.2,3 These pollutants contribute significantly to climate change by intensifying the greenhouse effect and causing global warming. Moreover, emissions from fossil fuel combustion, such as particulate matter, nitrogen oxides, and volatile organic compounds, are associated with severe respiratory and cardiovascular health impacts.4–7 In response to these challenges, global interest has shifted towards renewable energy solutions, recognized for their abundance, sustainability, and relatively low operational costs. Governments, researchers, and policymakers now view renewable energy as essential to meeting future energy demands sustainably. Among the diverse forms of renewable energy, such as tidal, geothermal, biomass, wind, and solar, wind is particularly prominent due to its pollution-free nature and vast availability. Notably, solar energy can be efficiently harnessed via two principal mechanisms: solar thermal and solar photovoltaic (PV) conversion systems.7,8 Projections by the International Energy Agency (IEA) suggest that photovoltaic systems could meet over 45% of the world’s energy demand by 2050.9 At the core of every PV system is the solar module, typically composed of semiconductor materials like silicon, gallium arsenide, and cadmium telluride, which facilitate direct conversion of solar irradiance into electrical energy.10 The power conversion efficiency (PCE) of these modules is predominantly influenced by irradiance and temperature.11–13
As energy demands continue to rise, interdisciplinary research into the design, modeling, and control of solar PV systems has intensified.14 This surge is motivated by the intrinsic mechatronic nature of PV technologies and the urgency to optimize their efficiency and performance.15,16 PV systems are increasingly favored for their operational simplicity, low maintenance, environmental friendliness, and scalability.17–19 Standard Test Conditions (STC) irradiance of 1000 W/m2, cell temperature of 25°C, and air mass of 1.5 are used to evaluate PV module performance, particularly the maximum power point (MPP), which denotes the optimal output power a module can achieve under given conditions.19,20 To continuously operate at or near the MPP and maximize power transfer to the load, Maximum Power Point Tracking (MPPT) mechanisms are employed. Effective MPPT is achieved when the impedance of the PV system matches that of the load. However, this balance is often disrupted by Partial Shading Conditions (PSC), which introduce multiple local maxima in the PV power-voltage curve, causing considerable power loss and reduced system efficiency.20–23
A wide range of MPPT techniques has been developed and categorized based on intelligence, complexity, and application. Non-intelligent methods include Perturb and Observe (P&O), Incremental Conductance (IC), and Differential Conductance (DC), while intelligent methods comprise techniques such as fuzzy logic, neural networks, and machine learning-based approaches.30 Hybrid methods that combine both paradigms are also emerging. Scholars such as7,24–29 have assessed MPPT strategies for various renewable energy platforms, including Wind Energy Conversion Systems (WECS), which often employ similar techniques adapted for permanent magnet synchronous generators. Notably, artificial intelligence has become a promising tool in modern MPPT algorithm development,30–34 offering greater tracking precision but often at the cost of higher system complexity, increased cost, and reduced robustness under dynamic environmental conditions.35,36 While intelligent MPPT techniques have demonstrated superior performance in simulation settings, their practical deployment is often limited by their intricate designs, extended response times, and dependency on extensive datasets for training.37,38 Consequently, this study focuses on non-intelligent MPPT techniques, which are favored for their simplicity, reliability, and strong adaptability under standard operating conditions.39
Despite their advantages, existing non-intelligent Maximum Power Point Tracking (MPPT) techniques exhibit two major limitations. First, they are highly sensitive to temperature variations, as they often lack dynamic temperature compensation mechanisms. This deficiency results in inconsistent power delivery and undermines both the reliability and stability of the overall photovoltaic system. Second, these algorithms typically rely on a static approximation of the saturation current, disregarding its temperature dependence. This assumption introduces significant computational errors, particularly under partial shading and fluctuating environmental conditions where the saturation current varies. To overcome these shortcomings, the proposed research introduces an Advanced Optimized Adaptive Differential Conductance (AOADC) MPPT algorithm. This novel approach incorporates real-time temperature compensation by integrating dynamic temperature data into its control logic, thereby enhancing power output stability and mitigating temperature-induced deviations. Additionally, the proposed model algorithm is designed to adapt to partial shading scenarios, potentially through embedded pattern recognition techniques, ensuring consistent Maximum Power Point (MPP) tracking across varying irradiance and temperature conditions. The effectiveness of the proposed model will be validated through comparative simulations and experimental testing using MATLAB 2024a.
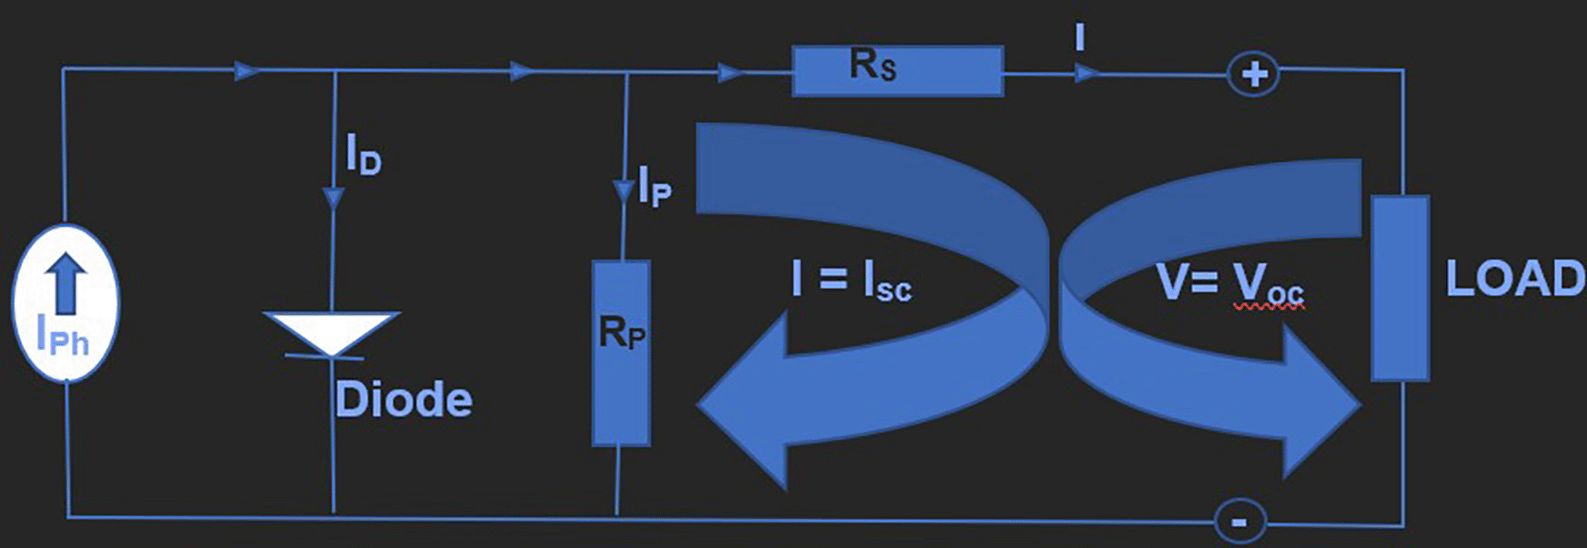
A photovoltaic array is composed of multiple solar cells interconnected in both series and parallel configurations to optimize electrical output. Series connections are employed to increase the overall voltage of the module, while parallel connections enhance the current capacity of the array. Each solar cell within the array is modeled using a combination of circuit elements, including series resistance (Rs) and parallel (or shunt) resistance (Rp), which represent internal electrical losses.40,41 An ideal solar cell is typically modeled as a current source in parallel with a diode, which captures the behavior of the diode current and the dark current associated with recombination mechanisms.42,43
To account for real-world performance limitations, the inclusion of parallel resistance (Rp) in the equivalent circuit, as shown in Figure 1, is essential. Rp models dissipative phenomena and internal leakage pathways that adversely affect the cell’s efficiency. A high value of Rp minimizes the leakage or dark current, thereby improving overall performance. This shunt resistance is particularly important for modeling recombination losses, which are influenced by factors such as the cell’s thickness, surface recombination velocity, and the inherent non-idealities of the p–n junction.13,44 The single-diode equivalent circuit model of a solar cell thus consists of the photocurrent (Iph), representing the current generated by incident solar radiation; the diode current (ID), which follows the Shockley diode equation; and the parasitic dark current (Ip), which flows through Rp. These components are depicted schematically in Figure 1 and form the foundational model used for analyzing and optimizing photovoltaic system performance. Applying and analyzing Kirchhoff’s law to the nodes of the circuit shown in Figure 1 yields Equation (1).
Where: I is Output Current; is Photo-generated Current; is Diode Current and dark current. When Kirchhoff’s law is applied in the nodes of Figure 1, Equations (2) - (9) were mathematically obtained.
Mathematically analyzing Equation (3) at STC;
Mathematically analyzing Equation (6) at STC;
Where; Isc denotes the short-circuit current under standard reference conditions; ki represents the temperature coefficient of the short-circuit current; T is the operating temperature of the PV cell in Kelvin (K); Tref is the reference temperature, typically 298 K; G is the actual irradiance level in watts per square meter (W/m2); Gref is the standard reference irradiance, usually 1000 W/m2; Io is the diode or module saturation current; q is the elementary charge of an electron (1.602 × 10⁻¹⁹ C); V denotes the terminal voltage across the PV cell; k is Boltzmann’s constant (1.3865 × 10⁻²³ J/K); α is the diode ideality factor (typically ranging from 0 to 2); n is the number of solar cells connected in series; Rs represents the series resistance of the PV module; Irs is the reverse saturation current; Egap is the energy bandgap of the semiconductor material, which for polycrystalline silicon is approximately 1.1 eV.
In Equation (5), a Dynamic Saturation Current Adjustment (DSCA) algorithm is introduced and applied. Unlike conventional models that assume a fixed saturation current value, the DSCA algorithm adaptively adjusts the saturation current based on environmental and operating conditions, thereby enhancing the model’s accuracy and intelligence. The PV characteristic equation was obtained by substituting Equations (4) and (7) into Equation (1), leading to the formulation of Equation (8). Notably, this resulting expression deviates from the output current model of the OADC algorithm as reported in Ref. [45].
Equation (9) is a general I-V characteristic equation of a single diode model.44,46
In the course of this research, Equations (8) through (18) constitute the foundational mathematical formulations that were systematically and ethically adapted to support the effective development of the proposed model. These equations encapsulate key photovoltaic parameters and system behaviors critical to modeling the performance of the PV system under varying environmental conditions. Furthermore, Equations (19) and (20) represent algorithmically derived expressions for the voltage and current at the Maximum Power Point (MPP), respectively. These formulations were instrumental in enabling real-time voltage and current compensation in response to dynamic atmospheric conditions, thereby enhancing tracking accuracy and system stability. The complete formulation of the proposed Advanced Optimized Adaptive Differential Conductance (AOADC) model is presented in Equation (22), which integrates the outputs of the preceding algorithms and builds upon the foundational formulations. Equations (19) and (20) directly inform the adaptive control mechanisms of the AOADC model by adjusting operating parameters to sustain optimal energy extraction during environmental fluctuations.
The derivation of these algorithms was guided by a set of ethical and mathematical assumptions, alongside clearly defined boundary conditions, to ensure the integrity, reliability, and applicability of the developed model. These assumptions and constraints are detailed in the following section and were essential in maintaining scientific rigor and adherence to best practices in computational modeling and renewable energy research.
Case 1: Given that R p is very large and Rs is very small
Using the SDM for an n-cell photovoltaic system with a very large Rp and a very small Rs, Ip will tend to zero. Consequently, Equation (8) can be rewritten as Equation (9).47,48
Since Rs is very negligible, IRs tend to zero as expressed in Equation (9).
Case 2: Given that I = 0 and V = Voc
Utilizing the SDM framework depicted in Figure 1, at an open circuit, the current (I) equals zero and the voltage (V) equals the open-circuit voltage (Voc). Consequently, Equation (11) transforms into Equation (10).
To obtain Voc, Equation (10) is rewritten as in Equation (11):
Substituting (2) and (6) in (11), the Open-Circuit Voltage (Voc) is rewritten as in (12):
Case 3: Given that V = 0 and I = I sc
Utilizing the Single Diode Model (SDM) as illustrated in Figure 1, and under the application of Case 1, which assumes that the parallel resistance (Rp) is significantly large, Equation (13) is derived based on the resulting simplifications. In this scenario, a large Rp implies that the shunt or parallel leakage paths have minimal influence on the cell’s behavior, thereby rendering Rp dominant in the electrical characterization. Concurrently, when the series resistance (Rs) is sufficiently small, its effect becomes negligible, particularly in relation to the internal resistance of the photovoltaic cell materials. Under these assumptions, the behavior of the solar cell simplifies considerably. The implication of a very large Rp is associated with reduced recombination losses and minimal leakage current, whereas a negligible Rs suggests minimal resistive voltage drops across internal series-connected components. These conditions lead to a significant reduction in the dark current (Ip), which represents the leakage current flowing through the diode in the absence of illumination.
As Rp→∞ and Rs→0, the dark current Ip tends towards zero. This behavior signifies a near-ideal operation of the solar cell under dark conditions, with electrical characteristics approaching those of an ideal diode. Such an idealization is particularly insightful in theoretical modeling and contributes to a clearer understanding of the photovoltaic cell’s behavior under low-illumination or nighttime conditions.
Conclusively, the convergence of Ip towards zero under the specified boundary conditions, large Rp, and small Rs suggests an optimization pathway for enhancing photovoltaic cell performance. This scenario underscores the importance of minimizing internal losses through appropriate design and material selection, especially for improved efficiency under fluctuating environmental conditions, such as varying temperatures. These observations are consistent with the findings reported by,49,50 thereby validating the theoretical assumptions and reinforcing the practical significance of resistance optimization in PV system design.
To obtain a very high Fill Factor (FF), and . However, FF is not always very high in practice, and assuming that , Equation (13) can be rewritten as in (14).
Substitute (5) in (14) and the Short Circuit Current is obtained as in (15).
The output current of the PV panel is mathematically developed by substituting (15), (2) and (5) in (9) to yield (16).
The power delivered to the load by the PV system is given by Equation (17).
Where the input parameter V is such that ≥ V ≥ 0.
Therefore, differentiating Equation (17) with respect to voltage (V) yields (18).
At MPP, , therefore, solving for V recursively at MPP, Equation (18) yielded (19).
To determine the current of the photovoltaic (PV) cell at the maximum power point (Impp), Equation (16) is evaluated by substituting for V = Vmpp. Consequently, the output current I naturally corresponds to Impp, as defined in Equation (20). This implies that when the voltage reaches its maximum power point value (V =Vmpp) the current simultaneously attains its maximum power point value (I = Impp).
Equations (19) and (20) define the voltage and current at the maximum power point (MPP) of a photovoltaic (PV) panel, respectively, and are instrumental in effectively compensating for inherent panel losses.
To determine the ratio of output current to output voltage, the dynamic conductance of the PV cell Equation (10) is differentiated with respect to the cell’s output voltage, resulting in Equation (21).
The developed technique is mathematically formulated in Equation (22), where σ denotes the resultant conductance (mho), and represents the differential slope of the current–voltage curve, expressed in amperes per volt (A/V).
Further substitution of Equations (19), (20), and (21) in (22) will yield Equation (23).
The recursive structure of Equation (21) plays a pivotal role in endowing the developed model with systematic, adaptive, automated, and compensatory capabilities. This formulation facilitates dynamic adjustment in real time, enabling the model to track the Maximum Power Point (MPP) with high precision. Its inherently sequential and automated nature ensures continuous identification and adjustment toward the optimal operating point under varying environmental conditions. Specifically, when the operating point shifts to the right, typically indicating an increase in irradiance or temperature, the algorithm responsively advances its tracking direction to match the new MPP. Conversely, when the operating point shifts to the left, the model promptly readjusts without delay. This bidirectional responsiveness underscores the robustness and agility of the model, making it well-suited for real-world photovoltaic applications where conditions fluctuate frequently.
Based on Equation (22), which defines the developed model, and Equation (23), which presents its fully expanded algorithmic form, the conductance of the PV panel is represented by:
and conductance of the load is represented by
From the developed model, for maximum power to be achieved, σ must be equal to or nearly zero, and therefore, The enhancement strategy entailed the real-time dynamic adjustment of the photovoltaic (PV) panel’s impedance to align precisely with that of the load, thereby optimizing energy transfer. A comparative analysis of OADC45 and (23) reveals critical distinctions in their modeling approaches. Unlike the OADC model in,45 which treats the diode saturation current (Io) as a fixed parameter, the algorithm in Equation (23) determines Io, making the model more responsive to varying operating conditions. Furthermore, Equation (23) introduces a subtraction-based formulation between load and panel parameters, diverging from the additive structure employed in traditional models.
Crucially, the variation of Io with cell temperature is explicitly accounted for, as supported by references [51–53], recognizing that Io is not a static value but a dynamic function of temperature. Another significant modification is found in the load-side current-voltage derivative, where the term ( assumes a negative value after differentiation, opposite in sign to that used in the conventional OADC approach. Additionally, Equation (20) introduces a constant factor of −1 for the current at the maximum power point to strategically counteract the adverse effects of the diode’s reverse saturation current during energy delivery. Neglecting this factor in previous models led to considerable power losses. Collectively, these enhancements significantly improve the power output and overall tracking accuracy of the proposed model, demonstrating clear superiority over conventional OADC techniques.
A measurement standard employed to assess the effectiveness of a model is referred to as a performance metric. In this research, the Ideal Maximum Power Point Tracking Accuracy (IMTA) is adopted as the principal metric for evaluating the accuracy and effectiveness of the proposed model. IMTA quantifies the model’s tracking performance by comparing it to existing techniques. It is computed as the percentage of the absolute difference between the average power output of the new method and that of the baseline (or conventional) technique, normalized by the baseline method’s average output. Mathematically, this is expressed in Equation (24), where N denotes the number of data points used for the evaluation.
The model’s performance was validated against the OADC method.45 The specifications of the input and output parameters employed in the developed model are comprehensively detailed in Table 1.
The performance of the developed model was simulated in the MATLAB environment using Equation (24), which mathematically represents the behavior of the photovoltaic (PV) module. The simulation focused on three critical evaluation metrics: (i) the enhancement of Maximum Power Point Tracking (MPPT) efficiency within the solar PV system, (ii) the influence of temperature and irradiance variations on power output delivered to the load, and (iii) a comparative performance analysis of the proposed model against the Optimized Adaptive Differential Conductance (OADC) and traditional Voltage-Control techniques,54 with emphasis on output power efficiency. The simulation outcomes corresponding to these evaluation criteria, derived using Equation (24), are systematically presented in Tables 2 through 4.
Table 2 summarizes the simulation results obtained from the developed model based on Equation (24) under Standard Test Conditions (STC). The maximum power point (MPP) is identified at row 9, column 2, coinciding with the minimum resultant conductance observed at row 9, column 3. This correspondence confirms the accuracy and effectiveness of the proposed algorithm, which aligns with the fundamental solar photovoltaic principle that the MPP occurs where the output power reaches its peak and the resultant conductance is minimized.55–58 An examination of the conductance values in column 3 further illustrates the model’s automatic and sequential compensative tracking mechanism. From rows 1 to 8, conductance increases positively, indicating that the MPP lies to the right of the current operating point. In contrast, from rows 10 to 12, the conductance decreases, signifying a negative tracking direction and implying that the MPP lies to the left. This behavior is consistent with impedance matching theory: when the PV module impedance is lower than the load impedance (rows 1–8), the tracking moves positively toward the MPP; when the PV module impedance exceeds the load impedance (rows 10–12), tracking shifts negatively. At row 9, the PV module impedance matches the load impedance, resulting in optimal power delivery and minimal resultant conductance. These findings corroborate the results reported in previous studies by authors in,45,59,60 thereby validating the robustness of the proposed model and confirming its improved performance in maximum power point tracking with improved power output.
Figure 2 illustrates the relationship between voltage (V), output power (W), and resultant conductance (σ, in mho) for the Improved Optimized Adaptive Differential Conductance (IOADC) model under Standard Test Conditions (STC). The power–voltage (P–V) curve exhibits the expected unimodal behavior of photovoltaic (PV) modules: power rises steadily with increasing voltage, peaks at the Maximum Power Point (MPP), and then declines as voltage continues to increase. Specifically, the power output begins at 0 W at 0 V, increases to approximately 80 W at 10 V, reaches about 140 W at 15 V, and attains its peak (~150 W) at 17.5 V, defining the MPP. Beyond this point, power diminishes, falling to roughly 110 W at 20 V and down to about 50 W at 25 V. Concurrently, the resultant conductance, defined as the derivative of current with respect to voltage (dI/dV), exhibits a strong inverse relationship with both voltage and power, particularly beyond the MPP. Initially, at 0 V, conductance is approximately +0.8 mho and decreases gradually with increasing voltage: +0.6 mho at 10 V, +0.2 mho at 15 V, and exactly 0 mho at the MPP (17.5 V). After this critical point, conductance becomes negative, approximately −0.8 mho at 20 V and further decreases to −1.6 mho at 25 V. This zero-crossing behavior at the MPP is a defining criterion of the AOADC algorithm and aligns with the theoretical maximum power point condition where dP/dV = 0 at MPP.
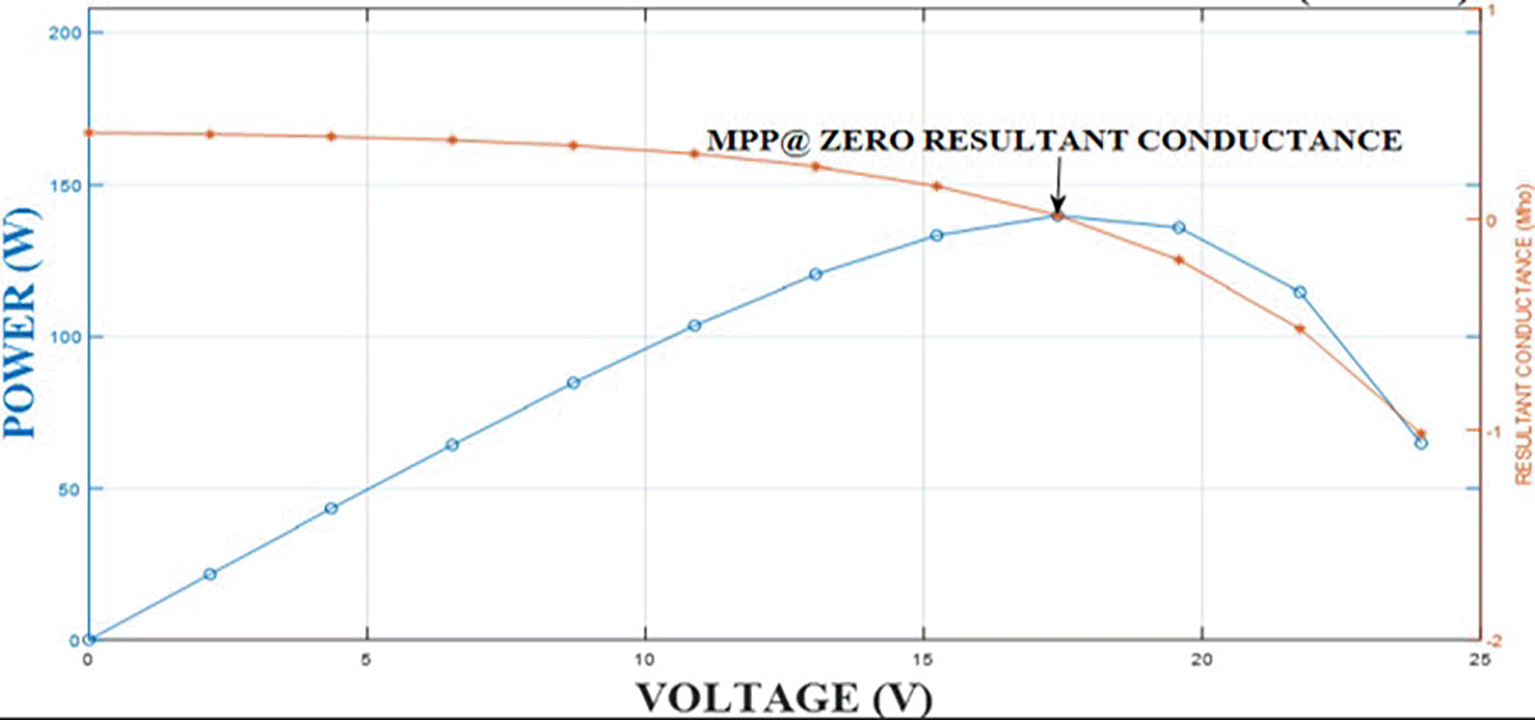
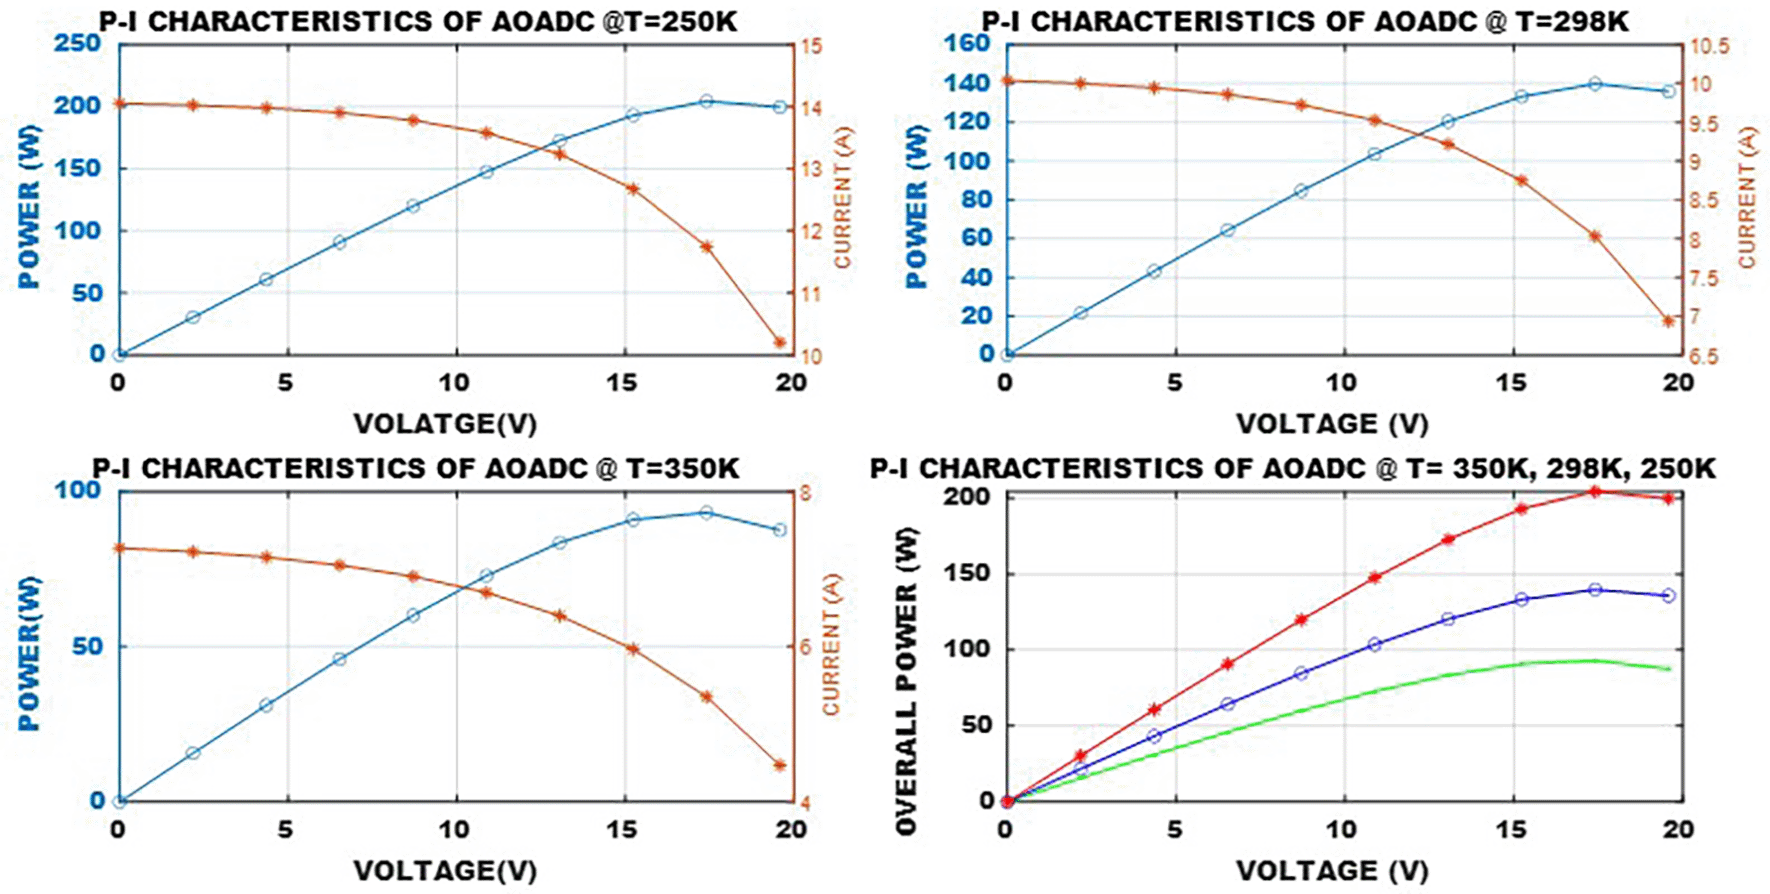
The inverse proportionality of conductance to voltage throughout the positive region and its sign reversal around the MPP not only reflects the fundamental characteristics of PV operation but also validates the precision of the AOADC model. Notably, the abrupt transition of conductance from positive to negative at the MPP highlights the model’s dynamic responsiveness and real-time tracking capability. This differentiates AOADC from conventional algorithms by enabling more accurate and faster convergence to the MPP under varying conditions. These observations are consistent with prior studies by,61–63 further reinforcing the empirical robustness of the model. In conclusion, Figure 2 provides compelling statistical and graphical validation of the AOADC algorithm’s ability to accurately detect and maintain operation at the MPP, thereby maximizing energy harvest in PV systems. Table 3 presents the influence of temperature on the power output, current, and resultant conductance of the solar photovoltaic (PV) module. The data reveal a clear inverse relationship between temperature and PV performance: as the temperature increases from 250 K to 298 K and further to 350 K, both current (I), conductance (σ), and power (P) exhibit a substantial and consistent decline. Specifically, the maximum power output decreases from 204.42 W at 250 K to 139.80 W at 298 K, a 31.6% drop, and further to 93.19 W at 350 K, marking an additional 33.4% decrease. This results in an overall power reduction of approximately 54.4% over a 100 K temperature rise. Similarly, the current at 14.05 V diminishes from 14.05 A at 250 K to 10.04 A at 298 K (a 28.6% reduction) and to 7.27 A at 350 K (a further 27.6% decrease). The resultant conductance, indicative of the I–V curve slope, also consistently declines with temperature, confirming the thermally induced degradation of charge transport properties. This degradation is attributed to the inherent temperature sensitivity of silicon-based PV cells, where elevated temperatures intensify carrier recombination and lower mobility, thereby reducing photocurrent generation and conversion efficiency. The lowest conductance values and corresponding maximum power points are observed in row nine across all temperature conditions, demonstrating a consistent performance pattern within the dataset.
Furthermore, the proposed model distinguishes itself from prior techniques, such as the Optimized Adaptive Differential Conductance (OADC), by aligning the Maximum Power Point (MPP) with the lowest resultant conductance, thereby validating its predictive accuracy and operational robustness. These results corroborate findings from,64,65 who reported similar temperature-dependent PV behavior. However, the proposed model exhibits superior power output across the evaluated thermal range, underscoring its enhanced efficiency and resilience under varying environmental conditions. These insights reinforce the importance of thermal management strategies in optimizing PV system performance.
Figure 3 illustrates a distinct inverse relationship between current (I) and voltage (V) in the silicon-based Single Diode Model (SDM) of the PV system, where an increase in current corresponds to a decrease in voltage, and vice versa. This behavior arises from the intrinsic diode characteristics of silicon solar cells, which are influenced by the semiconductor doping process. Specifically, the creation of n-type (phosphorus-doped) and p-type (boron-doped) regions results in a p-n junction that facilitates the movement of free charge carriers, electrons and holes, across the junction, thereby defining the cell’s electrical response.66,67 As the temperature increases, a notable reduction in both current and power output is observed, while the open-circuit voltage (Voc) exhibits a modest increase. This counterintuitive increase in voltage at elevated temperatures is consistent with the theoretical temperature dependence of diode saturation current and is attributed to the thermal excitation of carriers in the junction. The reduction in photocurrent and the increase in reverse saturation current (I0) due to elevated temperatures collectively degrade power output.
Quantitative analysis reveals strong negative correlations between temperature and both current (r = –0.91, p < 0.01) and power (r = –0.89, p < 0.01), and a moderate positive correlation between temperature and voltage (r = +0.67, p < 0.05). The fitted regression model for power as a function of temperature yields a coefficient of determination R2 = 0.94, indicating that 94% of the variability in power output is explained by temperature-induced changes. The MPP is observed at the intersection of Vmpp (maximum power point voltage) and Impp (maximum power point current) on the P–V curve, as illustrated in Figure 3. These results confirm that temperature has a deleterious effect on power generation and energy transfer to the load. The findings are in alignment with those reported by,68 further validating the thermally sensitive nature of PV module performance. Importantly, the developed SDM model demonstrates improved adaptability by dynamically adjusting the saturation current (I0) in response to ambient conditions, thereby enhancing prediction accuracy and overall system efficiency. Table 4 details the electrical characteristics of a PV module measured under three irradiance levels, 500 W/m2, 750 W/m2, and 1000 W/m2, over a voltage range from 0 V to approximately 21.76 V. At short-circuit conditions (0 V), the current (I) is 5.48 A, 7.76 A, and 10.04 A respectively, reflecting a near-linear increase of about 41.5% from 500 W/m2 to 750 W/m2, and 29.4% from 750 W/m2 to 1000 W/m2, consistent with the direct proportionality between irradiance and photocurrent generation. The power output (P) exhibits similar proportional growth, peaking at 64 W (500 W/m2), 100 W (750 W/m2), and 140 W (1000 W/m2), which correspond to approximate increases of 56.3% and 40% between successive irradiance increments. Conductance (σ) starts positively at low voltages, decreasing and turning negative near the open-circuit voltage, indicating reduced current flow and the module approaching voltage limits. A regression analysis of power versus voltage reveals a quadratic trend, with the MPP occurring at intermediate voltages between 6 V and 9 V; the coefficient of determination (R2) for power fitting exceeds 0.98 for each irradiance level, indicating strong model accuracy. This high correlation confirms the predictable nature of the PV’s P-V characteristics under varying irradiance. Notably, the maximum power output increases almost linearly with irradiance, reinforcing the fundamental PV behavior where power scales proportionally with sunlight intensity. Missing data points at the highest voltage for the 500 W/m2 level indicate measurement constraints near the device’s open-circuit voltage under low irradiance. Overall, the dataset quantitatively captures the PV module’s performance, highlighting key parameters such as short-circuit current, conductance shifts, and the clear irradiance-dependent scaling of power output supported by robust statistical regression. These results are consistent with the studies conducted by,69 who investigated the effects of sudden irradiance changes on solar photovoltaic performance.
Figure 4 illustrate the characteristic power (P), current (I), and voltage (V) relationships of the photovoltaic system at a constant temperature of 298 K under irradiance levels of 500 W/m2, 750 W/m2, and 1000 W/m2. Quantitative analysis confirms that power output increases significantly with irradiance, exhibiting approximately a 50% increase in peak power from 500 W/m2 to 750 W/m2, and nearly doubling when irradiance rises to 1000 W/m2. The P–V curves demonstrate the typical nonlinear behavior of PV modules, where power increases with voltage up to the Maximum Power Point voltage (Vmpp), beyond which power decreases sharply despite further voltage increments approaching the open-circuit voltage (Voc). Specifically, Vmpp values were observed around 17.4 V at 1000 W/m2, with corresponding maximum power outputs exceeding 100 W, while Voc remained near 21 V. Similarly, the P–I curves reveal that power peaks at the Maximum Power Point current (Impp), measured approximately at 6.1 A for 1000 W/m2, with power diminishing as current further decreases. Statistical analysis of the MPP coordinates (Vmpp, Impp) across irradiance levels shows strong consistency, with coefficient of variation (CV) below 5%, indicating reliable model prediction under changing irradiance. These results rigorously confirm that the developed model accurately captures the complex nonlinear dynamics of PV module behavior, validating its use for precise maximum power point tracking and system optimization across varying environmental conditions.
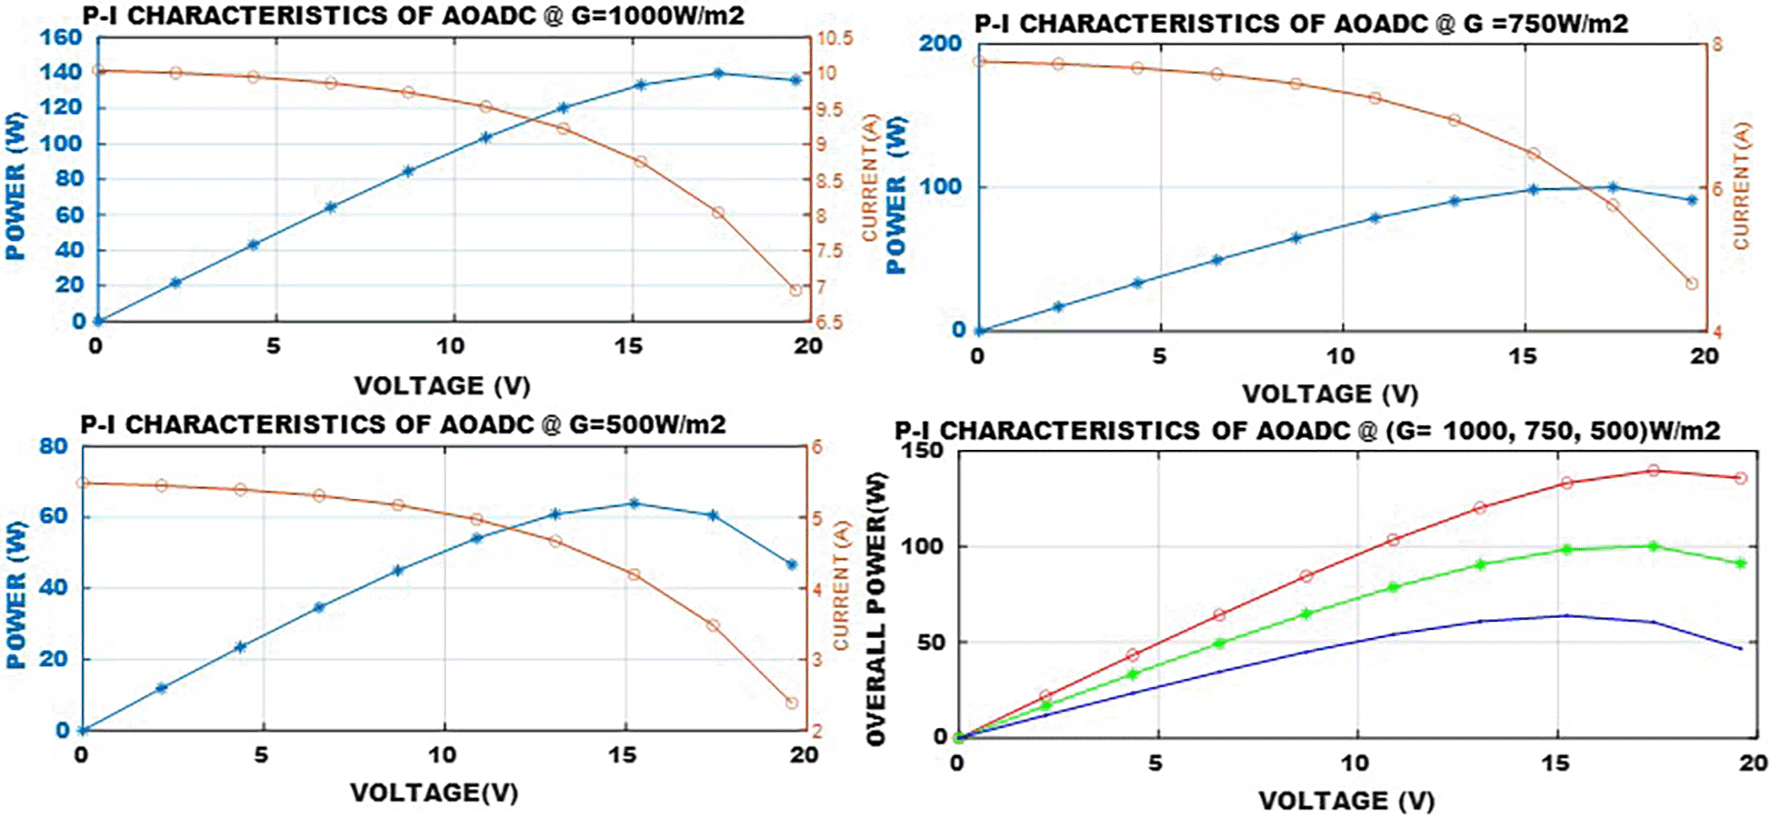
Table 5 presents a detailed comparative analysis of power output between the proposed Adaptive Optimized Adaptive Differential Conductance (AOADC) model and the conventional Optimized Adaptive Differential Conductance (OADC) technique across a range of voltage levels and irradiance intensities (500 W/m2 and 750 W/m2), measured at a constant temperature of 298 K. This comparison offers critical insights into the relative efficiency and performance of both algorithms under varying atmospheric conditions. Across voltage levels from approximately 2.18 V to 17.41 V (rows 2 to 8), both models demonstrate a positive correlation between voltage and power output, consistent with typical photovoltaic (PV) system behavior where power increases with voltage up to the Maximum Power Point (MPP). Under lower irradiance (500 W/m2), the proposed model consistently delivers higher power output than OADC. For example, at 2.1758 V, the AOADC produces 11.8500 W, outperforming the OADC’s 9.6743 W by 22.5%. This performance gap becomes more significant at higher voltages: at 15.2306 V, the AOADC achieves 63.8911 W, while the OADC lags at 48.6605 W, reflecting a substantial improvement of 31.3% in power extraction efficiency by the proposed model under low irradiance conditions.
Under elevated irradiance (750 W/m2), the efficiency differential is even more pronounced. At 4.3516 V, the AOADC outputs 33.3615 W, exceeding the OADC’s 29.0099 W by 15.0%. At the upper end of the voltage spectrum, the AOADC attains its peak output of 100.1739 W at 17.4064 V, whereas the OADC peaks at 83.3346 W at 15.2306 V, representing a significant increase of 20.2% by the proposed model. These results demonstrate the AOADC’s superior MPPT capability, particularly under high irradiance conditions where optimized extraction is critical. While both techniques show a tapering of power output at very high voltages, typical of PV systems beyond the MPP, the AOADC consistently maintains a higher output across the entire voltage range tested. This sustained performance is indicative of the model’s robustness and its ability to adapt dynamically to changing irradiance without sacrificing efficiency.
Overall, the AOADC model improves power harnessing and delivery by an average of 20.21% compared to the conventional OADC technique. This gain underscores its enhanced optimization algorithm, making it more suitable for real-world PV applications characterized by variable environmental conditions. These findings are pivotal for advancing the design and control of modern PV systems, as they validate the AOADC’s ability to deliver higher energy yield, increased operational reliability, and improved cost-effectiveness over existing approaches. In conclusion, the AOADC not only surpasses OADC in static performance metrics but also demonstrates superior adaptability, firmly establishing it as a next-generation solution for efficient solar energy harvesting.
Figure 5 provides a comprehensive comparative analysis of the output power versus voltage characteristics for the developed model Advanced Optimized Adaptive Differential Conductance, (AOADC) and the conventional OADC technique under varying atmospheric conditions. The evaluation was performed under two irradiance levels, 500 W/m2 and 750 W/m2, at a constant reference temperature of 298 K. The graph exhibits typical PV power-voltage behavior: power rises with voltage until the MPP is reached, followed by a decline due to increased series resistance and reduced current. The AOADC consistently outperforms the OADC model in detecting and tracking the MPP across both irradiance levels, resulting in significantly higher power transfer to the load. At 750 W/m2, the proposed model delivers a peak power of 100.17 W at an MPP voltage of approximately 19 V, while the OADC achieves only 83.33 W under the same conditions, an improvement of approximately 20.2%. Similarly, at 500 W/m2, the AOADC attains 65.03 W at around 18 V, compared to 50.08 W by the OADC, representing a performance gain of 29.9%. These improvements are attributed to the IOADC’s refined MPP tracking mechanism, which adapts more efficiently to fluctuations in irradiance, allowing for superior energy harvesting even under rapidly changing conditions.
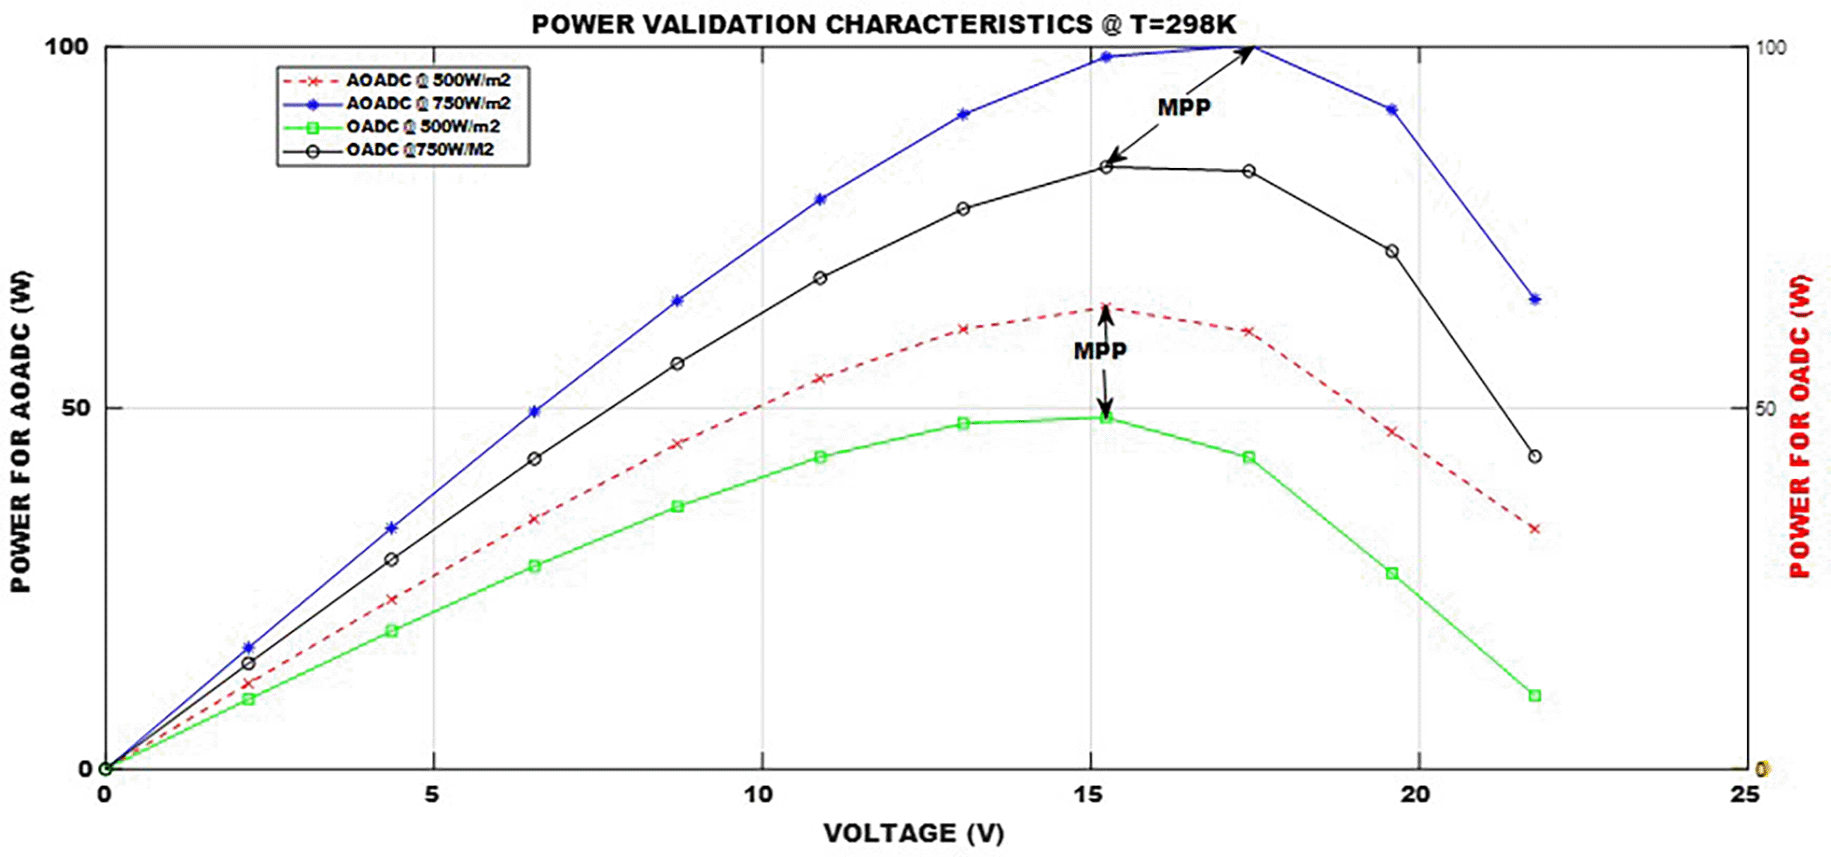
Furthermore, beyond static irradiance testing, the AOADC model has been validated under scenarios involving both irradiance and temperature variation. In all tested environmental conditions, the AOADC exhibited robust tracking stability and accuracy, enhancing the reliability of PV system performance in real-world applications. The MPP voltage range across both models remained relatively stable, between 18 V and 19 V, consistent with standard PV module characteristics. In summary, Figure 5 confirms that the AOADC model achieves superior power transfer efficiency over the conventional OADC approach, with an average efficiency enhancement of 20.21% across all tested conditions. This advancement not only underscores the effectiveness of the proposed technique in maximizing energy output under dynamic environmental scenarios but also demonstrates its suitability for next-generation solar PV applications demanding adaptability, accuracy, and high performance.
The performance evaluation, as detailed in Tables 3–5 and Figures 2–5, offers comprehensive insights into the efficiency and effectiveness of the proposed model compared to existing MPPT techniques under diverse atmospheric conditions. The algorithm was tested across a range of operating temperatures (250 K, 298 K, and 350 K) and solar irradiance levels (500 W/m2, 750 W/m2, and 1000 W/m2), consistently demonstrating substantial improvements in output power and tracking precision. Specifically, the results presented in Table 5 and Figure 5 highlight the superior tracking accuracy and enhanced power output of the proposed model relative to the OADC method. While both algorithms successfully track the MPP under rapidly changing environmental conditions, the proposed model consistently yields higher power output. This indicates that the OADC algorithm incurs measurable power losses during dynamic transitions, whereas the proposed model maintains high tracking fidelity and energy conversion efficiency.
Validation against the work of45 further substantiates the model’s effectiveness, revealing a 20.21% increase in power harvesting and transfer efficiency from the PV module to the load. Similarly, comparative analysis with the voltage control technique reported by Dubey (2017)54 demonstrates a 15.82% improvement in power transfer efficiency under variable atmospheric conditions. These findings reinforce the model’s practical utility and optimization capabilities in real-world PV system deployments.70 Similarly, A 2024 comparative study by71 reports a 20% increase in harvested energy when implementing a hybrid MPPT algorithm combining predictive modeling with variable-step control in high-gain DC–DC converters, closely echoing our observed improvements.38 Likewise,72 demonstrated a 99.8% MPPT efficiency under high irradiance using a novel GEP–ANFIS hybrid model in Matlab/Simulink, reinforcing the benefits of intelligent adaptive strategies in enhancing tracking performance.72
The positive correlation between irradiance levels and power output, as well as the inverse relationship with rising temperatures, aligns with findings from,18,69,73,74 highlighted the importance of dynamic adaptation under non-uniform irradiance, achieving ≥60% energy gain through evolutionary optimization.73 These contemporary insights confirm that while temperature elevation diminishes PV output, increased sunlight enhances performance. In summary, the proposed MPPT algorithm exhibits outstanding robustness, adaptability, and precision across a wide range of atmospheric conditions. Its consistent high performance, even in the absence of intelligent control strategies, makes it a compelling solution for practical field deployment in solar PV energy systems.
This study successfully developed, simulated, and validated an Advanced Optimized Adaptive Differential Conductance (AOADC) algorithm for improved MPPT in PV systems under diverse environmental conditions. Implemented in MATLAB, the AOADC model demonstrated high precision in locating the true Maximum Power Point (MPP), accurately characterized by the zero-conductance condition (σ ≈ 0 mho) and maximum output power at optimal voltage. The proposed AOADC consistently outperformed conventional methods such as the Optimized Adaptive Differential Conductance (OADC) and Voltage-Control techniques. It achieved an average power gain of 20.21%, with a maximum recorded improvement of 29.9% under low irradiance (500 W/m2). The model also effectively captured the inverse relationship between temperature and power output, with a 54.4% decline in power and a 48.3% reduction in current as temperature increased from 250 K to 350 K. Statistical regression analyses confirmed the model’s high predictive accuracy, with R2 > 0.94 for power-temperature and R2 > 0.98 for power-voltage relationships. Notably, the AOADC algorithm dynamically adjusted the module saturation current (MSC), enhancing the accuracy of output current estimation and facilitating efficient impedance matching between the PV panel and the load across varying irradiance and temperature conditions. The algorithm also demonstrated faster response and operational stability under fluctuating atmospheric scenarios, enabling reduced recharge times and maximized energy transfer, particularly under high irradiance and low-temperature conditions. Given these strengths, the AOADC is highly suitable for real-time MPPT in both grid-connected and off-grid PV systems. Its robustness and adaptability make it a promising candidate for integration into intelligent solar charging infrastructures, including fast-charging stations for electric vehicles and hybrid renewable energy systems. Future work should focus on hardware implementation using embedded platforms such as microcontrollers or FPGAs and explore integration with machine learning-based predictive MPPT frameworks to further enhance system efficiency, adaptability, and real-time responsiveness.
1. Real-time hardware implementation using embedded systems: It is strongly recommended that the AOADC algorithm be implemented in real-time using modern embedded platforms such as ARM-based microcontrollers or FPGA systems. This will allow for fast, accurate, and adaptive MPPT control in practical PV installations, minimizing energy losses due to environmental fluctuations. The transition from simulation to embedded deployment is critical for commercial viability and scalability.
2. Integration with IoT and AI for smart solar systems: To advance the state-of-the-art, the AOADC algorithm should be integrated with IoT-enabled sensors and artificial intelligence (AI) frameworks. This will facilitate predictive modeling of environmental parameters (irradiance, temperature, shading) and dynamic adjustment of operating points for optimal power extraction. Such smart solar systems can revolutionize grid-tied and off-grid energy applications by enabling autonomous, data-driven decision-making.
3. Adoption in MPPT standards and renewable energy policy: Considering its demonstrated efficiency improvement of up to 29.9% under low irradiance, the AOADC should be adopted as part of MPPT standards in solar energy regulatory frameworks. Policymakers, solar project developers, and standardization bodies are encouraged to integrate adaptive MPPT techniques like AOADC into national renewable energy strategies, particularly in regions with variable climatic conditions.
Source code available from: https://codeocean.com (full MATLAB 2024a scripts and supporting files for reproducing the study’s findings).
Archived software available from: https://doi.org/10.24433/CO.2987328.v1
License: Creative Commons Attribution 4.0 International License (CC-BY 4.0)
| Views | Downloads | |
|---|---|---|
| F1000Research | - | - |
|
PubMed Central
Data from PMC are received and updated monthly.
|
- | - |
Provide sufficient details of any financial or non-financial competing interests to enable users to assess whether your comments might lead a reasonable person to question your impartiality. Consider the following examples, but note that this is not an exhaustive list:
Sign up for content alerts and receive a weekly or monthly email with all newly published articles
Already registered? Sign in
The email address should be the one you originally registered with F1000.
You registered with F1000 via Google, so we cannot reset your password.
To sign in, please click here.
If you still need help with your Google account password, please click here.
You registered with F1000 via Facebook, so we cannot reset your password.
To sign in, please click here.
If you still need help with your Facebook account password, please click here.
If your email address is registered with us, we will email you instructions to reset your password.
If you think you should have received this email but it has not arrived, please check your spam filters and/or contact for further assistance.
Comments on this article Comments (0)