Keywords
R, visualisation, exploratory data analysis, multidimensional, parallel coordinate plots
This article is included in the RPackage gateway.
R, visualisation, exploratory data analysis, multidimensional, parallel coordinate plots
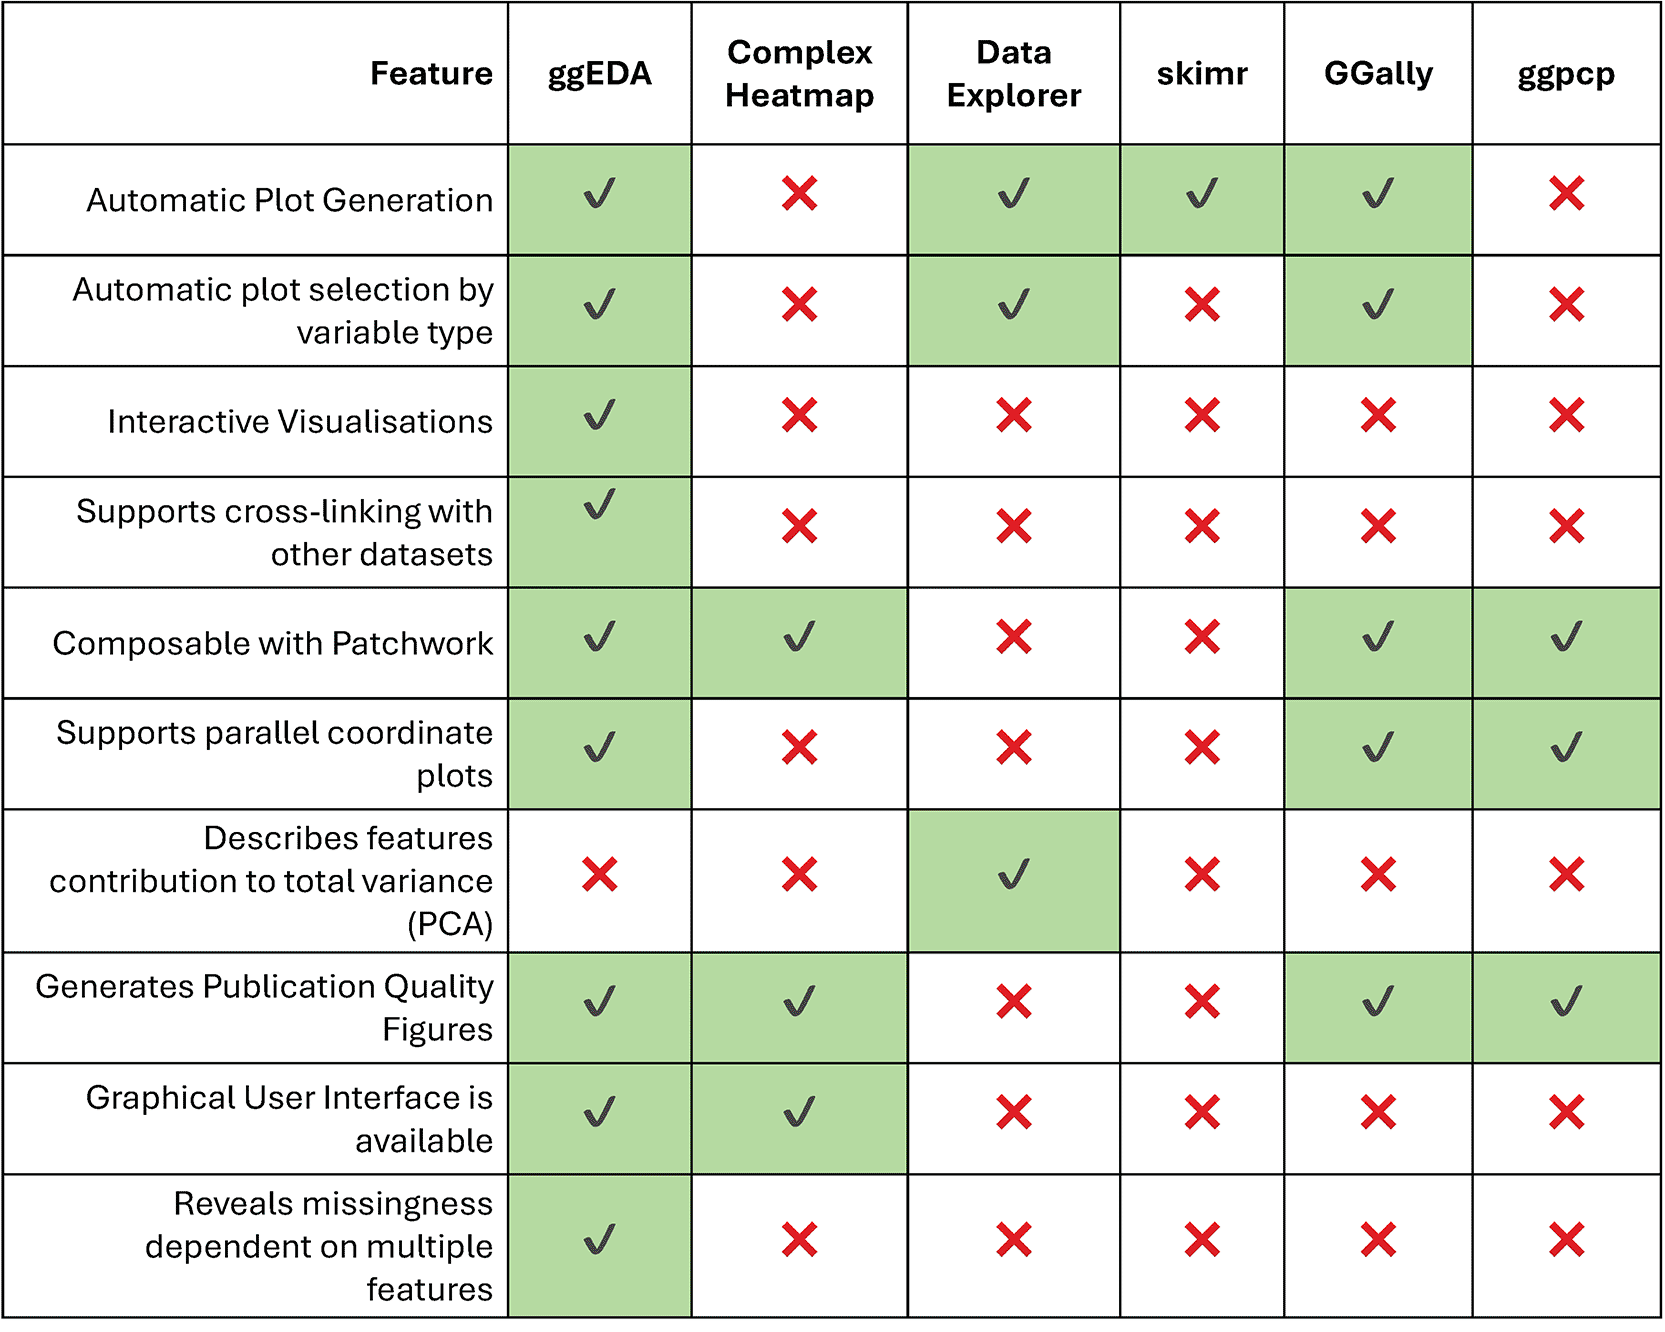
Exploratory data analysis (EDA) reveals relationships between data features, informing hypothesis generation and downstream analyses. It can also identify data-quality issues such as missingness, bias, and unexpected distribution structure. The R ecosystem already includes popular EDA packages such as skimr, which textually summarises completeness and descriptive statistics for individual features (1-dimensional), and GGally, which graphically describes pairwise feature correlations (2-dimensional) or multi-feature relationships through PCPs (n-dimensional). ggEDA enhances this ecosystem by providing interactive versions of standard n-dimensional visualisations like PCPs and introducing tiled one-dimensional visualisations that more effectively show missingness and relationships between categorical features in smaller datasets. Together, these visualisations provide key advantages over other EDA packages, most notably an ability to reveal a greater variety of multidimensional patterns ( Figure 1).
ggEDA is implemented as a standard R package and published on CRAN and the R-universe. The interactiveEDA web app was written using the shiny framework6 and takes ggEDA as a dependency to separate the user-interface codebase from the underlying business logic, which is easier to test. interactiveEDA is compiled into a purely client-side web-assembly app using shinylive7 and hosted as a static web-page on GitHub Pages. Code to produce visualisations is run in the client’s browser instead of a third party server outside the direct control of end-users. The distributed nature of compute also provides scaling benefits compared to traditional server-side shiny apps that quickly slow as concurrent users grow. These security and scalability benefits do come at the cost of slower application startup time.
The ggEDA R package can be installed from CRAN ( install.packages(“ggEDA”)). It is compatible with Mac OS X, Windows, and all Unix-like operating systems where R (≥3.5.0) can be installed. Package dependencies are described on the ggEDA CRAN listing .
Data can be explored using the interactiveEDA web app in any modern browser that supports WebAssembly. We performed the most extensive testing in Chrome (version 137.0.7151.120), however the app is also compatible with Firefox, Safari and Microsoft Edge.
To demonstrate how ggEDA and interactiveEDA support exploratory data analysis, we present a series of use cases that highlight their capabilities in visualising multidimensional datasets.
PCPs are a well-established EDA visualisation that reveal trends in predominantly quantitative datasets and detect outliers in one or more dimensions. Quantitative features are represented as a series of parallel axes with samples visualised as lines passing through each axis at the point of its value. Correlative relationships are revealed when feature axes are ordered based on line crossing minimisation algorithms or mutual information with a categorical feature. ggEDA can produce interactive PCPs from any dataset with quantitative features using the ggparallel(data) command ( Figure 2).
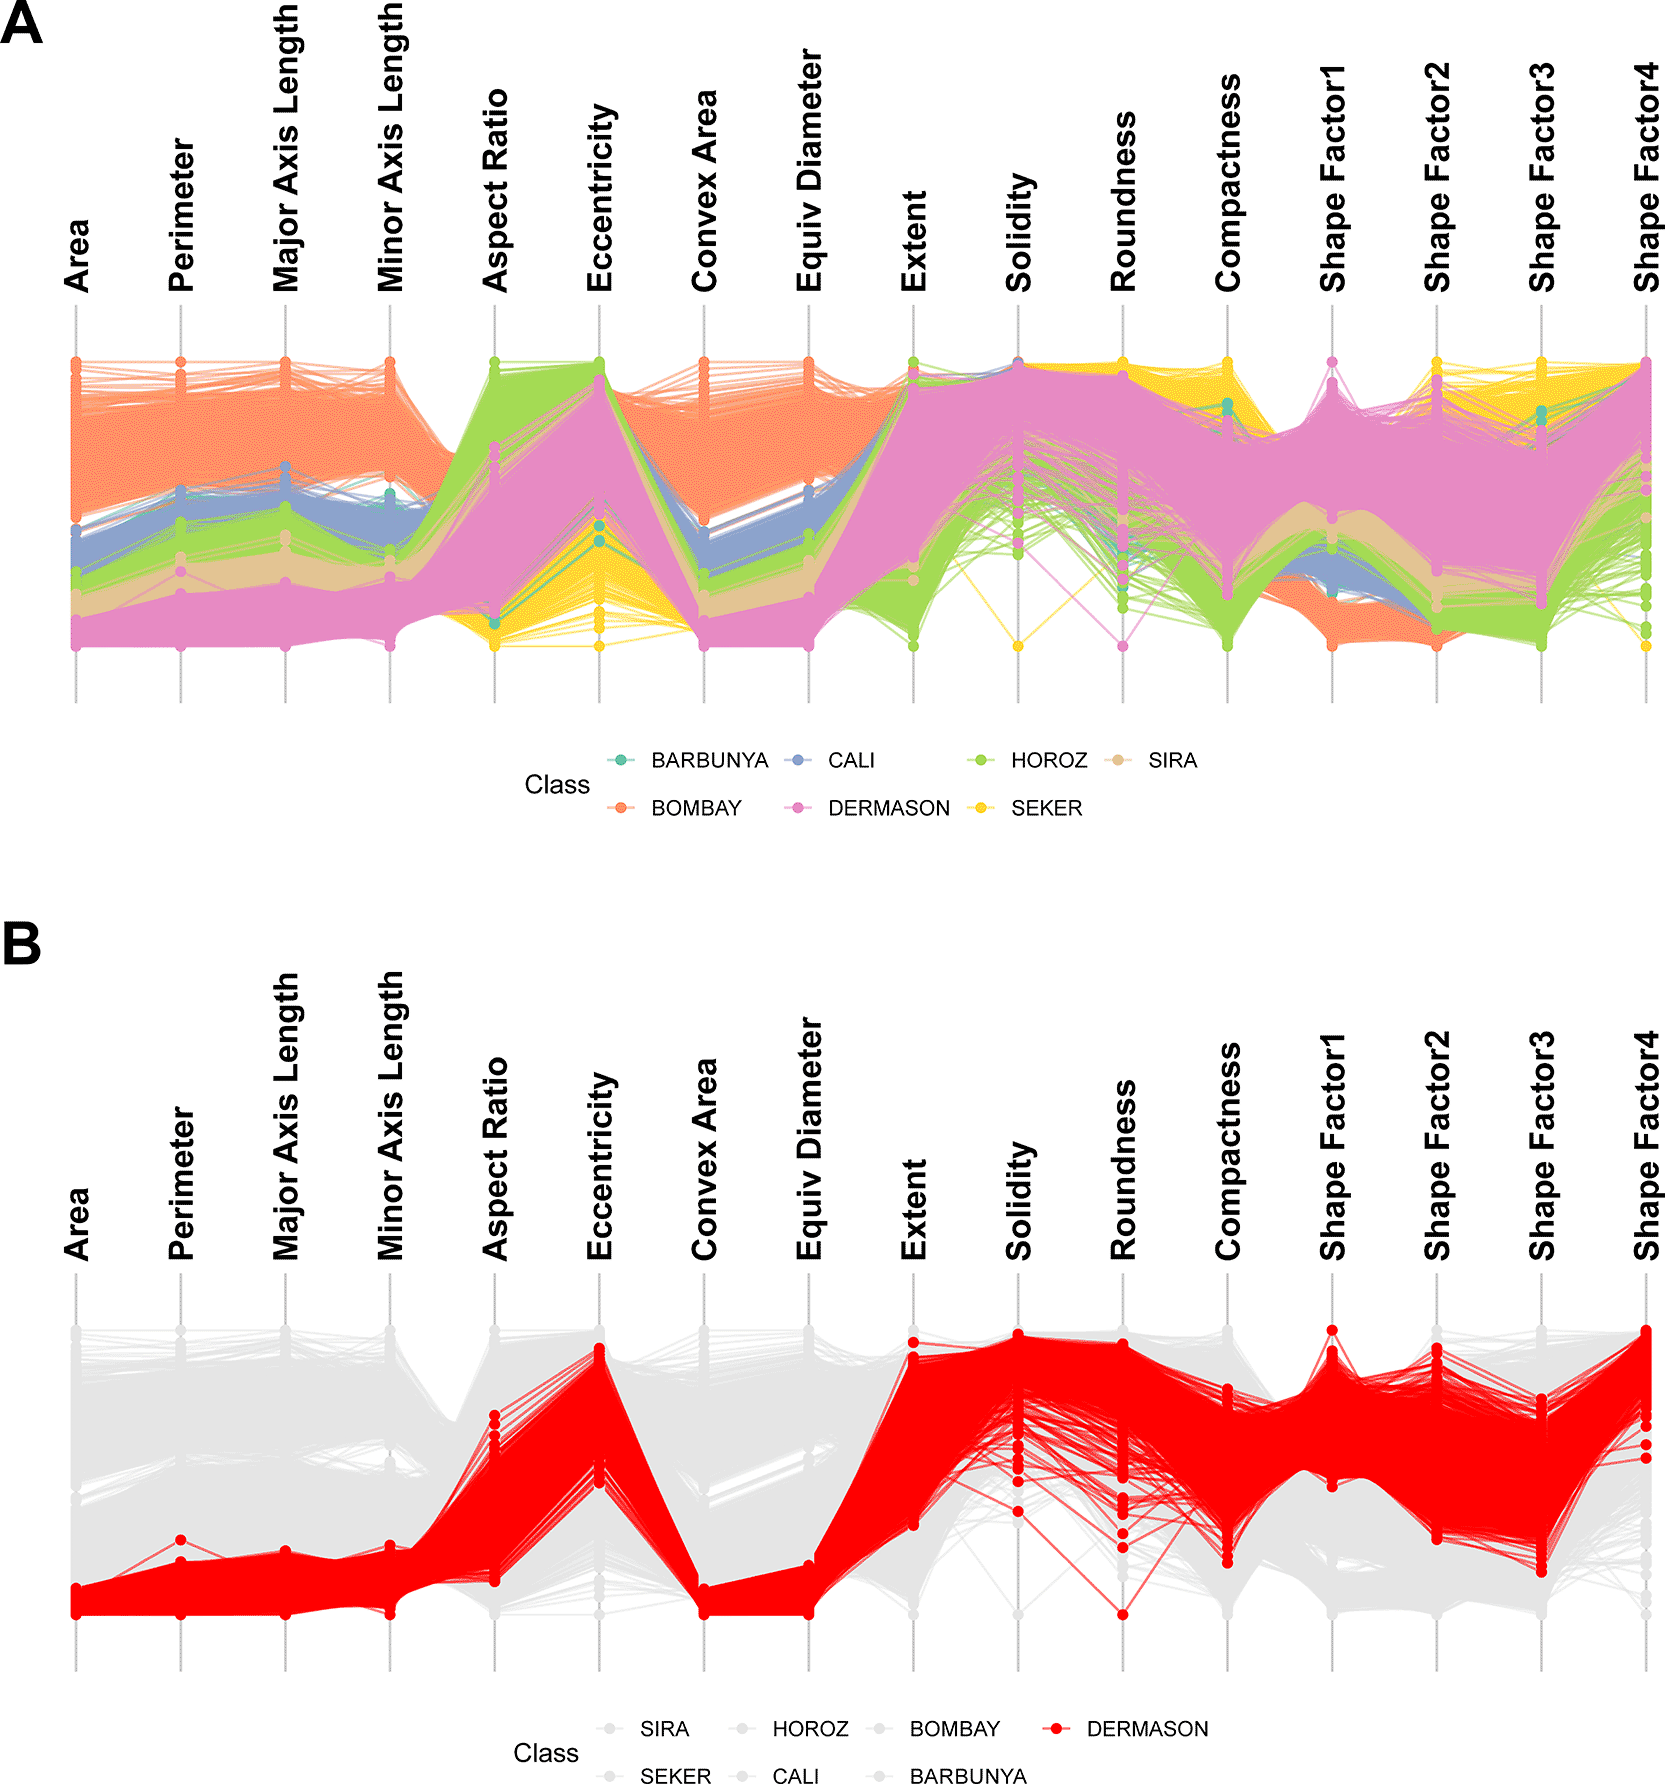
A) Visualising 16 morphological features of 13,611 grains from common dry bean species reveals clear correlations amongst size-related attributes (Area, Perimeter and Axis Length). Bombay beans were the largest, most convex variety; B) Highlighting a single subclass simplifies both comparison against the full cohort and identification of within-class outliers. For example, Dermason beans (red) are smaller in size than other varieties. One Dermason bean grain had unusually low roundness, highly atypical for this variety.
PCPs scale well with large datasets but have several limitations. Visualising the relationships between multiple categorical variables is challenging. Missing data is also difficult to meaningfully represent. For this reason, ggEDA introduces a complementary visualisation composed of vertically aligned tile and bar plots.
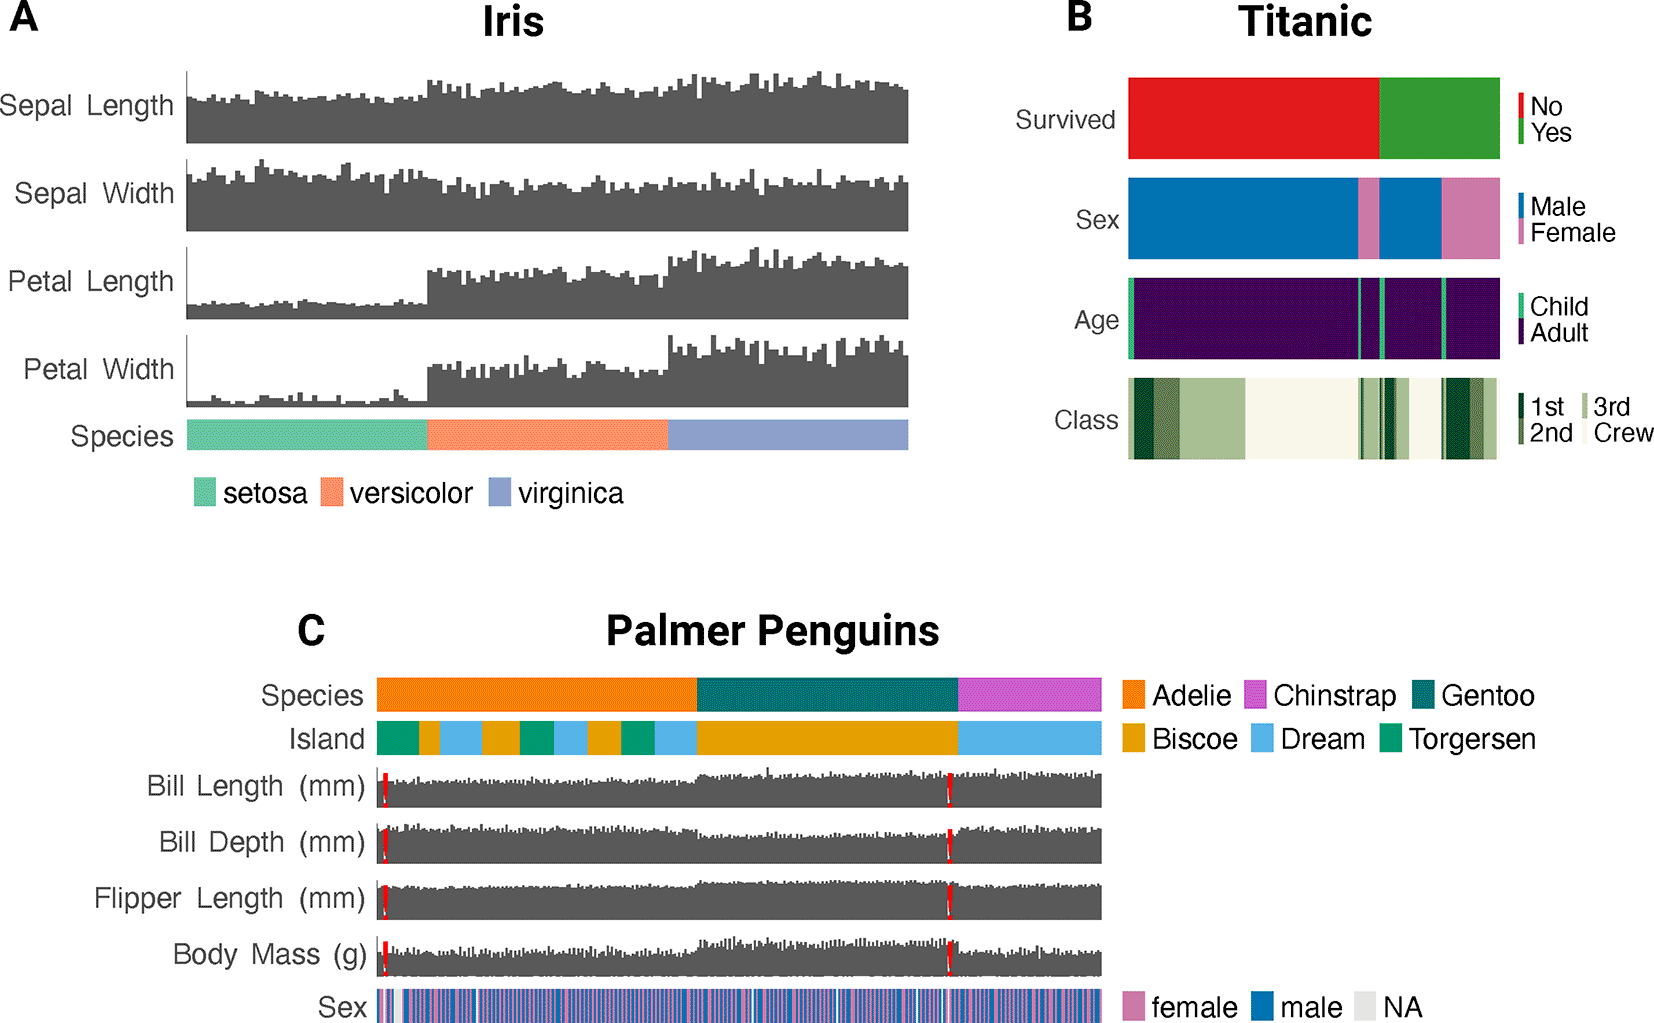
For small datasets (n < 1000), ggEDA can represent features as distinct, vertically aligned bar or tile plots, with plot types auto-selected based on whether variables are categorical or numeric ( Figure 3).
To demonstrate the advantages of ggEDA, we created the artificial Lazy Birdwatcher dataset. It describes magpie observations by two birdwatchers, one of whom routinely skips birdwatching on weekends. This introduces a missing data pattern dependent on both the birdwatcher and day of the week. The multidimensional pattern becomes immediately apparent from ggEDA stacked tile plots despite being difficult to detect using one-dimensional EDA tools like skimr, or two-dimensional tools like ggpairs from the GGally package ( Figure 4). Despite being n-dimensional, all PCP plot implementations in R also fail to uncover this trend due to either exclusion of missing data or inability to represent clearly the relationships between categorical features.
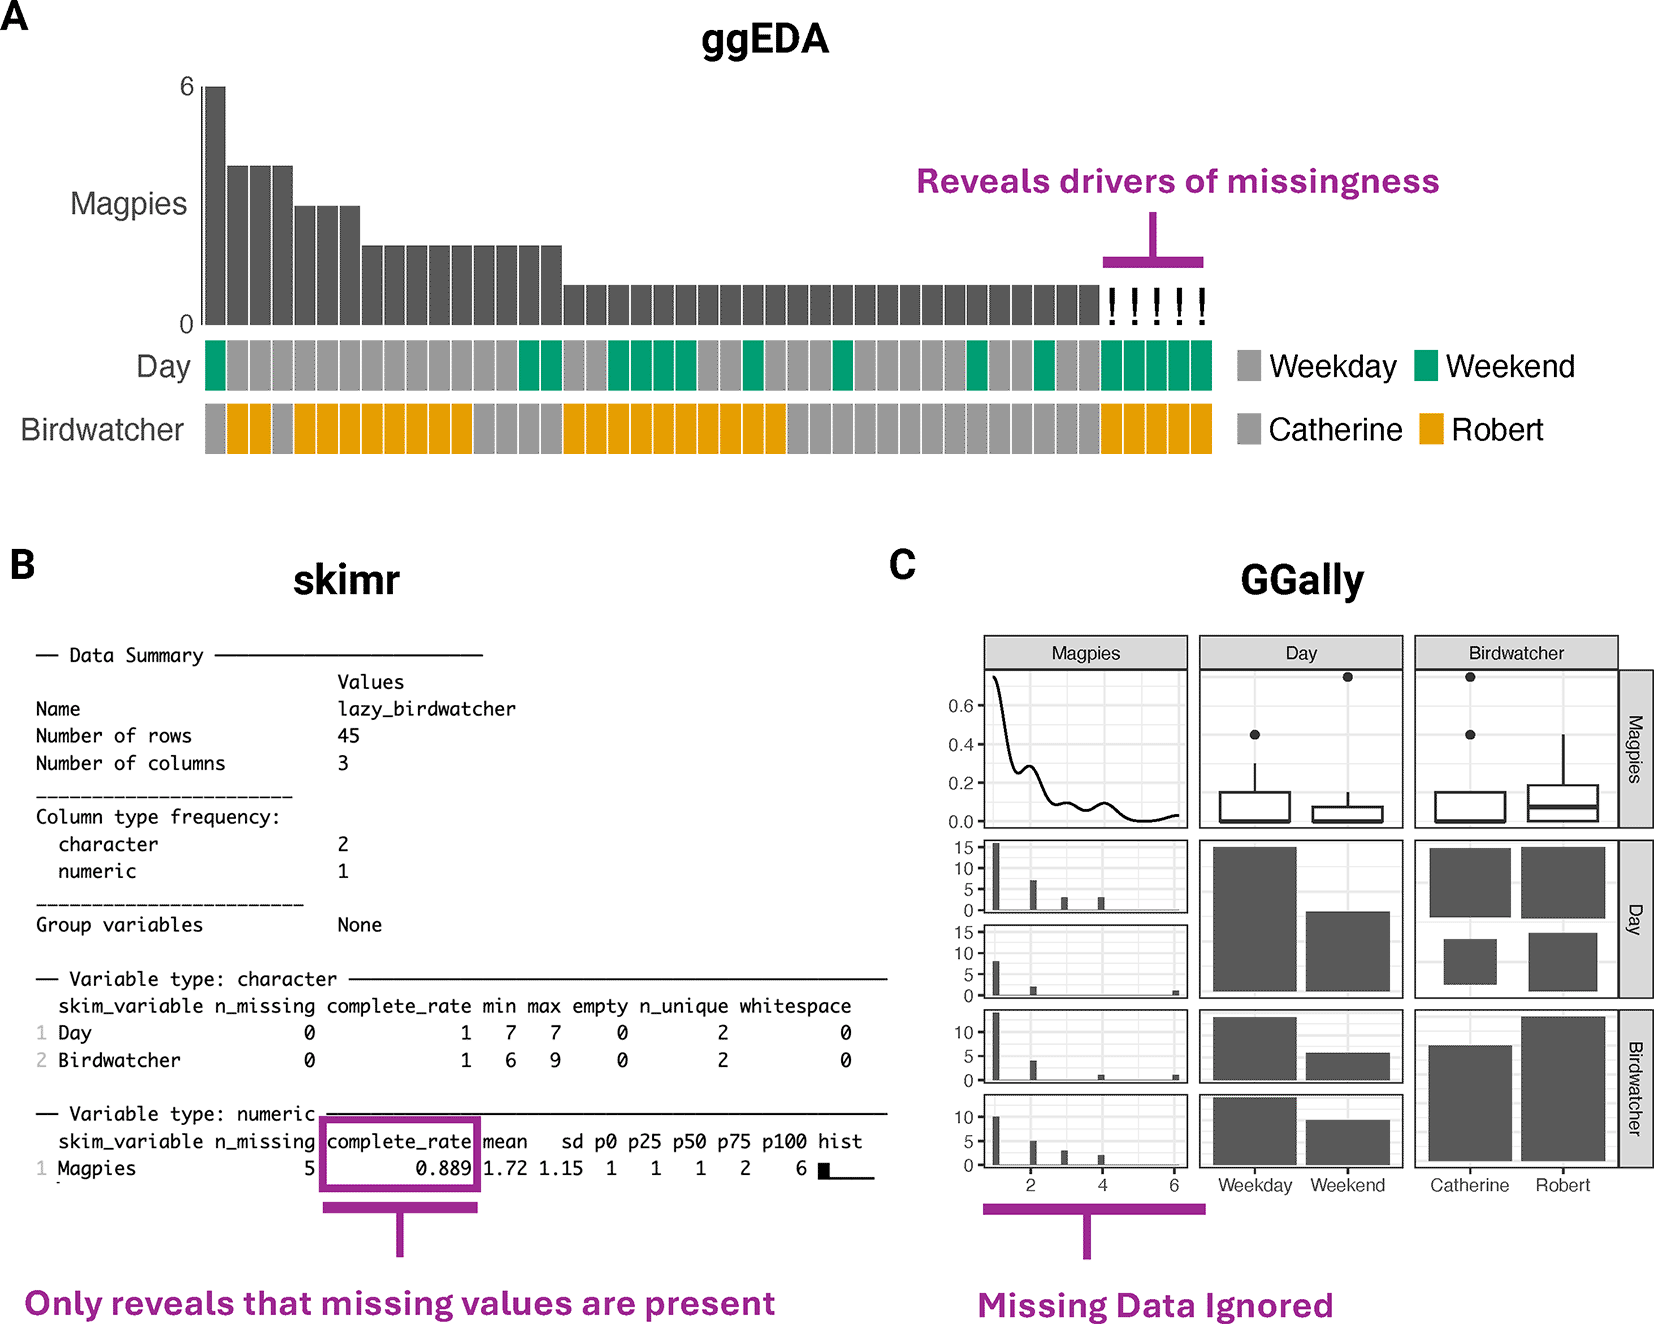
This pattern is difficult to detect using one-dimensional EDA tools like skimr (B) or two-dimensional tools like ggpairs from the GGally package (C).
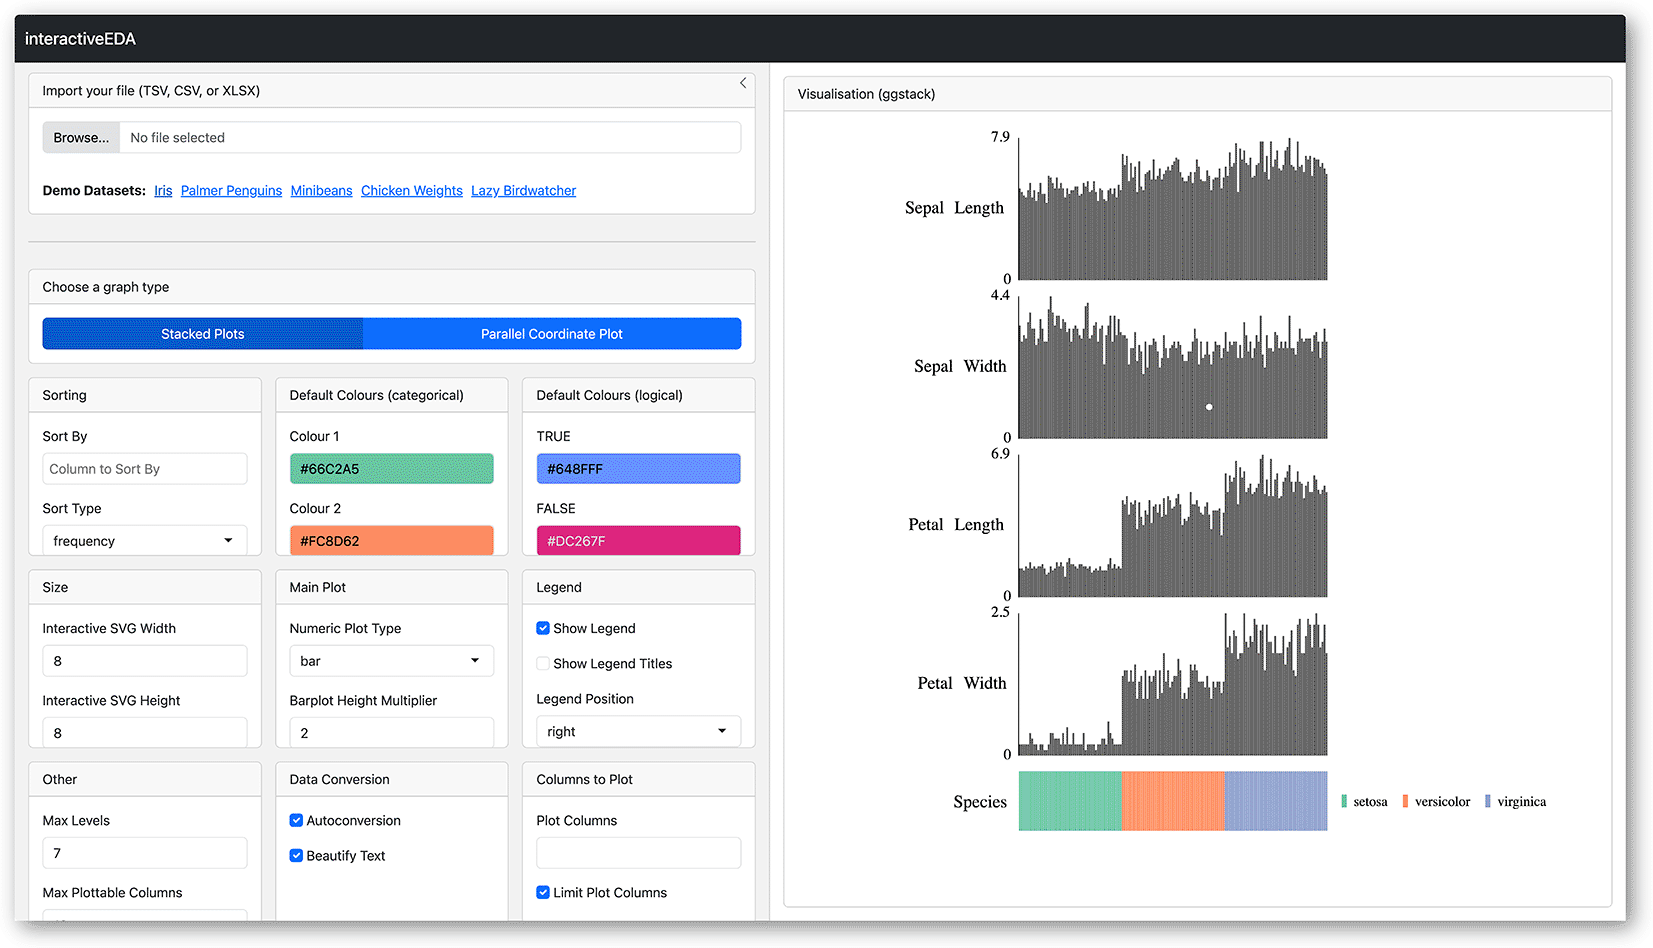
Despite the advancements provided by ggEDA and other tools in the R ecosystem, a key limitation remains: accessibility for non-programmers, particularly when visualising n-dimensional data. All existing R implementations lack graphical user interfaces ( Figure 1). While shiny web apps offer a potential solution, they often require uploading datasets to external servers, raising privacy concerns. To address these limitations, we developed interactiveEDA, a web-assembly compiled client-side web app for secure, interactive data exploration ( Figure 5). Operating entirely in the browser, interactiveEDA ensures data remains on the user’s machine, increasing ease of use without compromising data privacy. interactiveEDA is available at https://github.com/CCICB/interactiveEDA.
ggEDA provides two complementary visualisation strategies for exploratory data analysis: interactive parallel coordinate plots for high-dimensional quantitative data and tiled one-dimensional graphics for exploring missingness and categorical relationships in smaller datasets. These tools help uncover complex patterns and data quality issues with minimal coding. For users without programming experience, the same visualisations are available through the interactiveEDA web app.
ggEDA:
• Install using install.packages(“ggEDA”).
• Available from CRAN: https://cran.r-project.org/web/packages/ggEDA/
• Source code: https://github.com/CCICB/ggEDA
• Archived release: https://doi.org/10.5281/zenodo.17290896
• License: MIT
interactiveEDA:
• Available at: https://ccicb.github.io/interactiveEDA/
• Source code: https://github.com/CCICB/interactiveEDA
• Archived release: https://doi.org/10.5281/zenodo.17290912
• License: MIT
| Views | Downloads | |
|---|---|---|
| F1000Research | - | - |
|
PubMed Central
Data from PMC are received and updated monthly.
|
- | - |
Provide sufficient details of any financial or non-financial competing interests to enable users to assess whether your comments might lead a reasonable person to question your impartiality. Consider the following examples, but note that this is not an exhaustive list:
Sign up for content alerts and receive a weekly or monthly email with all newly published articles
Already registered? Sign in
The email address should be the one you originally registered with F1000.
You registered with F1000 via Google, so we cannot reset your password.
To sign in, please click here.
If you still need help with your Google account password, please click here.
You registered with F1000 via Facebook, so we cannot reset your password.
To sign in, please click here.
If you still need help with your Facebook account password, please click here.
If your email address is registered with us, we will email you instructions to reset your password.
If you think you should have received this email but it has not arrived, please check your spam filters and/or contact for further assistance.
Comments on this article Comments (0)