Keywords
EPR data, registry data, data quality, healthcare research, trusted research environment.
This article is included in the UCL Child Health gateway.
This article is included in the University College London collection.
This study aims to compare data availability and analytic results for patients using matched data items from a dedicated disease registry versus data extracted directly from an electronic patient record (EPR) system and a trusted research environment (TRE).
Data from patients enrolled in the National JDM Cohort and Biomarker Study (JDCBS) was compared with routine EPR data from the same patients attending a specialist children’s hospital between 2019-2021. Data from both sources were extracted, de-identified, and analysed within a trusted research environment adhering to NHS security standards. Descriptive statistics, visualizations, and statistical comparisons were performed.
Of the 688 registry patients in total, 270 attended one specialist hospital with EPR data available. The EPR system yielded 328,527 data points on these patients compared to 40,673 from the registry, including 2-10 fold more data items across data categories. Diagnoses were more numerous in the EPR data, while registry data captured more comprehensive medication records. Laboratory test results were 10 times more frequent in EPR data, including a broader range of test types. Despite higher data volume in EPR, the clinical significance of the additional data points remains uncertain.
Routine EPR data can effectively replicate much disease registry data with a larger volume of data points, potentially offering additional analytical possibilities. However, specific targeted registry data collection remains valuable for certain data elements. A hybrid approach, utilizing both routine EPR data and focused registry collection, could optimise healthcare research by reducing costs and avoiding duplication.
EPR data, registry data, data quality, healthcare research, trusted research environment.
Traditionally, research studies use specifically collected data since it has been reported that historically there may be quality issues with using routine EPR data and manual validation may be required at organisational level to make such data meaningful.1 Several dimensions of study data quality are generally described such as completeness, accuracy, concordance, plausibility, all of which have been variably applied to routine EPR data for research2 and corresponding EPR data quality assessment frameworks have been proposed.3,4
However, previous studies have reported the feasibility of using routine EPR data to determine quality of care in various settings, such congenital heart disease, with reasonable data availability, although reporting reduced reliability of billing codes for identification of certain specific conditions, especially those that may be rare.5 In addition, the use of routine EPR data to generate and populate disease-specific registries has been described (in this context, registries are regarded as list of patients and associated data items for individuals who either share a common diagnosis, procedure or treatment).6
Despite assumptions regarding EPR systems, published evidence suggests that data quality in studies using routine EPR data to be acceptable. In one study directly comparing quality of cancer registry data versus the same data derived directly (but manually extracted) from EPR systems, there was 95% concordance for most features including important elements such as primary site, laterality and histologic type.7 Another study directly compared manual and electronic data collection from a critical care EPR system and reported that the EPR derived data from over 241,000 patients undergoing more than 400,000 surgical procedures was good quality; for example, only around 1% had missing race/ethnicity data, all cases had an associated procedure code and 84% had outpatient medication recorded.8 In another study, data were extracted from specific fields from a sample of around 200 patients admitted to adult intensive care units, either via manual study specific collection or extracted directly from the EPR system; concordance was high with full agreement for 11/30 variables (35%) and median Kappa score for categorical variables of 0.99 (IQR 0.92-1.00). Interestingly, in this studies where discordancy was present, manual transcription errors were the most common source of discrepancies.9 Whilst routine extracted data therefore shows good scores for dimensions such as consistency, completeness, and uniqueness, there may be apparent ‘missing’ routine data, which is mainly related to the different levels of granularity required for secondary purposes compared to clinical coding.10 In addition, EPR data quality is often variable specific. For example, in a study of hypertension surveillance, blood pressure measurements and medications were well-recorded but other elements such as smoking or alcohol status were often missing or incomplete,11 hence the need for assessment of EPR data quality for specific purposes.12
Registry data is generally regarded as good quality. In a review of paediatric cardiac surgery registries using >50,000 data elements in around 500 subjects reported that only 3% of data elements were missing, with 98% accuracy of recording.13 However, it should be noted that even registries may have data quality issues. One retrospective chart review study of around 400 medical records from 14 hospitals compared to matched registry data reported only 80-90% accuracy for surgery type, chemotherapy and radiotherapy for a range of disorders, with accuracy related to the experience of those extracting the data.14
There is therefore recent interest in more widespread use of using routine EPR data for clinical trials and surveillance, partly since this approach would be cheaper and quicker than conducting dedicated trials and studies, but also since real-world effects can be estimated from such data, which may be important. A metanalysis of 84 studies using routine data and 463 traditional trials, reported that routine data studies demonstrate around 20% less favourable treatment effects compared to formal trials for the same conditions across a range of outcomes.15 The aim of this study is therefore to directly compare data availability and analytic results for the same patients using matched data items extracted from a dedicated existing registry versus data extracted directly from an EPR system and trusted research environment.
The National JDM Cohort and Biomarker Study (JDCBS) is a voluntary cohort study: at the time of analysis JDCBS included data from 688 patients over a 20 year period, for which patients and families consent to the storage and use of their data and biosamples for secondary medical research purposes.16 For the purposes of simplicity for the current analysis the JDCBS will simply be referred to as the ‘registry’ to distinguish this dataset from the EPR derived dataset from the same patients. Patients in the JDCBS attending GOSH were identified and data extracted into a secure data environment (GOSH DRE). Routine EPR data from the same patients were also directly extracted from the EPR system (Epic), linked and all data deidentified and stored in the secure data environment for analysis. The GOSH DRE is a trusted research environment (TRE) meeting NHS security and ICT standards including ISO27001 and ISO27010 and the architecture and routine deidentified extracted EPR data an HRA REC approved research database.
Data was extracted and provisioned by the GOSH data steward team and only the non-identifiable linked data made available through a secure workspace for subsequent analysis by the research team using R. Descriptive statistics and visualisations were carried out on both datasets and statistical comparison performed by comparison of proportions and Mann-Whitney U tests as appropriate for discrete and continuous variables.
Of a total of 688 patients registered overall in JCDBS there were 286 patients who had been managed at GOSH of whom EPR data from the study period 2019-2021 inclusive was available for 270. Total data points available for these patients for the categories of laboratory test results, medications, diagnoses and visits were 40,673 in the registry and 328,527 from EPR, 8-fold more data items over the same period. The data volumes varied by data type but 2-10 fold more data items were available for the same categories using routine extracted EPR data ( Table 1).
| Characteristic | JDCBS | DRE |
|---|---|---|
| Laboratory tests | 27464 | 284150 |
| Medications | 9532 | 34868 |
| Diagnoses | 268 | 2772 |
| Visits | 3409 | 6777 |
For some categories, such as Diagnoses, there were significantly more diagnoses recorded from the routine EPR data versus registry data, but this is likely a result of only targeted registry data collection in addition to the recording of many non-specific ‘diagnoses’ within EPR coded data ( Table 2/ Figure 1).
| Patients | DRE (N=270) | JDCBS (N=286) |
|---|---|---|
| Total diagnoses (N) | ||
| Minimum | 0 | 0 |
| Median (IQR) | 6 (3-14) | 1 (1-1) |
| Mean (SD) | 10.27±12.01 | 0.94±0.24 |
| Maximum | 68 | 1 |
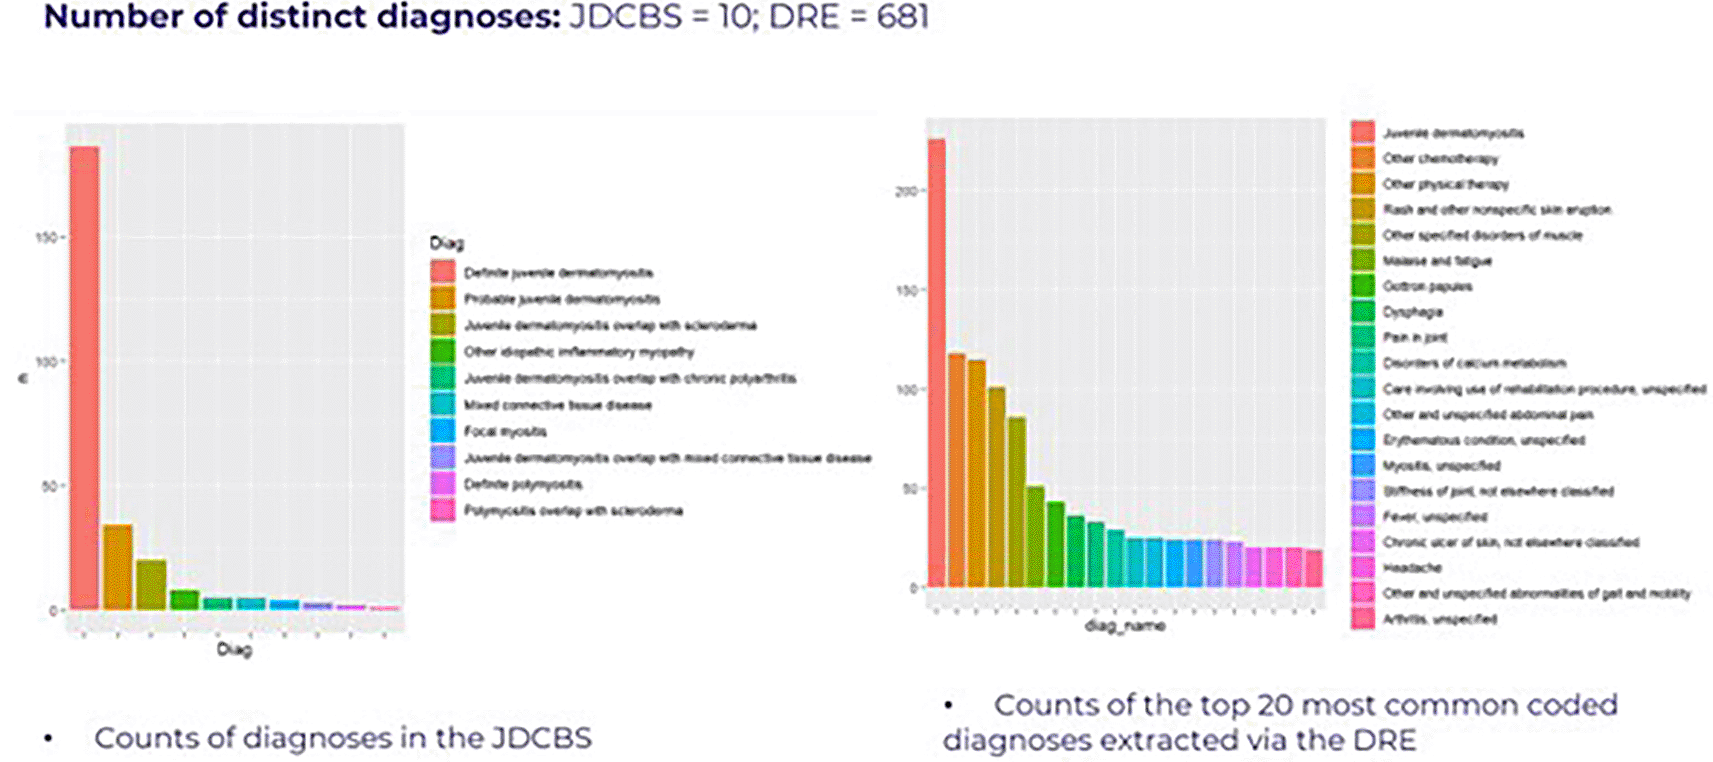
The number of distinct diagnoses recorded from routine EPR data is more than 50x greater than number of diagnoses recorded in the registry. However, examination of the most common diagnoses provided in each demonstrate that registry diagnoses only include those high-level diagnoses directly related to the primary medical condition, whereas EPR data additionally includes comorbidities and other conditions.
In contrast, the median number of medications recorded per patient is less in the routine DRE data compared to registry data (median 16 versus median 26 respectively), likely explained by the fact that GOSH EPR data only includes medications prescribed by the hospital whereas registry data may have included all medications used regardless of whether prescribed in other hospitals or primary care as well as GOSH ( Table 3).
| DRE (N=270) | JCDBS (N=286) | |
|---|---|---|
| Total medications | ||
| Minimum | 0 | 0 |
| Median (IQR) | 16.00 (0.00, 99.50) | 26.00 (8.00, 49.00) |
| Mean (SD) | 129.14 (±477.70) | 33.33 (±30.96) |
| Maximum | 7200 | 178 |
The category with the greatest fold difference in data items was however, laboratory testing, with 10-fold more laboratory test results available per patient in the EPR derived dataset compare to the registry data, likely a consequence of recording of only selected laboratory tests within the registry ( Table 4).
| DRE (N=270) | JDCBS (N=286) | |
|---|---|---|
| Total laboratory tests | ||
| Minimum | 0 | 0 |
| Median (IQR) | 830 (432-1364) | 74 (21-152) |
| Mean (SD) | 1052.4±875.0 | 96.0±89.4 |
| Maximum | 5911 | 523 |
Further examination of the JDCBS and EPR DRE data laboratory test result types demonstrates a broadly similar pattern of testing with a marked predominance of repeated standard tests, specifically tests such as full blood count ( Figure 2). However, the overall number of distinct laboratory tests recorded in the registry was 34 compared to >1300 laboratory test types overall in routine data, likely a consequence of registry data collection of only specific predefined tests ( Figure 3).
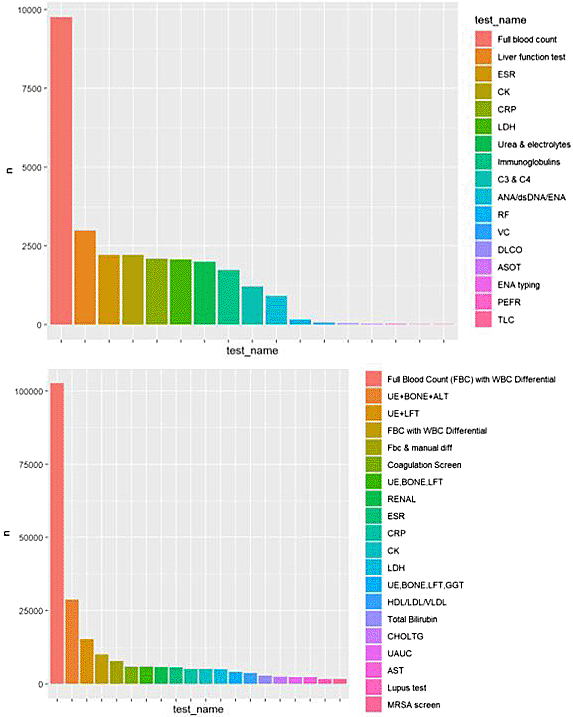
The 20 most common laboratory test types available in the JCDBS registry (Top) and the RPR DRE data (Bottom) are provided, demonstrating broadly similar patterns of relative test frequencies despite around 10-fold more test results available through the EPR data.
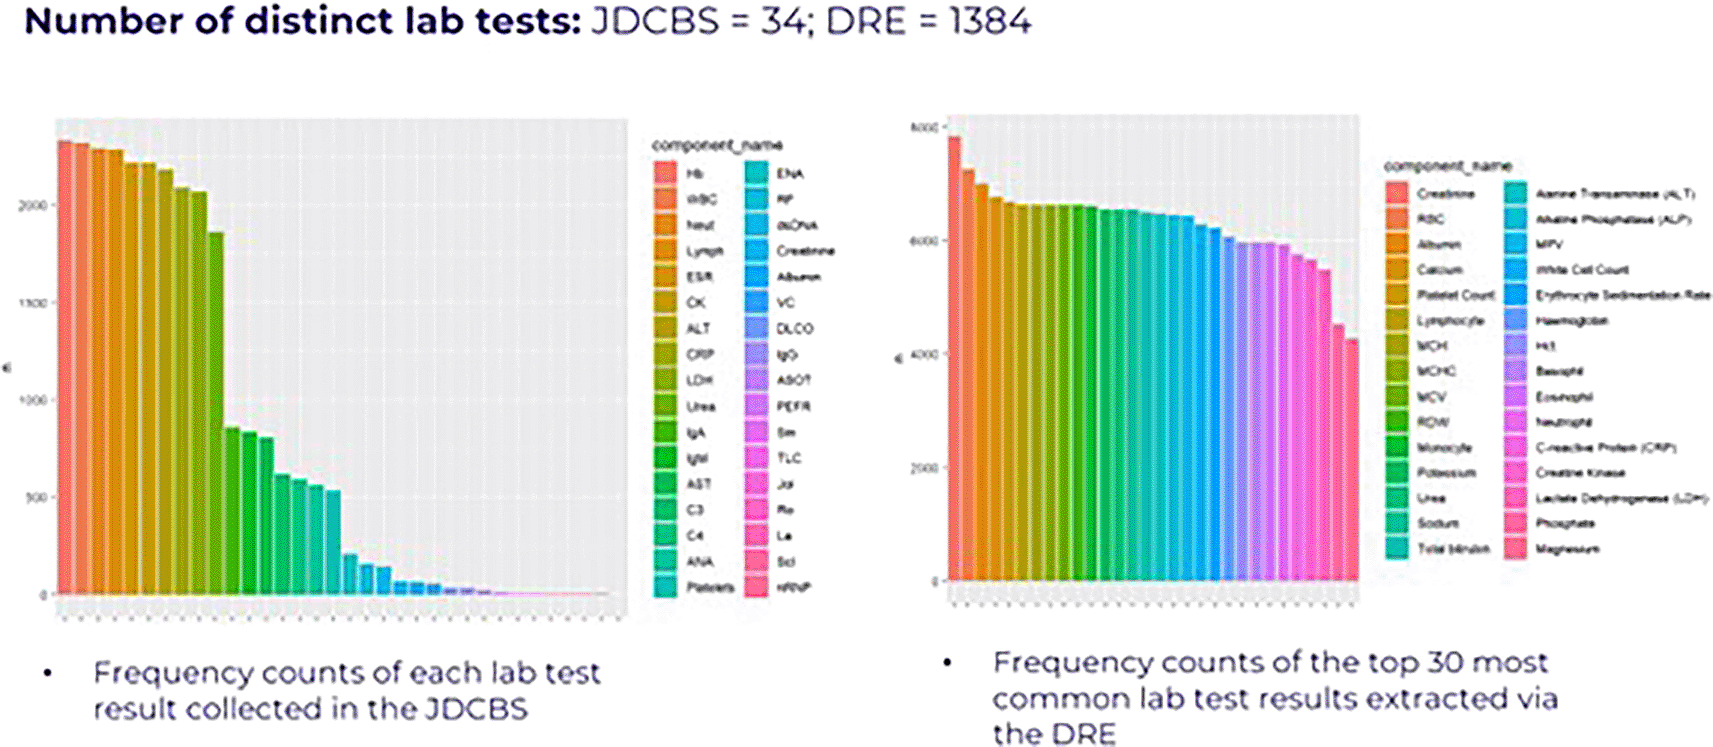
For test types present in both datasets, significantly more values were available from the routine EPR DRE data, resulting in small differences in overall result distributions of uncertain clinical significance ( Figure 4).
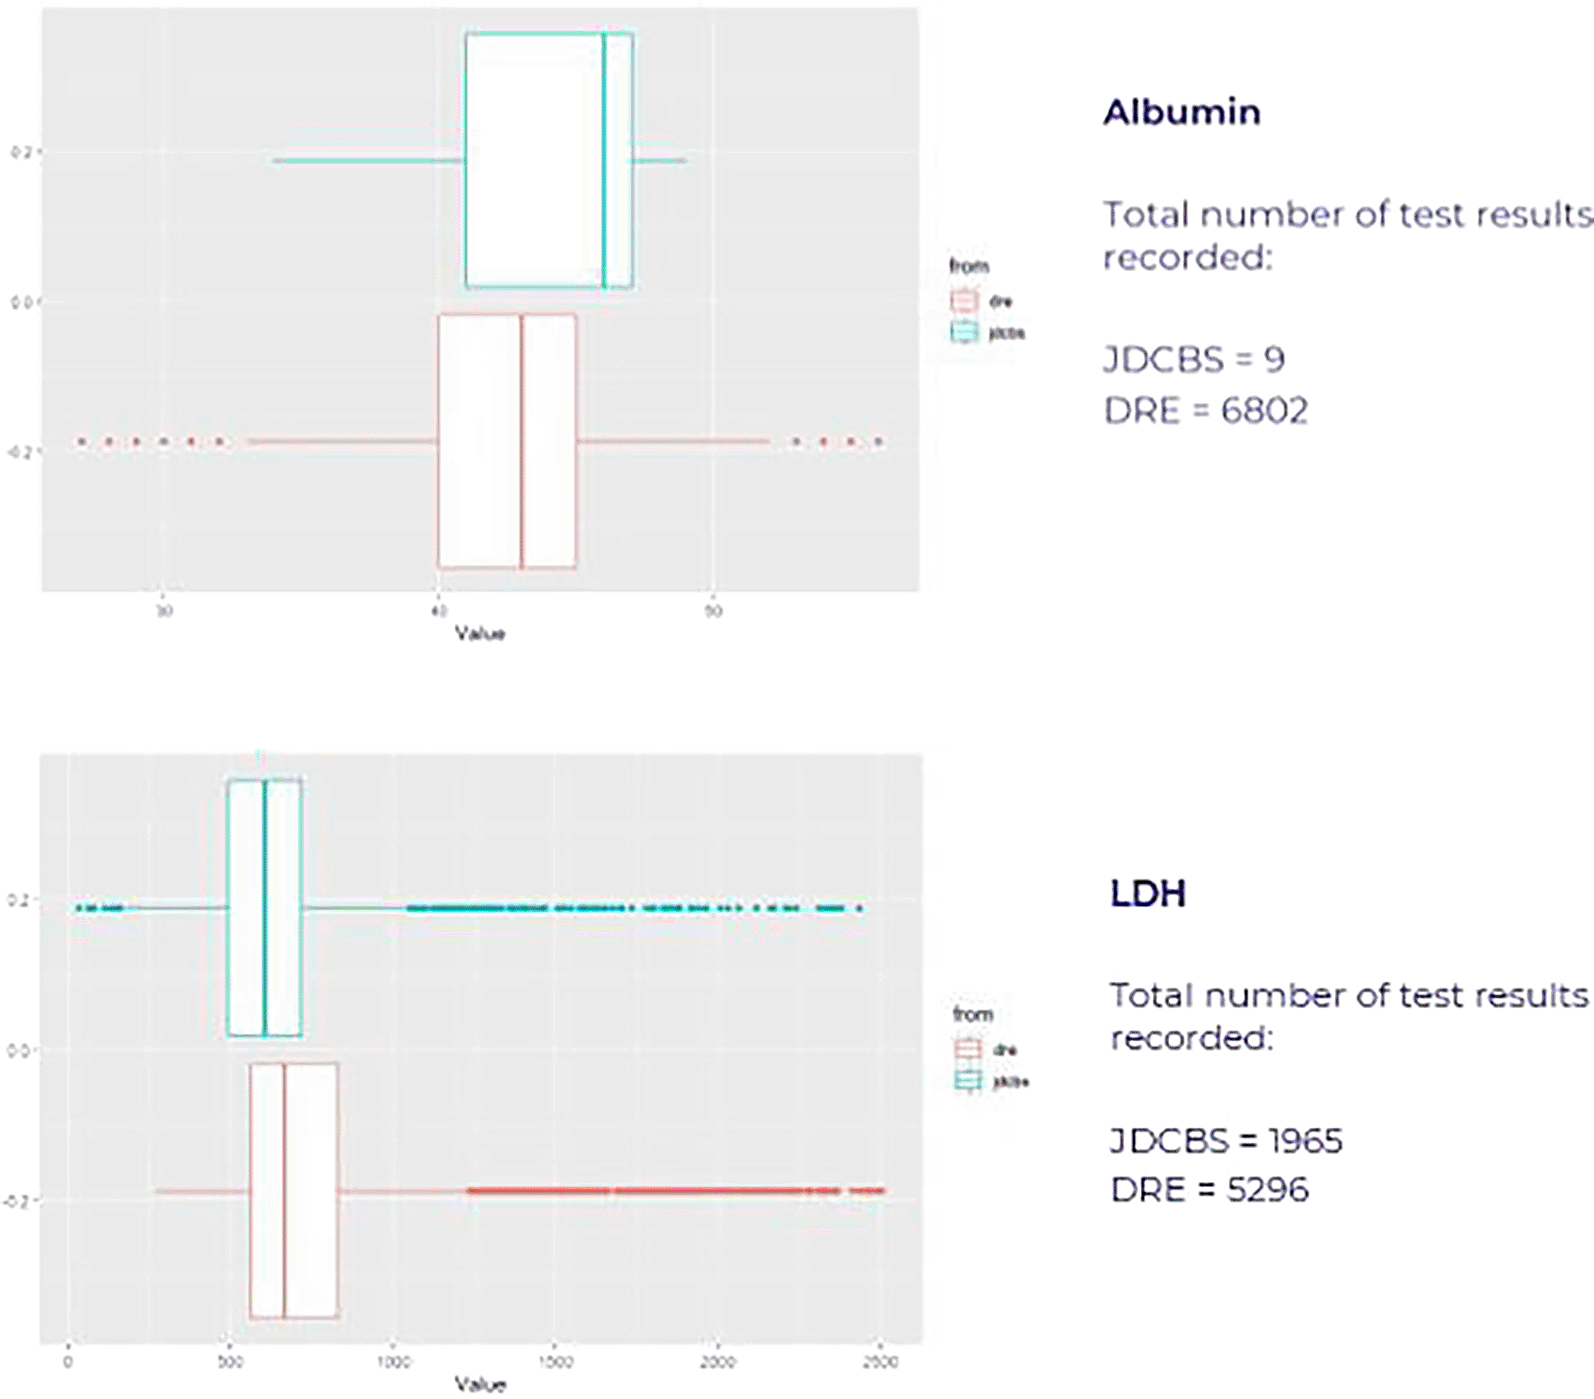
Box whisker plots illustrating median, IQR and ranges for serum albumin (top) and serum LDH (bottom) from both datasets showing small differences in distribution of values.
However, the presence of magnitudes greater data items in the EPR DRE data allows potential additional analysis types to be carried out. For example, there is a relationship between the total number of laboratory tests performed and total number of EPR diagnoses recorded per patient ( Figure 5).
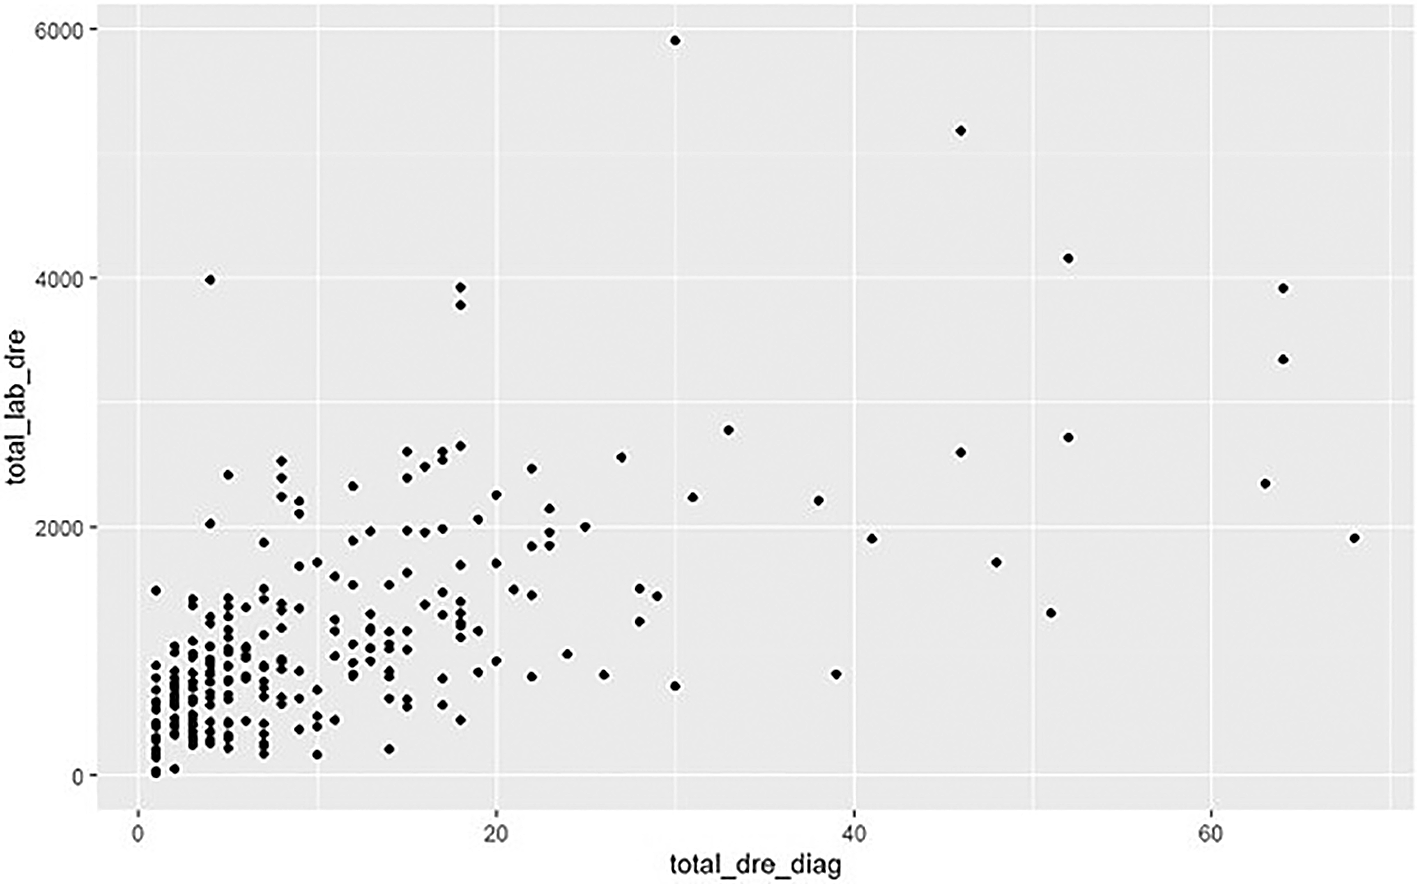
Using EPR DRE data per patient.
Finally, since registry data only includes selected attendances, the average number of outpatient visits recorded is more than twice as many per patient from routine EPR data as from the registry ( Table 5).
The findings of this study have demonstrated that, firstly, it is possible to use extracted routine electronic health record data to generate a dataset that recapitulated many aspects of data found in a dedicated registry. Second, there are orders of magnitude more data points available from use of routine EPR data, including data elements which may be of interest or use but were not initially considered or appreciated when setting up the registry, especially for elements such as laboratory test results. Third, use of all data points, such as from all laboratory tests performed may demonstrate small but significant differences in test result distributions indicating that registry data may not represent unselected routine clinical data, although, in general, distributions were similar and any differences of uncertain significance. Fourth, additional analyses may be possible using more extensive routine EPR data due to ease of linkage regarding time points and data point interrelationships.
However, despite the additional volume of data available from routine EPR extractions, it remains uncertain whether this provides significant additional clinical or research insight, since the most common data items are repeat testing of common standard tests and it is likely that only a minority of test results are contributory to diagnosis and management. Finally, it should be recognised that only specific pre-defined data elements are collected in registries, often with well-described data dictionaries, whereas routine EPR derived data includes all items but is dependent on clinical data entry and coding; this is most apparent in the ‘diagnoses’ section, which in registry data is confined to the main underlying JDM related diagnosis but in the routine EPR dataset additionally includes a wide range of associated or incidental diagnoses and non-specific symptoms.
The findings do, however, indicate that significant effort and cost may potentially be avoided by more widespread use of routine extracted EPR data to support, augment or replace dedicated disease-specific registries, since comparative analysis suggests that findings from both dataset types are broadly similar. However, there are differences in several aspects, such as hospital visits, medications and laboratory tests indicating that both approaches may be optimal for particular circumstances. Therefore, optimal healthcare research should begin to question the routine setting up of registries to duplicate data held in EPR systems and that significant resource savings could be achieved by using routine EPR data wherever possible, but enhanced by highly targeted registry collection for specific data elements, thus a customised hybrid approach to achieve maximum benefit.
It should be emphasised that the findings presented in the present study are based on routinely extracted EPR data from a single centre, which already has an established digital research environment and underlying processes and architecture for large scale extraction, deidentification and harmonisation of electronic patient record data elements. The disease registry, in contrast, collects data from many different centres, each of whom may have different electronic patient record systems, and markedly different levels of digital and data maturity. Therefore, scaling the approach of extracting and collating or mapping similar data from multiple different organisations’ clinical systems adds significant complexity with aspects such as data harmonisation, ontology mapping and unification of formatting, all of which are essentially avoided by manual entry into a research data capture tool associated with a registry. The disadvantage of this approach is that such registries requires both initial setup and ongoing management resources with additional potential transcription and data entry errors, as well as intrinsic limitations to the extent of data collection since there is a human resource burden directly proportional to the number of participants and number of data elements. It is hoped that future developments towards unifying healthcare data specifications for interoperability, such as HL7 FHIRv4 may significantly reduce the complexity of multicentre data harmonisation for such use cases, but at present few clinical systems support such tools or APIs beyond basic functionality.
In this rare disease example (juvenile onset dermatomyositis, annual incidence 2-3 per million children per year),17 collection from many centres has a clear benefit to research to power studies adequately and enable cross centre comparison of outcomes and practice. In addition, the agreement of an internationally agreed data set for research and clinical use in this condition has facilitated comparisons of registries across countries.18 In the future it would therefore be feasible to standardise the elements recorded in the EPR specific to this condition and then use routinely extracted, large datasets for research. This might provide significant savings of time and duplicated effort to the research community, enable a wider range of data elements to be incorporated into high dimensional modelling or disease outcome and so lead to significant benefit for patients.
The study was approved by the appropriate REC (for JDM data: REC 01/3/022 20/03/2023 and specific analysis was approved by the JDCBS Study Steering Committee with all patients having provided written consent for the use of their data in research; use of EPR data for research through the GOSH SDE is approved under REC REC reference: 21/LO/0646), 13/10/2021).
The Juvenile Dermatomyositis Cohort Biomarker Study & Repository (JDCBS) would like to thank all of the patients and their families who contributed to the JDCBS research study. We thank all local research coordinators and principal investigators who have made this research possible. Clinical, research and administrative contributors to JDCBS members were as follows:
Dr Kate Armon, and Ms Louise Coke, Ms Julie Cook and Ms Amy Nichols (Norfolk and Norwich University Hospitals);Dr Liza McCann, Mr Ian Roberts, Dr Eileen Baildam, Ms Louise Hanna, Ms Olivia Lloyd, Susan Wadeson, Ms Michelle Andrews, Ms Olivia Lloyd and Mrs Jane Roach (The Royal Liverpool Children’s Hospital, Alder Hey, Liverpool); Dr Phil Riley, Ms Ann McGovern, and Ms Verna Cuthbert (Royal Manchester Children’s Hospital, Manchester); Dr Clive Ryder, Ms Janis Scott, Ms Beverley Thomas, Professor Taunton Southwood, Dr Eslam Al-Abadi and Ms Ruth Howman (Birmingham Children’s Hospital, Birmingham); Dr Sue Wyatt, Mrs Gillian Jackson, Dr Mark Wood, Dr Tania Amin, Dr Vanessa VanRooyen, Ms Deborah Burton, Ms Louise Turner, Ms Heather Rostron, and Ms Sarah Hanson (Leeds General Infirmary, Leeds); Dr Joyce Davidson, Dr Janet Gardner-Medwin, Dr Neil Martin, Ms Sue Ferguson, Ms Liz Waxman and Mr Michael Browne, Ms Roisin Boyle, Ms Emily Blyth and Ms Susanne Cathcart (The Royal Hospital for Sick Children, Yorkhill, Glasgow); Dr Mark Friswell, Professor Helen Foster, Ms Alison Swift, Dr Sharmila Jandial, Ms Vicky Stevenson, Ms Debbie Wade, Dr Ethan Sen, Dr Eve Smith, Ms Lisa Qiao, Mr Stuart Watson and Ms Claire Duong, Dr Stephen Crulley, Mr Andrew Davies, Miss Caroline Miller, Ms Lynne Bell, Dr Flora McErlane, Dr Sunil Sampath, Dr Josh Bennet, Mrs Sharon King and Mr Christopher Long (Great North Children’s Hospital, Newcastle); Dr Helen Venning, Dr Rangaraj Satyapal, Mrs Elizabeth Stretton, Ms Mary Jordan, Dr Ellen Mosley, Ms Anna Frost, Ms Lindsay Crate, Dr Kishore Warrier, Ms Stefanie Stafford, Mrs Brogan Wrest, Ms Chia-Ping Chou, and Mr Paul Pryce (Queens Medical Centre, Nottingham); Professor Lucy Wedderburn, Dr Clarissa Pilkington, Dr Nathan Hasson, Dr Muthana Al-Obadi, Dr Giulia Varnier, Dr Sandrine Lacassagne, Ms Sue Maillard, Mrs Lauren Stone, Ms Elizabeth Halkon, Ms Virginia Brown, Ms Audrey Juggins, Dr Sally Smith, Ms Sian Lunt, Ms Elli Enayat, Ms Hemlata Varsani, Ms Laura Kassoumeri, Miss Laura Beard, Ms Katie Arnold, Mrs Yvonne Glackin, Ms Stephanie Simou, Dr Beverley Almeida, Dr Kiran Nistala, Dr Raquel Marques, Dr Claire Deakin, Dr Parichat Khaosut, Ms Stefanie Dowle, Dr Charalampia Papadopoulou, Dr Shireena Yasin, Dr Christina Boros, Dr Meredyth Wilkinson, Dr Chris Piper, Ms Cerise Johnson-Moore, Ms Lucy Marshall, Ms Kathryn O’Brien, Ms Emily Robinson, Mr Dominic Igbelina, Dr Polly Livermore, Dr Socrates Varakliotis, Ms Rosie Hamilton, Ms Lucy Nguyen, Mr Dario Cancemi, Dr Ovgu Kul Cinar, Dr Elena Moraitis and Dr Hannah Peckham (Great Ormond Street Hospital, London); Dr Kevin Murray (Princess Margaret Hospital, Perth, Western Australia); Dr Coziana Ciurtin, Dr John Ioannou, Mrs Caitlin Clifford, Ms Linda Suffield and Ms Laura Hennelly (University College London Hospital, London); Ms Helen Lee, Ms Sam Leach, Ms Helen Smith, Dr Anne-Marie McMahon, Ms Heather Chisem, Ms Jeanette Hall and Ms Amy Huffenberger (Sheffield’s Children’s Hospital, Sheffield); Dr Nick Wilkinson, Ms Emma Inness, Ms Eunice Kendall, Mr David Mayers, Ms Ruth Etherton, Ms Danielle Miller and Dr Kathryn Bailey (Oxford University Hospitals, Oxford); Dr Jacqui Clinch, Ms Natalie Fineman, Ms Helen Pluess-Hall, Ms Suzanne Sketchley, Ms Melanie Marsh, Ms Anna Fry, Ms Maisy Dawkins-Lloyd and Ms Mashal Asif (Bristol Royal Hospital for Children, Bristol); Dr Joyce Davidson, Margaret Connon and Ms Lindsay Vallance (Royal Aberdeen Children’s Hospital); Dr Kirsty Haslam, Ms Charlene Bass-Woodcock, Ms Trudy Booth, and Ms Louise Akeroyd (Bradford Teaching Hospitals); Dr Alice Leahy, Amy Collier, Rebecca Cutts, Emma Macleod, Dr Hans De Graaf, Dr Brian Davidson, Sarah Hartfree, Ms Elizabeth Fofana and Ms Lorena Caruana (University Hospital Southampton) and all the Children, Young people and their families who have contributed to this research.
| Views | Downloads | |
|---|---|---|
| F1000Research | - | - |
|
PubMed Central
Data from PMC are received and updated monthly.
|
- | - |
Provide sufficient details of any financial or non-financial competing interests to enable users to assess whether your comments might lead a reasonable person to question your impartiality. Consider the following examples, but note that this is not an exhaustive list:
Sign up for content alerts and receive a weekly or monthly email with all newly published articles
Already registered? Sign in
The email address should be the one you originally registered with F1000.
You registered with F1000 via Google, so we cannot reset your password.
To sign in, please click here.
If you still need help with your Google account password, please click here.
You registered with F1000 via Facebook, so we cannot reset your password.
To sign in, please click here.
If you still need help with your Facebook account password, please click here.
If your email address is registered with us, we will email you instructions to reset your password.
If you think you should have received this email but it has not arrived, please check your spam filters and/or contact for further assistance.
Comments on this article Comments (0)