Keywords
Computer vision, Database, Experimental setup, Infrared thermography, Radiofrequency heating, RF-material interactions, Super-resolution, Thermal imaging
Computer vision, Database, Experimental setup, Infrared thermography, Radiofrequency heating, RF-material interactions, Super-resolution, Thermal imaging
In the new version we organized the images. Although they were the same, their dimensions were not optimal, so this was corrected.
Skin cancer is one of the most common types of cancer worldwide, with melanoma being one of the most severe and recurring forms. Its incidence continues to rise globally due to increased UV exposure and aging populations. Over the past decades, hyperthermia—the controlled elevation of tissue temperature within the therapeutic range of 40°C to 45°C has been intensively studied as an adjuvant treatment to improve the efficacy of radiotherapy and chemotherapy, particularly in superficial malignant tumors. Early clinical studies demonstrated enhanced tumor control and survival rates when local microwave hyperthermia was combined with conventional therapies.1–4 Following these pioneering efforts, radiofrequency (RF) and microwave-based systems evolved from proof-of-concept applicators into clinically optimized devices capable of delivering spatially controlled and selective heating.3,5 Subsequent research refined applicator geometries and coupling mechanisms for superficial lesions, demonstrating the potential of RF delivery to selectively target melanoma tissue in vivo. While RF heating proved to be an effective biomedical technique, these studies also highlighted the need for accurate thermal dosimetry, reproducible temperature control, and standardized validation protocols, all of which remain essential for translating hyperthermia into reliable clinical practice.6,7
Modern approaches to hyperthermia now encompass a wide range of energy delivery mechanisms, such as capacitive heating,8 microwaves,2,4 ultrasound,9 and magnetic nanoparticles,10,11 each relying on distinct physical mechanisms for localized temperature elevation. For example, Xie et al. created injectable alginate gels containing magnetic particles, exhibiting efficient magnetic hyperthermia with high biocompatibility.12 Similarly, Maamoun et al. found that inserting metal nanoparticles in liver tissue increases microwave absorption and allows for selective heating at 915 MHz without collateral damage.10 Despite these advancements, the scarcity of comprehensive, high-quality thermal data continues to limit the accuracy of thermal dosimetry and the reproducibility of experimental temperature mapping. The controlled assessment of how biological and inert materials absorb and dissipate RF radiation under various conditions remains unexplored, yet it is critical for verifying electromagnetic-thermal models. Furthermore, as materials exhibit very different thermal responses to RF radiation exposure, modern hyperthermia systems increasingly rely on closed-loop control architectures to be safer.
Thus, complementary research has focused on the validation and control of thermal administration.9,13–16 in vivo and phantom studies have incorporated sensors and imaging methods to map temperature fields with increasing spatial accuracy. For example, Gaffoglio et al. proposed a real-time 3D temperature reconstruction framework for microwave hyperthermia, combining sparse invasive measurements with multiphysics simulations to achieve sub-degree accuracy in computational and phantom experiments.17 In a complementary direction, Han and collaborators integrated ultrasound imaging with deep neural architectures for non-invasive temperature monitoring, validating their approach on ex vivo porcine tissue exposed to microwave-induced heating.9 Lestini et al. developed a “smart skin” based on passive UHF RFID sensors for distributed temperature monitoring during superficial microwave hyperthermia, achieving high concordance with conventional thermocouples and minimal electromagnetic interference.16 Similarly, Muratoglu et al. compared computer simulations and experimental results in split phantoms exposed to capacitive hyperthermia, confirming the sensitivity of heating patterns to dielectric composition and layer thickness.8 Beyond RF-based sensing, infrared (IR) thermography has been studied as a non-invasive tool for detecting thermal anomalies in the human body, including those associated with malignant tumors.18–20 Recent studies have applied this principle to breast cancer screening and diagnosis, leveraging high-resolution thermal cameras and deep learning algorithms to distinguish benign from malignant patterns. Rodríguez Guerrero et al. released a curated breast thermography dataset designed to support the development and validation of deep learning algorithms for differentiating benign and malignant cases.18
Despite these advances, medical thermography faces significant challenges such as physiological variability among patients, tumor depth (thermal abnormalities may be attenuated at the surface), and the lack of consistent standards for acquisition. Consequently, many published studies rely on relatively small datasets, non standardized protocols, and limited guarantees of reproducibility, which hinder the widespread clinical deployment. A recent review of the evolving role of thermography in cancer research emphasizes that, while advances have been made in acquisition and analysis techniques, well-curated clinical thermographic datasets with acquisition metadata and variability control are still scarce.19 This study addresses that gap by presenting a curated thermal image dataset generated under controlled RF heating within the ISM (Industrial, Scientific and Medical) 2.45 GHz band. The acquisitions were performed on both biological materials (pork, beef, and chicken) and inert references (wood and foam), covering a wide spectrum of dielectric and thermal behaviors. Using three infrared cameras with low, medium, and high spatial resolutions, we systematically varied emission power, observation distance, and viewing angle to capture reproducible temperature distributions across 4,200 radiometric frames. Each image is stored as a per-pixel temperature map with encoded metadata describing its acquisition conditions. This dataset thus establishes an experimental benchmark that connects RF–material interaction physics with computational thermography and machine learning, providing a reproducible resource for future studies in super-resolution reconstruction, inverse temperature estimation and thermal dosimetry optimization as well as for the training, and benchmarking of Machine Learning and Artificial Intelligence models aimed at material classification, and predictive modeling of heat transfer dynamics under electromagnetic exposure.
The applicator antenna was designed to operate within the 2.45 GHz ISM band and provides a reduced thermal footprint in simplified human body models composed of layers representing skin, fat, and muscle tissues. The implemented antenna consists of a modified folded dipole design with a ground plane, along with a grounded coplanar waveguide manufactured on both faces of a dielectric substrate that supports the reflector and connection to a coaxial cable. The design and validation of the applicator antenna used during the experiments are detailed in.21 Figure 1 shows the magnitude of the S11 parameter of the applicator antenna in free-space conditions. Its resonance frequency is observed to be 2.5041 GHz. However, since the antenna was designed to operate in the presence of the human body, its resonance and impedance performance are expected to change with respect to free-space conditions.
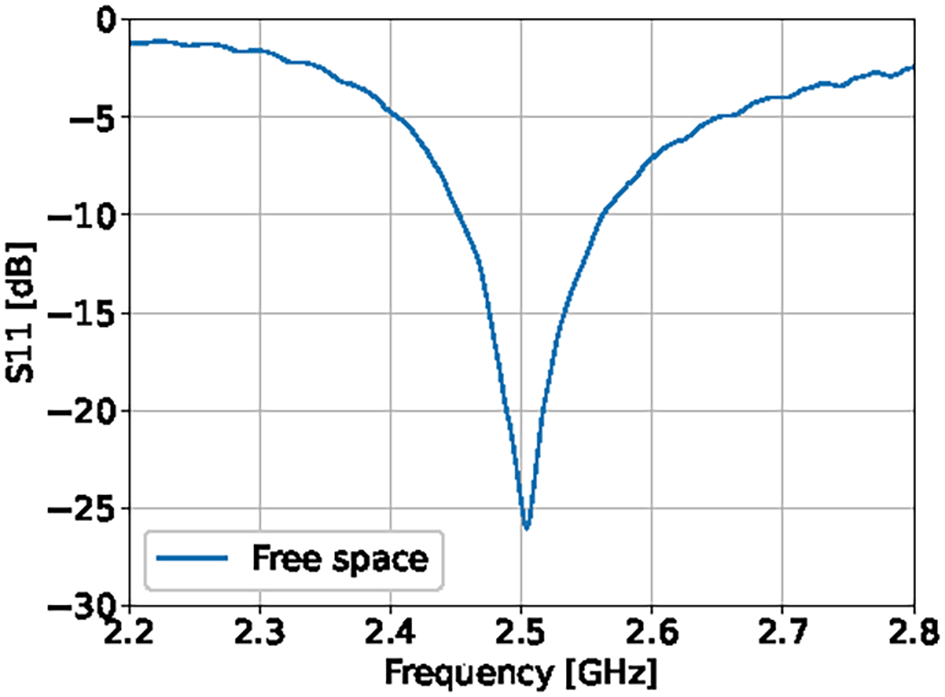
Figure 2 presents the S11 parameter when the antenna is close to different biological tissues derived from chicken, pork, and beef. The greatest variation in resonance frequency and bandwidth location is observed in the presence of bone tissue (see the curves corresponding to the chicken wing in green and the pork rib in blue). However, a shared bandwidth of approximately 75 MHz exists in all the analyzed cases. Within this interval, a center frequency of 2.5 GHz was selected for the RF signal generator, at which the antenna exhibits a minimum return loss of −13 dB or lower for all biological tissues, maintaining a constant distance of 5 mm between the antenna and the tissue. This frequency shift arises from the alteration of the near-field distribution caused by the presence of materials with dielectric permittivity different from that of air—a phenomenon previously exploited by other authors to measure dielectric property variations and characterize biological tissues.22,23
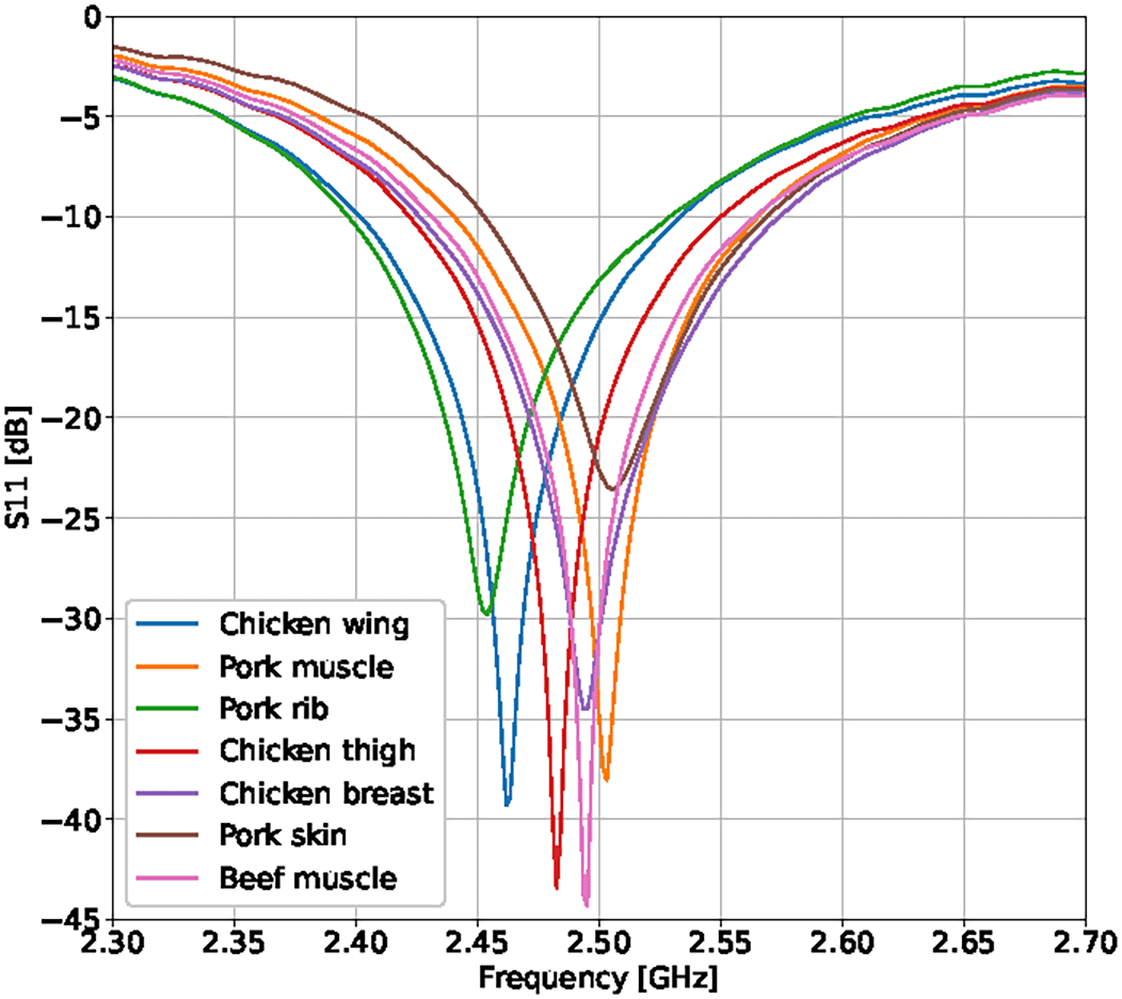
The distance between the antenna and the tissues was 5 mm.
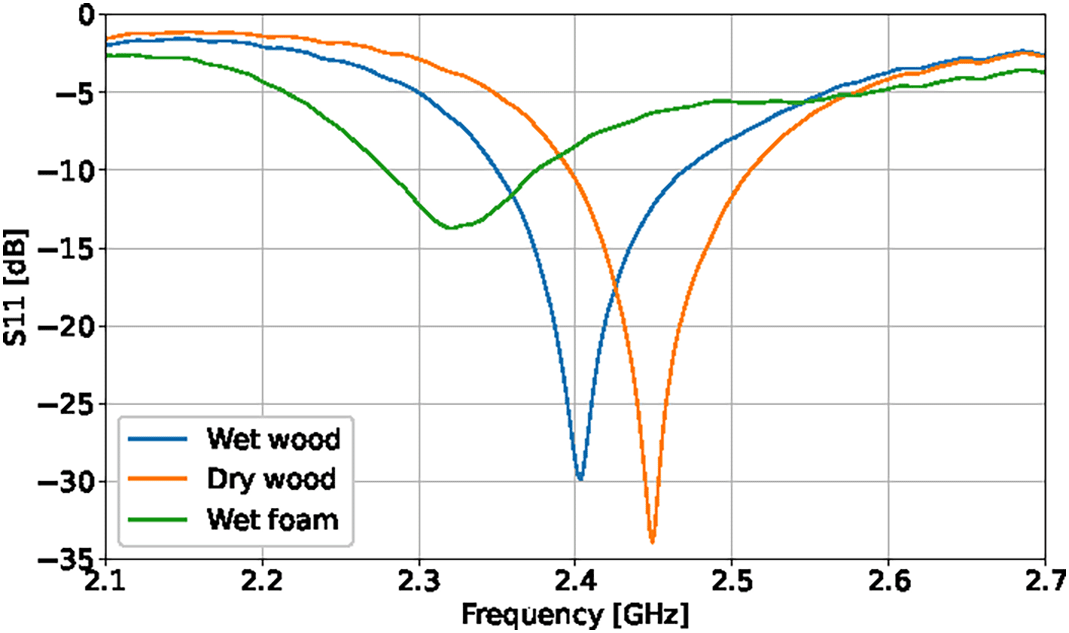
In cases involving inert samples, lower coupling magnitudes were observed, along with significant variations in the resonance frequency and bandwidth. Consequently, it was necessary to adjust the signal generator frequency during these measurements to ensure effective RF energy transfer to the material. The tests conducted with these inert materials confirmed the critical role of water content in materials or tissues to achieve proper antenna coupling, as illustrated in Figure 3 for the cases using dry wood (orange curve) and wet wood (blue curve).
The experimental setup consisted of a radio frequency heating system and a multi-camera acquisition system. The RF heating system consisted of a signal generator (Rohde & Schwarz, SMCV100B) providing continuous wave excitation of the hyperthermia applicator, a 6 W linear power amplifier (Mini-Circuits, ZVE-6W-83+), a three-port circulator (Pasternack, PE8432), and a 50 Ω matched load (Mini-Circuits, KARN-50-18+). In addition, a software-defined radio (USRP B200/B200mini, Ettus Research) was integrated for monitoring and for spectral verification of the transmitted signals.
The signal generator power was adjusted between 0 and 5.5 dBm in 0.5 dB increments, with a maximum of 6.5 dBm for highly permeable samples. This corresponded to a maximum power of 6 W at the amplifier output, with a reduction of 1 dB upon consideration of insertion, connection cable and circulator losses, i.e. 4.8 W net antenna input power. The radiating element was a unidirectional antenna, as described previously. This antenna was positioned with its surface parallel to the sample surface to provide consistent heating, with an initial distance of 5 mm between the antenna and the sample under test, as shown in Figure 4. The samples were placed on a flat plastic-coated support to provide stable one-to-one contact and minimize reflections, as such reflections can generate noise and error in the measurement. Thermal measurements were performed sequentially using three radiometric infrared cameras with different spatial resolutions—low (LR: 80 × 60 pixels), medium (MR: 382 × 288 pixels), and high (HR: 640 × 480 pixels)—corresponding to Thermal Camera HAT (LR), Optris PI 450i (MR), and FLIR A655sc (HR), respectively. Each device was calibrated before the experiments and configured in radiometric mode to record absolute temperature maps in each test performed (see Table 1). To avoid thermal cross-interference between acquisitions, a waiting period of 15–20 min was introduced between measurements to ensure that the surface temperature of the sample reached a quasi-steady state. In addition, control snapshots were captured every five minutes under constant RF excitation to assess temporal deviations and residual heating effects. Environmental factors, such as room temperature and relative humidity, were recorded throughout all experiments to ensure reproducibility. The average temperature recorded was 16°C, while relative humidity remained at 78%. These stable ambient conditions helped minimize external thermal drift and ensured consistent calibration across all measurement sessions.
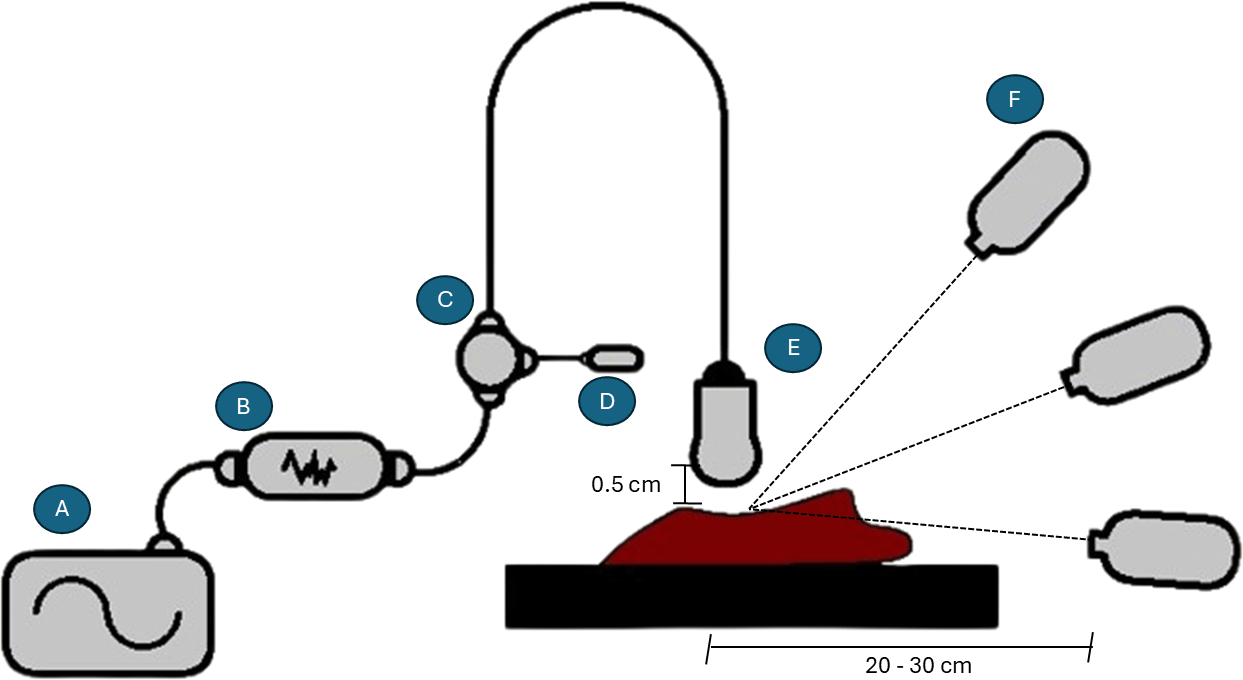
The system consists of: (A) an RF signal generator, (B) a microwave power amplifier, (C) a microwave circulator, (D) a matched load, (E) a directional antenna responsible for delivering the RF excitation, and (F) a set of infrared cameras used to capture the surface temperature distribution. The cameras included LR, MR, and HR models positioned at different observation angles to record multi-perspective data.
| Camera | Resolution | Spectral range | FoV | NETD* |
|---|---|---|---|---|
| FLIR A655sc (HR) | 640 × 480 | 7.5–14.0 μm | 15° × 11° | <30 mK |
| Optris PI 450i (MR) | 382 × 288 | 8–14 μm | Interchangeable lenses | ≤40 mK |
| Thermal Camera HAT (LR) | 80 × 60 | 8–14 μm | 45° × 45° | 150 mK |
The thermal image database were created using organic and inert materials, which were chosen to account for a broad range of dielectric constants, thermal conductivities, and surface emissivity’s often seen in biological and structural tissues. Table 2 summarizes the unique alphanumeric labels applied to each material to maintain traceability during acquisition, processing, and analysis. All organic samples (pork, beef, and chicken tissues) were used fresh to preserve their moisture and dielectric response. These samples were stored at −5°C and allowed to rest until they reached room temperature before RF heating to prevent condensation and ensure homogeneous thermal conditions. Each sample was measured only once per session to prevent dehydration or surface charring.
| Material | Label |
|---|---|
| phantom | Ph |
| Pork | P |
| Beef rib | Br |
| Foam | F |
| Wood | W |
| Chicken | C |
| Pork skin | Ps |
| Chicken breast | CB |
| Beef | B |
The biological materials (pork, beef, and chicken) used in this study were purchased from certified local butcher shops in Bogotá, Colombia. All specimens correspond to standard food-grade tissues intended for human consumption. No live animals were used or sacrificed for this research; therefore, no ethical approval was required.
For inert materials such as foam, wood, and phantoms, surface moisture can significantly affect both emissivity and the apparent temperature recorded by the thermal cameras. For this reason, porous specimens such as foam and wood were immersed in water for 12 h before acquisition to ensure controlled and repeatable initial humidity levels. Laboratory tests confirmed that materials with lower moisture content exhibited reduced surface temperature rise under identical RF power levels, consistent with their limited dielectric losses. In the case of the phantom, it was a custom formulation developed in our laboratory, whose dielectric and thermal properties—as well as its fabrication protocol—were previously reported in detail in.24
The inert samples were further characterized to account for their structural and thermal heterogeneity. The foam corresponded to a rigid polymer with mixed open–closed cell morphology like that described by Carrico et al.,25 exhibiting low density and poor RF coupling. The wooden specimens, derived from a dry, low-density species with moderate rough surface, displayed anisotropic heat transfer due to their fibrous microstructure.26,27 The phantom, fabricated following,24 was designed to emulate the thermal diffusivity and dielectric behavior of muscle-like tissues while minimizing water content.
These differences in thermal response among materials motivated the inclusion of both hydrated and dry specimens in the database, providing a diverse set of heating profiles for subsequent image acquisition and model training. All samples were prepared in blocks measuring approximately 5 cm × 5 cm with a depth of 6 cm to maintain comparable volumes between categories, although the organic tissues naturally exhibited heterogeneity due to the type of cut and the uneven distribution of fat. In total, the initial database comprises 1,200 thermal images for each resolution (3,600 total images) and is distributed as follows: 159 images of pork, 183 of beef ribs, 9 of foam, 81 of wood, 198 of chicken breast, 81 of phantom, 180 of pork skin, 156 of chicken thigh, and 153 of beef.
The acquisition of the different thermal images was carried out following a standardized and repeatable procedure, which was designed to ensure uniform conditions for all materials and the three thermal cameras used. Each acquisition session followed a predefined sequence that included temperature stabilization, camera positioning, and data recording under controlled environmental parameters.
Due to the limited distance between the hyperthermia applicator and the sample under test, simultaneous acquisition with all three thermal cameras was not possible. This distance was required to maintain optimal microwave coupling, reduce radiation dispersion, and avoid the need for even higher-power RF amplification. For this reason, acquisitions were carried out sequentially, with a 15-20 min interval between camera switches to allow the sample surface temperature to stabilize before the next measurement. Once stabilized, images were collected every five minutes while maintaining the same hyperthermia settings.
Each experimental day lasted approximately 8 hours and was divided into two independent 4-hour sessions, both dedicated to characterizing different specimens of the same material. For organic tissues, we applied repeated heating–cooling cycles to different surface regions to distribute the thermal load and prevent hardening or burning; each cycle consisted of a 3–5 min exposure at defined RF power levels (0–5.5 dBm) with controlled camera to sample distances. For inert materials, the acquisition followed the same protocol, with specimens prepared as described in the previous section to control their initial humidity and surface conditions.
Every acquisition session followed the steps below:
1. The sample was placed on a flat, plastic-coated surface to ensure stable contact and homogeneous coupling with the RF field.
2. The RF generator power was adjusted according to the programmed sequence (this can vary between 0.5 and 5.5 dBm), and image acquisition began once the heating curve stabilized.
3. The camera position was set according to the selected distance (20 cm or 30 cm) and acquisition angle (0°, 30°, or 60°). The parameters were randomized between sessions to avoid order-dependent bias.
4. Manual focusing was performed before each capture to ensure optimal sharpness and radiometric accuracy.
This protocol was repeated independently for each material and camera configuration used, ensuring reproducibility under identical environmental and RF heating conditions. The sequence of materials, cameras, and acquisition parameters was randomized in each session to avoid order-related biases, guaranteeing that all measurements were obtained under consistent and comparable experimental conditions.
In all acquisitions, the emissivity of the thermal cameras was fixed at 0.98, a value representative of organic tissues and suitable for most biological surfaces with minimal reflectivity. Maintaining this constant emissivity ensured consistent radiometric calibration across materials and camera configurations. Although inert samples exhibit slightly lower emissivity values, adopting a uniform setting avoided introducing correction factors that could bias the comparative thermal response analysis. Figure 5 shows the spatial arrangement used during data acquisition. The labeled elements (A1–A2 and E1–E2) correspond to the thermal cameras and their respective tripods, aligned according to the specified angles and distances. This configuration ensured consistent optical geometry and minimized parallax effects across different camera setups.
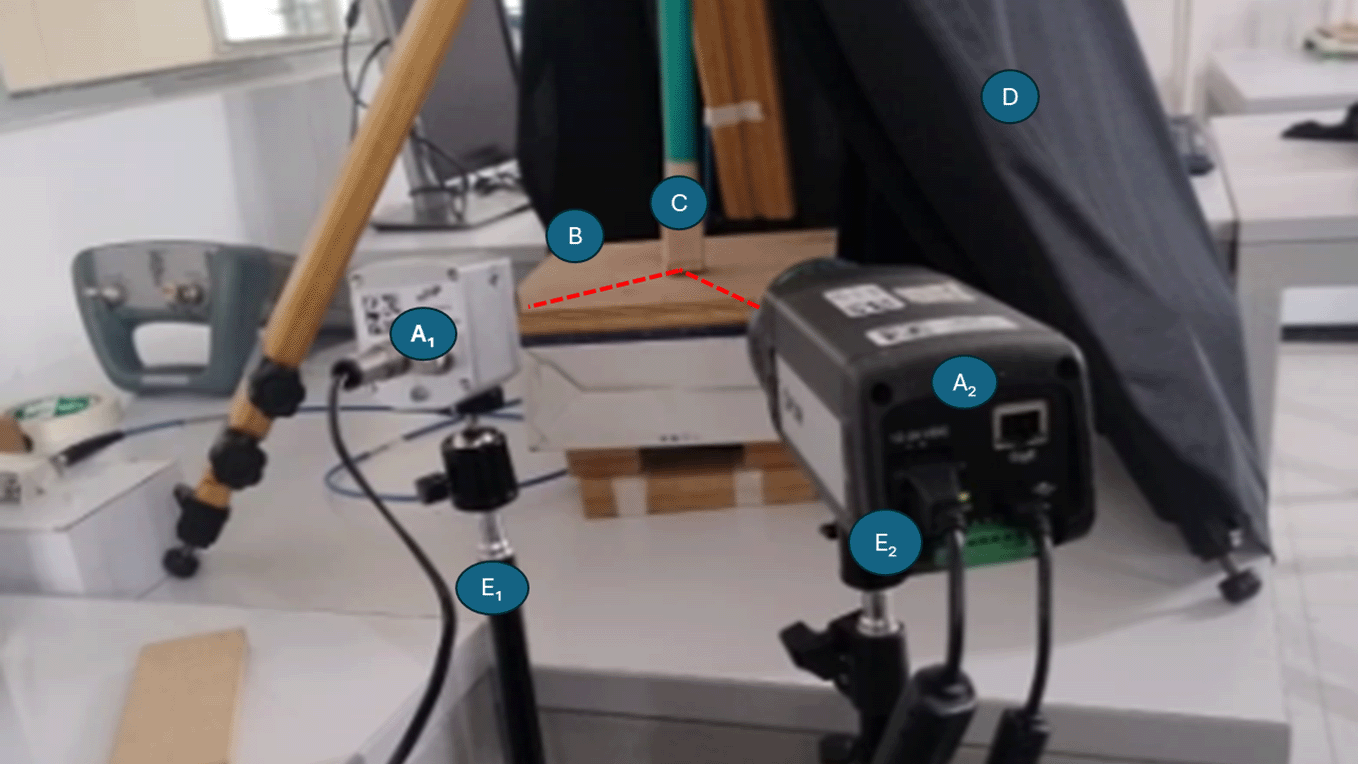
Cameras (A1) and (A2) correspond to the HR and MR thermal imaging systems. Tripods (E1) and (E2) held each camera during separate acquisition sessions. The antenna (C) was positioned above the sample (B), maintaining a constant distance of 0.5 cm between both elements. A black curtain (D) was used as a background to minimize reflections and isolate the measurement area. The cameras were placed at controlled distances (20 cm or 30 cm) and angles (0°, 30°, or 60°) with respect to the sample surface.
The acquisition protocol was designed to systematically control and vary three main experimental parameters: the RF system’s transmission power, the distance between the camera and the sample, and the acquisition angle, as these directly influence both the distribution of heating on the sample surface and the spatial radiometric characteristics of the recorded thermograms. Each parameter was adjusted individually and in combination to obtain a diverse and representative data set under different experimental conditions. The selected ranges for each parameter are summarized in Table 3, which defines the full set of controlled conditions used during data collection. The RF generator power was modulated in increments of 0.5 dBm. The standard range was 0-5.5 dBm. For low humidity, high-porosity samples such as foam and wood, the upper limit was extended to 6.5 dBm to obtain measurable temperature changes, as these materials showed low heating within the standard range. At 5.5 dBm, the surface temperature of wood increased by approximately 8°C above ambient temperature, whereas organic samples such as pork tissue exhibited an average rise of 31°C under the same excitation conditions. This exact adjustment enabled us to detect changes in dielectric heating effectiveness between materials with varying moisture content. Likewise, the acquisition angle between the thermal camera’s optical axis and the sample surface was set to three different values: 0°, 30°, and 60°, resulting in controlled geometric variation. The third variable was the distance between the camera and the sample under test, which was adjusted between 20 cm and 30 cm, allowing the effect of focal length and pixel projection scale on spatial resolution to be assessed. It is critical to note that each new configuration required manual focusing to achieve consistent image sharpness and radiometric accuracy. These three variables were methodically combined to form a complete acquisition matrix. Images of each material and thermal camera type (LR, MR, HR) were recorded in every configuration, resulting in a consistent and balanced dataset. This controlled design ensured a wide variety of thermal profiles and observation geometries, providing a foundation for future computational approaches such as image registration, geometric correction, super resolution, and temperature estimation using machine learning.
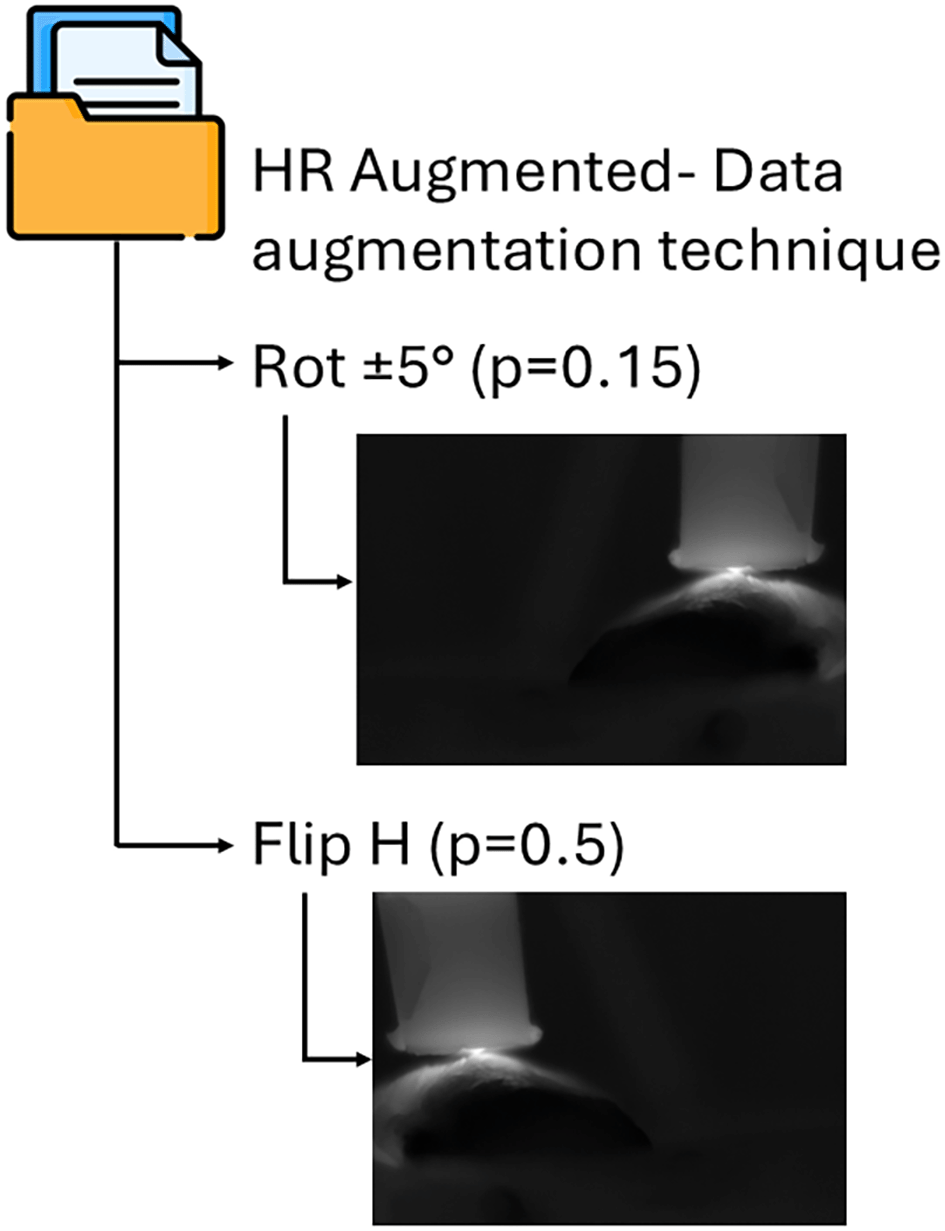
To enhance the robustness and generalizability of the dataset, a structured data augmentation pipeline was implemented across three spatial resolutions: High Resolution (HR), Medium Resolution (MR), and Low Resolution (LR). A total of 200 HR images were selected as the base dataset, which served as the reference for all subsequent transformations. HR images underwent minimal augmentations to preserve their high fidelity, including small rotations within ±5° with a probability of 0.15 and horizontal flips with a probability of 0.5, avoiding any photometric distortions or added noise that could compromise the original image quality. This approach ensured that HR images maintained their integrity while still introducing slight variability to support model generalization.28
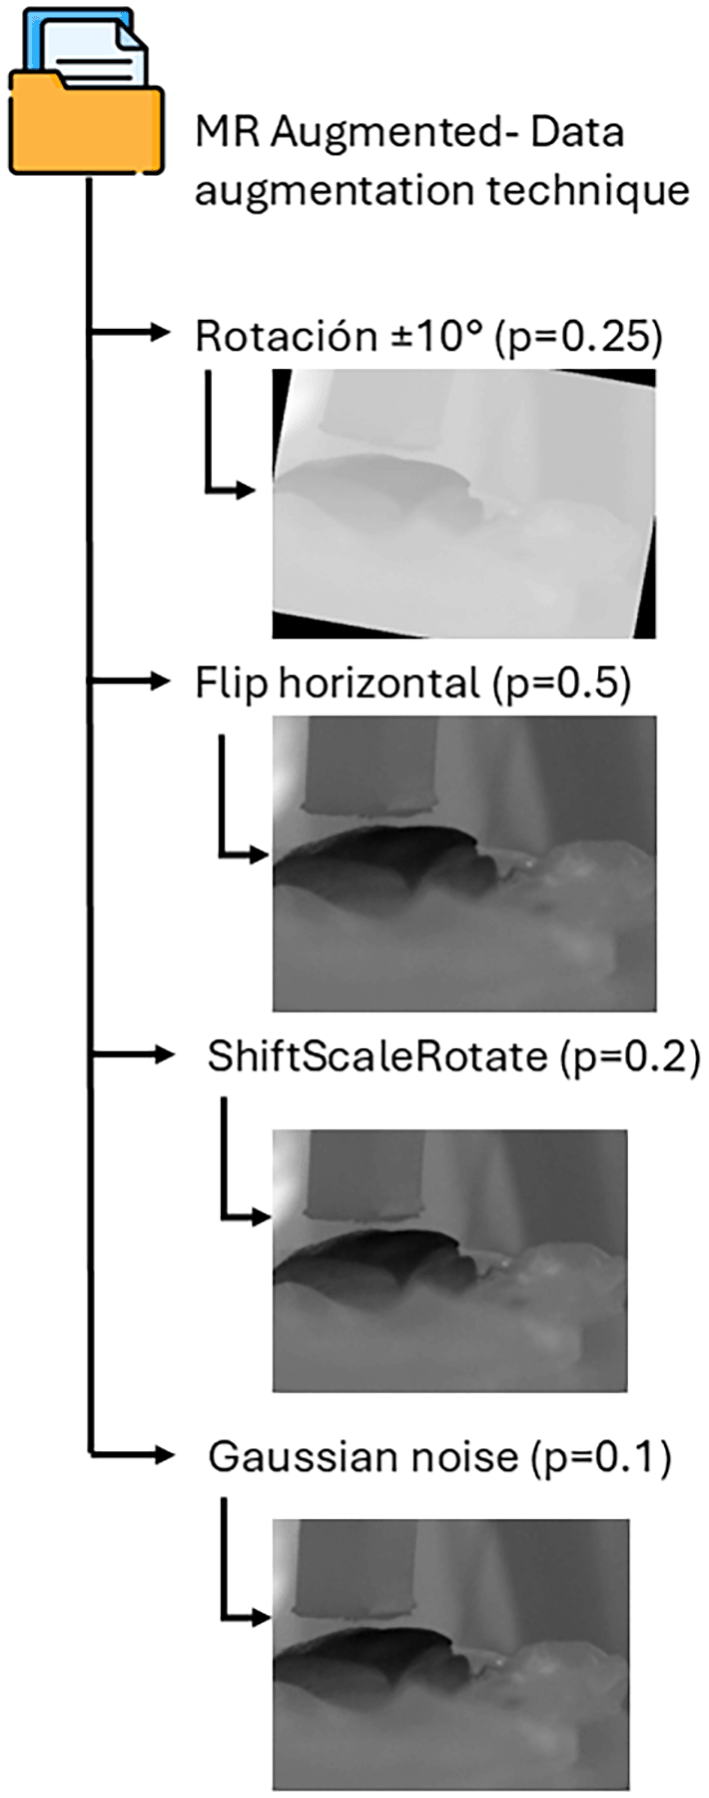
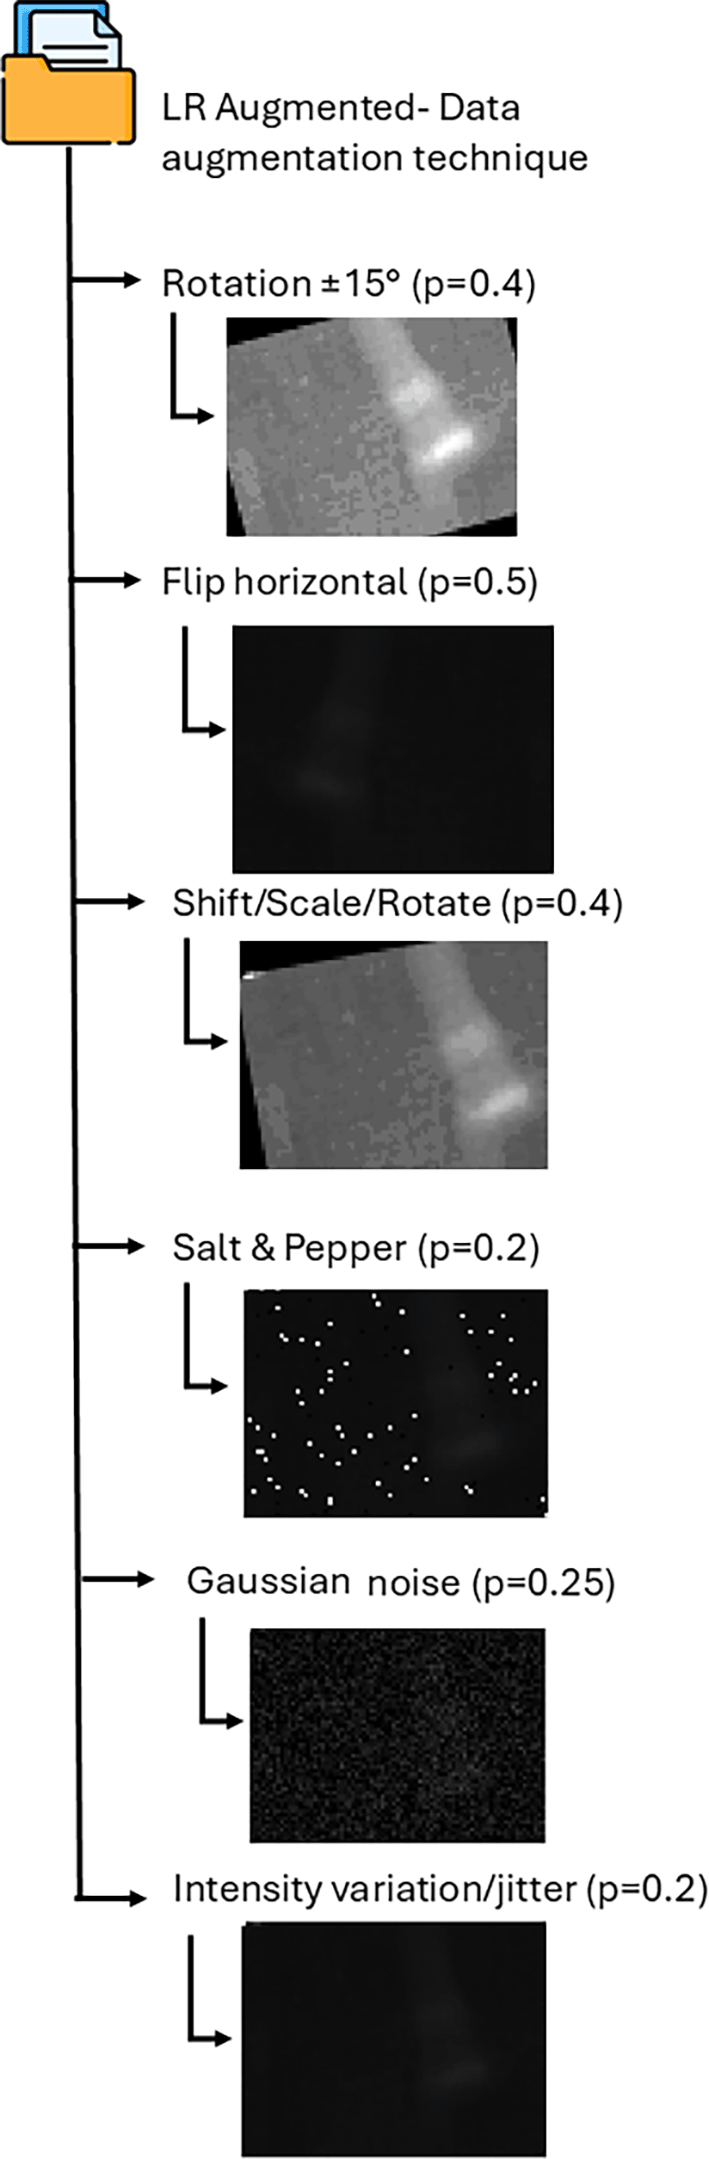
The 200 HR images were subsequently down sampled to MR and subjected to moderate augmentations to simulate more realistic acquisition variability while maintaining a balanced representation of features. Transformations for MR images included rotations within ±10° (p = 0.25), horizontal flips (p = 0.5), mild shift, scale, and rotation adjustments (p = 0.2), and light Gaussian noise (p = 0.1). These augmentations introduced controlled variability while preserving the structural and thermal patterns necessary for downstream analysis. For LR images, which simulate low-quality conditions typical of resource-constrained or degraded sensors, more aggressive augmentations were applied. These included rotations within ±15° (p = 0.4), horizontal flips (p = 0.5), combined shift/scale/rotation (p = 0.4), salt-and-pepper noise (p = 0.2), Gaussian thermal noise (p = 0.25), and intensity jitter (p = 0.2). This set of transformations enabled the simulation of sensor noise, geometric distortions, and photometric inconsistencies often encountered in low-resolution imaging.19,28
The complete augmentation pipeline is illustrated in Figures 6–8, where each resolution level (HR, MR, LR) is shown independently. The HR images underwent minimal transformations, the MR images moderate augmentations, and the LR images more aggressive transformations simulating low-quality conditions. This separation facilitates direct visual inspection of the severity of the progressive augmentation across resolutions.
All thermal acquisitions were stored in CSV files, where each file contains the pixel-to-pixel temperature data corresponding to a single infrared capture. An ordered filename convention was adopted to ensure complete traceability of the experimental conditions. The naming structure follows the format: Material_Resolution_Tstart _Tend_Distance_Angle.csv, where Material corresponds to the sample type (e.g., Pork, Wood, Phantom), Resolution refers to the camera used (HR, MR, or LR), Tstart and Tend denote the initial and final surface temperatures in °C, and Distance and Angle represent the acquisition geometry in centimeters and degrees, respectively. For example, the file Pork_MR_19_55_30_0.csv corresponds to a pork sample acquired with the medium resolution camera (MR), where the surface temperature increased from 19°C to 55°C, recorded at 30 cm and an acquisition angle of 0°.
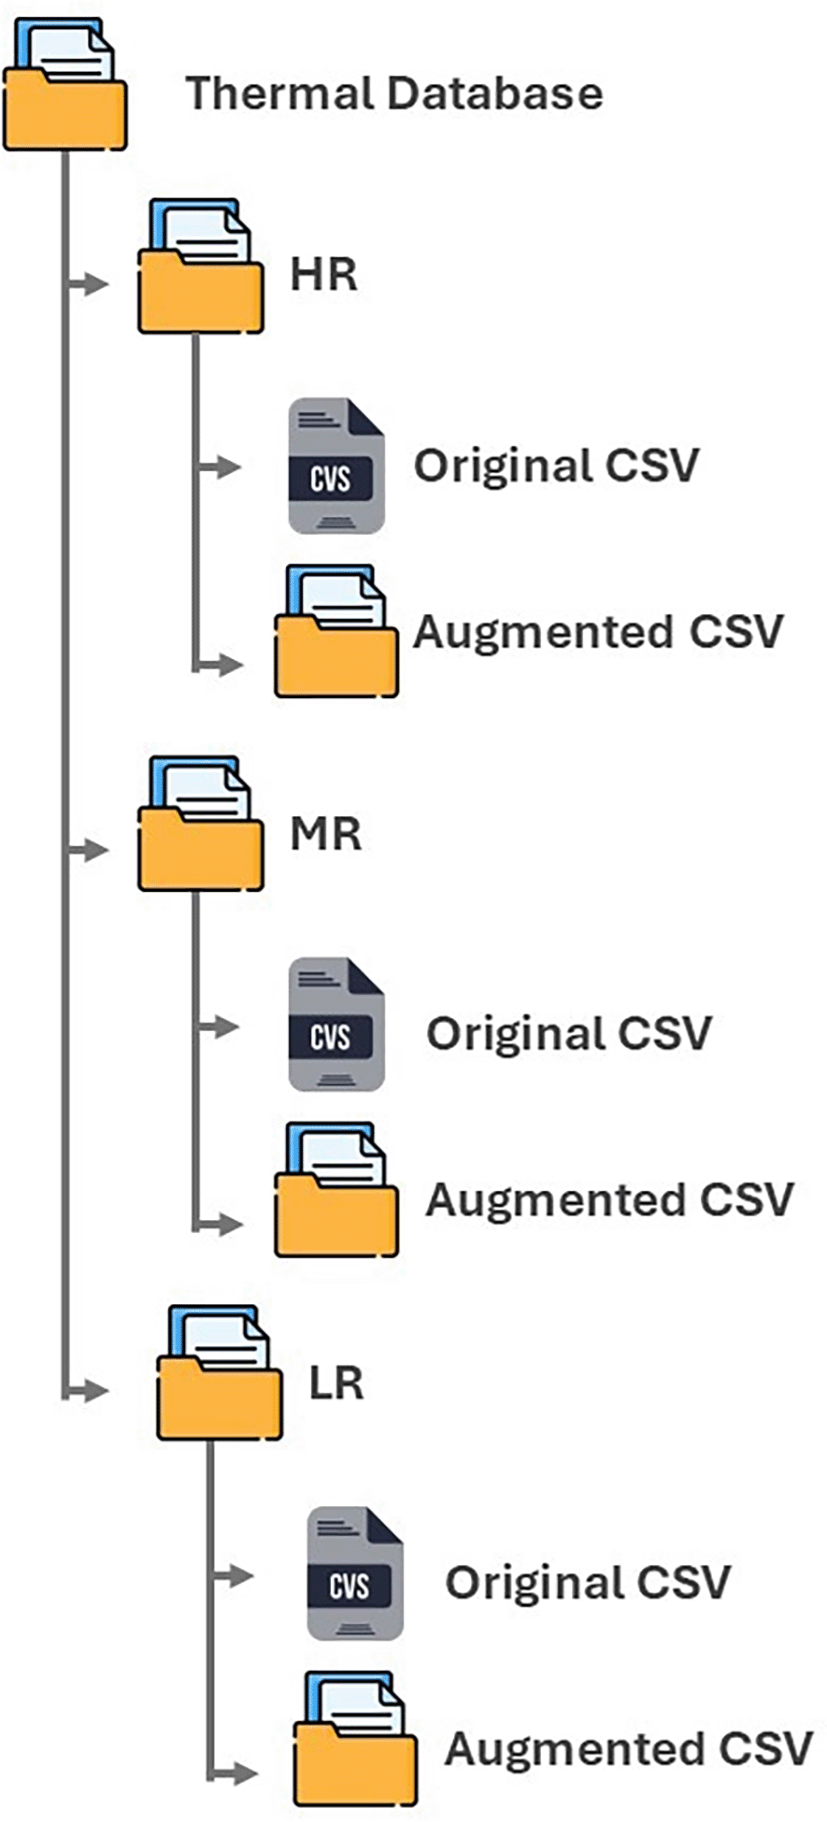
The dataset was divided into three main folders according to the spatial resolution: HR, MR, and LR. Each folder contains two subdirectories: Original/ (with the unmodified thermal images) and Augmented/ (with synthetic variations generated by resolution-specific data augmentation). The data augmentation was explained in the previous section.
Each augmented subfolder includes 200 synthetic images per resolution. The base dataset comprises approximately 3,600 original thermal images, and the augmentation process contributes an additional 600 synthetic samples (200 per resolution), resulting in a total of 4,200 images.
Across the entire dataset, each material is represented by 150–200 thermal captures, distributed among the organic samples (pork, beef, chicken) and inert samples (wood, foam, phantom). The dataset structure and file hierarchy are illustrated in Figure 9. This organization facilitates selective loading by resolution or material type and enables systematic benchmarking of algorithms for super-resolution, denoising, and thermal field reconstruction under controlled experimental conditions.
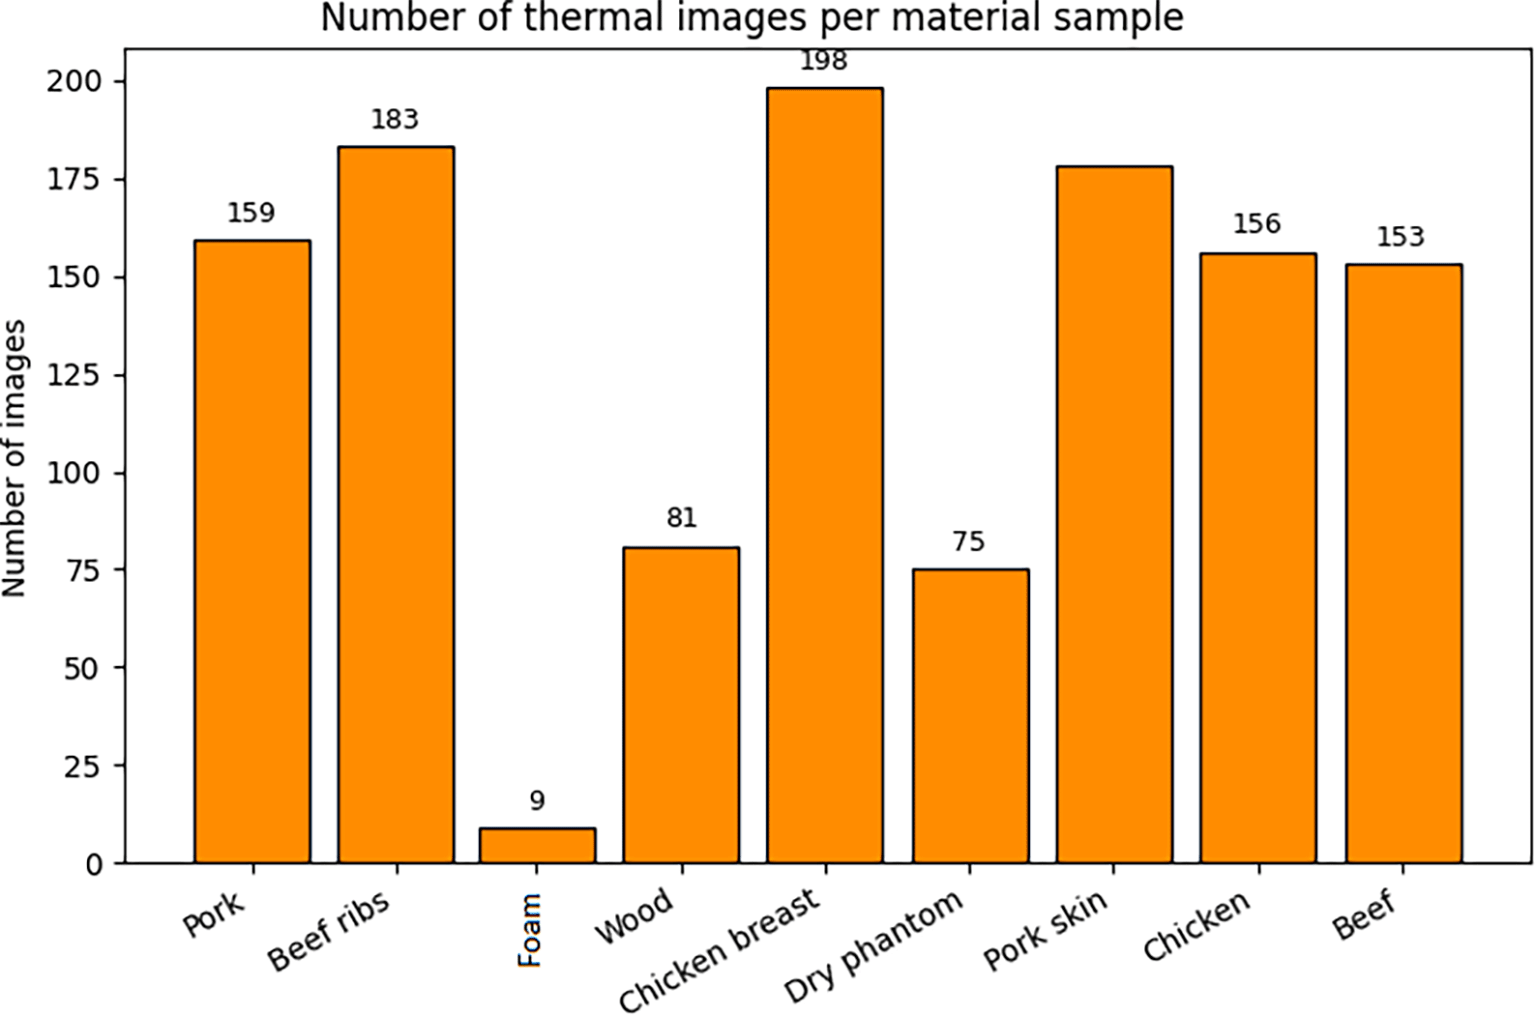
The acquisition procedure yielded 3,600 raw thermal images, which were expanded through resolution dependent data augmentation methods to reach 4,200 images. The data was organized into the three resolution levels (LR, MR, HR), with each containing both original captures and computer-synthesized augmentations. Approximately 150–200 thermal images were acquired for each material, with a balanced distribution among biological tissues (beef, pork, and chicken). In contrast, the inert models (foam and phantom) were represented by a smaller number of samples due to their limited variability. A quantitative summary of the dataset composition is presented in Figure 10, showing the number of thermal images per material type. Each resolution level includes 1,200 thermal images, distributed as follows: 159 of pork, 183 of beef ribs, 6 of phantom, 9 of foam, 81 of wood, 180 of chicken breast, 75 of phantom, 180 of pork skin, 156 of chicken thigh, and 153 of beef. This distribution ensured balanced representation across biological materials, while inert samples served as stable references for evaluating temperature responses under controlled RF exposure conditions. Variations in sample count arose from differences in measurement feasibility and thermal stability during the heating process, especially in organic tissues where dehydration and structural changes could alter the recorded thermal response. All acquisitions were documented using standardized metadata to preserve traceability throughout the dataset lifecycle. Thus, the dataset constitutes a reproducible and diverse resource for the validation of computer vision and thermometric models. An illustrative example of the type of thermal images obtained during acquisition is shown in Figure 11. For this case, a pork skin sample was used and heated until reaching 45°C at the surface. The three thermal cameras recorded the event sequentially from a fixed distance of 30 cm and an observation angle of 30°, reproducing the standardized conditions used throughout the dataset. The resulting frames clearly reveal resolution-dependent contrast and spatial detail across the three resolution levels, which were later used to assess image quality consistency and temperature variation across materials and resolutions.
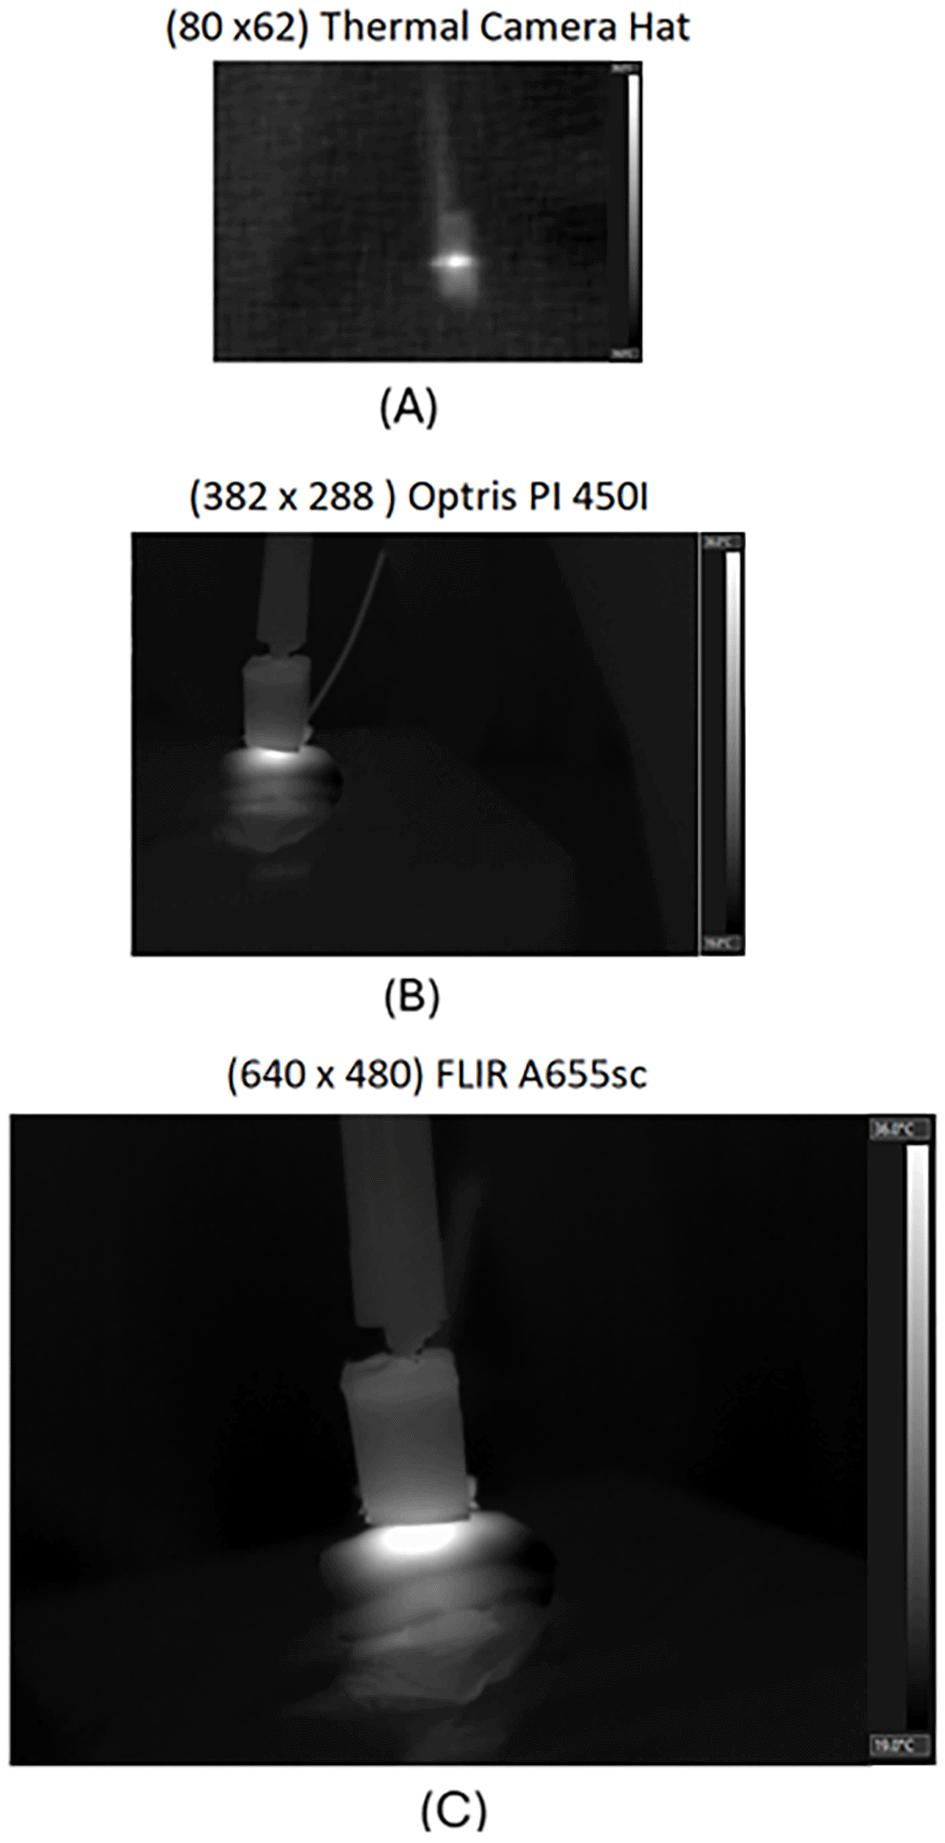
The test was performed on a pork skin sample heated up to 45°C, with the cameras positioned 30 cm from the sample at a 30° observation angle.
Typical day-long acquisition sessions lasted around 8 h and were restricted to two samples for the same material (4 hours per sample), to reduce degradation due to loss of cooling. For biological specimens, thermal cycles were induced in localized as well as random areas on the surface. These induced a repeatable circular thermal footprint created by the antenna with a central maximum correlating with that of the beam focus. The footprint often materialized as a protrusion on the surface as a blister-like area and was accompanied by increasing dehydration. At session termination, the spots showed lower water content as well as a darker thermal hue than the adjacent tissue, which was reflected in the thermal records.
In inert porous materials like foam and wood, pre-soaking in water for 12 h provided saturation before measurement. These materials, however, released the absorbed water very fast. After dehydration had been established, the heating curve became flat, and in other instances, the temperature dropped to ambient levels, thus stopping further thermal energy accumulation. This phenomenon provided evidence on the water content as a determining factor on RF-induced heating in both biological and inert materials.
Table 4 summarizes the initial and final surface temperatures measured at 5.5 dBm for each material. Ambient temperature remained between 16°C and 19°C throughout all experiments, resulting in temperature rises to approximately 35°C for biological tissues and below 15°C for inert materials.
Our setup produced stable and repeatable heating profiles, producing observable thermal variations under controlled combinations of power, distance, angle, and camera resolution. Surface temperature increases typically between 5°C and 35°C, depending on the material type and exposure parameters. The compiled dataset therefore captures both experimental variability—originating from acquisition geometry and power settings—and intrinsic material responses, providing a reproducible and comprehensive benchmark for future machine learning and thermographic reconstruction studies.
| Views | Downloads | |
|---|---|---|
| F1000Research | - | - |
|
PubMed Central
Data from PMC are received and updated monthly.
|
- | - |
Provide sufficient details of any financial or non-financial competing interests to enable users to assess whether your comments might lead a reasonable person to question your impartiality. Consider the following examples, but note that this is not an exhaustive list:
Sign up for content alerts and receive a weekly or monthly email with all newly published articles
Already registered? Sign in
The email address should be the one you originally registered with F1000.
You registered with F1000 via Google, so we cannot reset your password.
To sign in, please click here.
If you still need help with your Google account password, please click here.
You registered with F1000 via Facebook, so we cannot reset your password.
To sign in, please click here.
If you still need help with your Facebook account password, please click here.
If your email address is registered with us, we will email you instructions to reset your password.
If you think you should have received this email but it has not arrived, please check your spam filters and/or contact for further assistance.
Comments on this article Comments (0)