Keywords
Responsiveness, Health system, Health services, Health system performance, Healthcare quality
This article is included in the Health Services gateway.
Responsiveness, Health system, Health services, Health system performance, Healthcare quality
Health service delivery involves complex interactions between various stakeholders, with providers and patients playing central roles. The dynamic involvement of these stakeholders in a delivery system often leads to conflicting requirements, demands, and expectations (Laurisz et al., 2023). The quality of the process and outcome are crucial, especially given the increasing role of patients in the production and delivery of health services (Mosadeghrad, 2014). Thus, understanding and addressing their concerns and expectations are essential to ensure responsive and effective healthcare (Bombard et al., 2018; Vahdat et al., 2014).
Patients present to healthcare providers with diverse expectations, and failure to comprehend these expectations can lead to unwarranted assumptions and provision of unwanted or unnecessary care. Such shortcomings in healthcare provision contribute to dissatisfaction, non-compliance, and inappropriate utilization of medical resources (Land et al., 2019; Tateke et al., 2012). Consequently, gaining insight into patient perspectives is imperative for clinicians, managers, policymakers, and health system researchers (Land et al., 2019; Laurisz et al., 2023; Rosen et al., 2018).
Responsiveness is defined as a health system’s ability to meet the legitimate expectations of patients regarding non-health-enhancing aspects of care (Khan et al., 2021; Valentine et al., 2003). It is one of the three independent goals of health systems, along with good health and fair financial contribution (Papanicolas et al., 2022). It also serves as a dimension of healthcare quality measures and is a key element in health system governance (Papanicolas et al., 2022; Parasuraman et al., 1985). The World Health Organization (WHO) has identified eight dimensions of responsiveness encompassing individuals’ experiences with the health system (Valentine et al., 2003).
Responsiveness in healthcare systems remains a global concern, with documented variations across countries (Forouzan et al., 2016; Khan et al., 2021; Negash et al., 2022b). Dimensions such as the quality of basic amenities, choice of providers, autonomy, and participation are often reported as areas where healthcare services perform poorly (Ebrahimipour et al., 2013; Melo et al., 2017; Negash et al., 2022a; Ogaji et al., 2020). By contrast, confidentiality and dignity are consistently regarded as dimensions of superior performance, even in Ethiopia (Forouzan et al., 2016; Kapologwe et al., 2020; Negash et al., 2022b; Ogaji et al., 2020).
In resource-limited settings such as Ethiopia, these disparities can be exacerbated by the challenges of thinly stretched healthcare resources and systemic hurdles (Savitha, 2014). For instance, basic amenities, such as access to clean water and sanitation facilities, may be inadequate in many healthcare facilities (Guo, Bowling, Bartram, & Kayser, 2017), directly affecting the overall quality of care. In addition, the limited availability of diagnostic and treatment resources can pose significant challenges in accessing the required care and choosing healthcare providers (Kafkova, 2016; Lokina & Musili, 2021; Towfighi et al., 2021). This scarcity also indirectly affects patient autonomy in the decision-making processes (Babu et al., 2019) and ultimately contributes to low levels of responsiveness.
To improve healthcare quality and address the mismatch between disease burden and healthcare capacity, it is imperative to delve into studies on health system responsiveness. Such studies not only enhance patient health outcomes by refining service delivery, but also offer crucial insights for crafting health policies aimed at augmenting healthcare system responsiveness, ultimately ensuring equitable and effective healthcare provision. However, despite the contextual significance of responsiveness and its pivotal role in healthcare delivery, its level and contributing factors remain insufficiently documented in the Gamo Gofa Zone. Hence, this study employed a mixed-methods approach to fill this gap by assessing the level of responsiveness and identifying its determinants in Gamo Gofa. This study was guided by the following primary question: What is the level of responsiveness of health services in Gamo Gofa hospitals?
This study employs a mixed-methods approach that incorporates both a cross-sectional survey and focus group discussions. The data collection period spanned from March 2011 to June 2013.
This study was conducted in three public hospitals situated within the Gamo Gofa Zone of the Southern Nations, Nationalities, and People’s Region (SNNPR) of Ethiopia. The zone, encompassing 29 districts with a total population of 1,597,767, features key healthcare facilities such as one zonal hospital (Arba Minch), two district hospitals (Chencha and Sawula), 21 health centers, 46 rural health centers and stations, and 463 health posts. Notably, the zone has witnessed a growth in the number of healthcare institutions (Gamo Gofa Zone Health Department Annual Report, 2010).
The sample size for the cross-sectional survey was calculated using the single population proportion formula, considering a population prevalence of 0.5, a 95% confidence level, and an alpha value of 0.05 for the margin of error. The total sample size was 422, with a non-response rate of 10%. A proportional-to-size allocation was employed to distribute participants to each hospital. This allocation was based on the proportion of patients who visited outpatient and inpatient departments in the month preceding the study period. Subsequently, respondents from the respective hospitals were selected using a systematic sampling procedure. All patients who were not in a critical condition, as well as parents or caregivers of children or critically ill patients, were eligible to be interviewed.
Focus group discussions were conducted in all three hospitals, with each group consisting of 10 to 12 members. Participants were purposefully selected from among residents who had used healthcare services from hospitals within the past year and did not participate in the interview. Focus group discussions were concluded after eight sessions, as information saturation was reached, with a total of 72 participants.
The data for this study were collected using a structured questionnaire and discussion guide adapted from prior studies and translated into Amharic to ensure relevance to the study setting (Ustun et al., 2003; WHO, 2001). Trained interviewers conducted patient exit interviews in a private room within the hospital compound to ensure privacy and confidentiality. The interview took place after the respondents had received all necessary services and utilized a structured questionnaire to assess various aspects of health service responsiveness.
The focus group discussions, each lasting 90 min, commenced with a concise introduction of the topic by the principal investigator. The discussion topics encompassed 1) positive experiences of engaging with healthcare providers, 2) negative experiences of engaging with healthcare providers, and 3) perceived characteristics of responsive healthcare systems. The tape-recording of the discussions was conducted with the explicit consent of all participants, thereby ensuring comprehensive collection of qualitative data.
The quantitative data were entered into SPSS version 26 and subjected to a comprehensive process that included cleaning, editing, and coding. Descriptive statistics were employed to calculate frequencies, while mean scores were computed for Likert Scale instruments using a range of 1 to 5 (1 = very bad to 5 = very good) to assess the level of responsiveness. Principal component analysis was performed to reveal the majority of variances by employing a reduced number of factors, enabling the treatment of variables as continuous in subsequent regression analyses. This analysis employed the principal component extraction method with an eigenvalue of one or higher and utilized varimax rotation methods. Satisfaction scores were obtained using factor analysis. Wealth quantiles were established, and bivariate and multiple linear regressions were employed to identify factors influencing responsiveness in the outpatient department (OPD). A statistical significance level of 0.05 was applied in all analyses.
For the qualitative data, audiotapes from each session were transcribed verbatim, translated into English, and imported into a qualitative data management software (QSR NVivo 9) for analysis. A thematic analysis approach was employed to organize emerging themes from the data, and the results were presented in a narrative form. The findings derived from the qualitative data were then triangulated with the quantitative data to ensure a comprehensive and nuanced interpretation of the study results.
The study adhered to ethical standards in accordance with the Declaration of Helsinki. Ethical approval was obtained from the Arba Minch University Ethical Review Committee on November 30/2011 (reference number: RCS/014/03). Official permission to conduct the study was granted by the administrators of the participating hospitals.
Prior to participation, all participants received detailed information about the study, including its purpose, potential benefits and risks, and assurances of privacy and confidentiality. Informed consent was obtained verbally, either directly from the participants or from their caregivers for those unable to provide consent themselves. The decision to use verbal consent was approved by the ethics committee and was chosen to accommodate participants who might face literacy challenges or felt hesitant about signing documents. This approach ensured inclusivity and comfort during the consent process. The verbal consent procedure was documented and adhered to the ethical standards set by the approving ethics committee.
The first part shows the results obtained from the survey, and the second part presents qualitative findings.
In total, 419 participants participated in the survey, resulting in a response rate of 99.28%. The median age of the participants was 28 years (range: 12–85 years). Among all the respondents, 87.8% were users of outpatient services ( Table 1).
Among the outpatient service users, the primary reasons for hospital visits were illness (93.5%) and checkups (6.5%), with 51.6% being first-time visitors. Among the inpatient service users, 68.6% were new visitors. Of the 16 repeat inpatient service users, 31.3% were admitted at least once in the last month and another 31.3% were admitted at least once in the last year. During their present visit, 49% of the inpatient service users stayed in the hospitals for 3-5 days, whereas 39.2% stayed for 1-2 days.
The median travel time for outpatient service users was 30 minutes, with the range falling between 5 minutes and 3 and half hours. In comparison, the median travel time for inpatient service users was approximately 45 minutes, with a range extending from 1 minute to 10 hours.
The mean scores showed that confidentiality received the highest rating among outpatient respondents, whereas dignity received the highest rating among inpatient respondents. Conversely, prompt attention and quality of basic amenities received the lowest mean scores among outpatient and inpatient respondents, respectively. Social support was ranked as the second-lowest score component in inpatient health services ( Table 2).
In the present study, only 10.3% of the total outpatient respondents reported having the necessary information to choose their healthcare provider. Most respondents (35.3%) received treatment from nurses, followed by health officers (25.8%). Similarly, 20.1% and 15.8% of the respondents were treated by medical doctors (general practitioners and specialists) and midwives, respectively. Notably, 75% of the care providers were male.
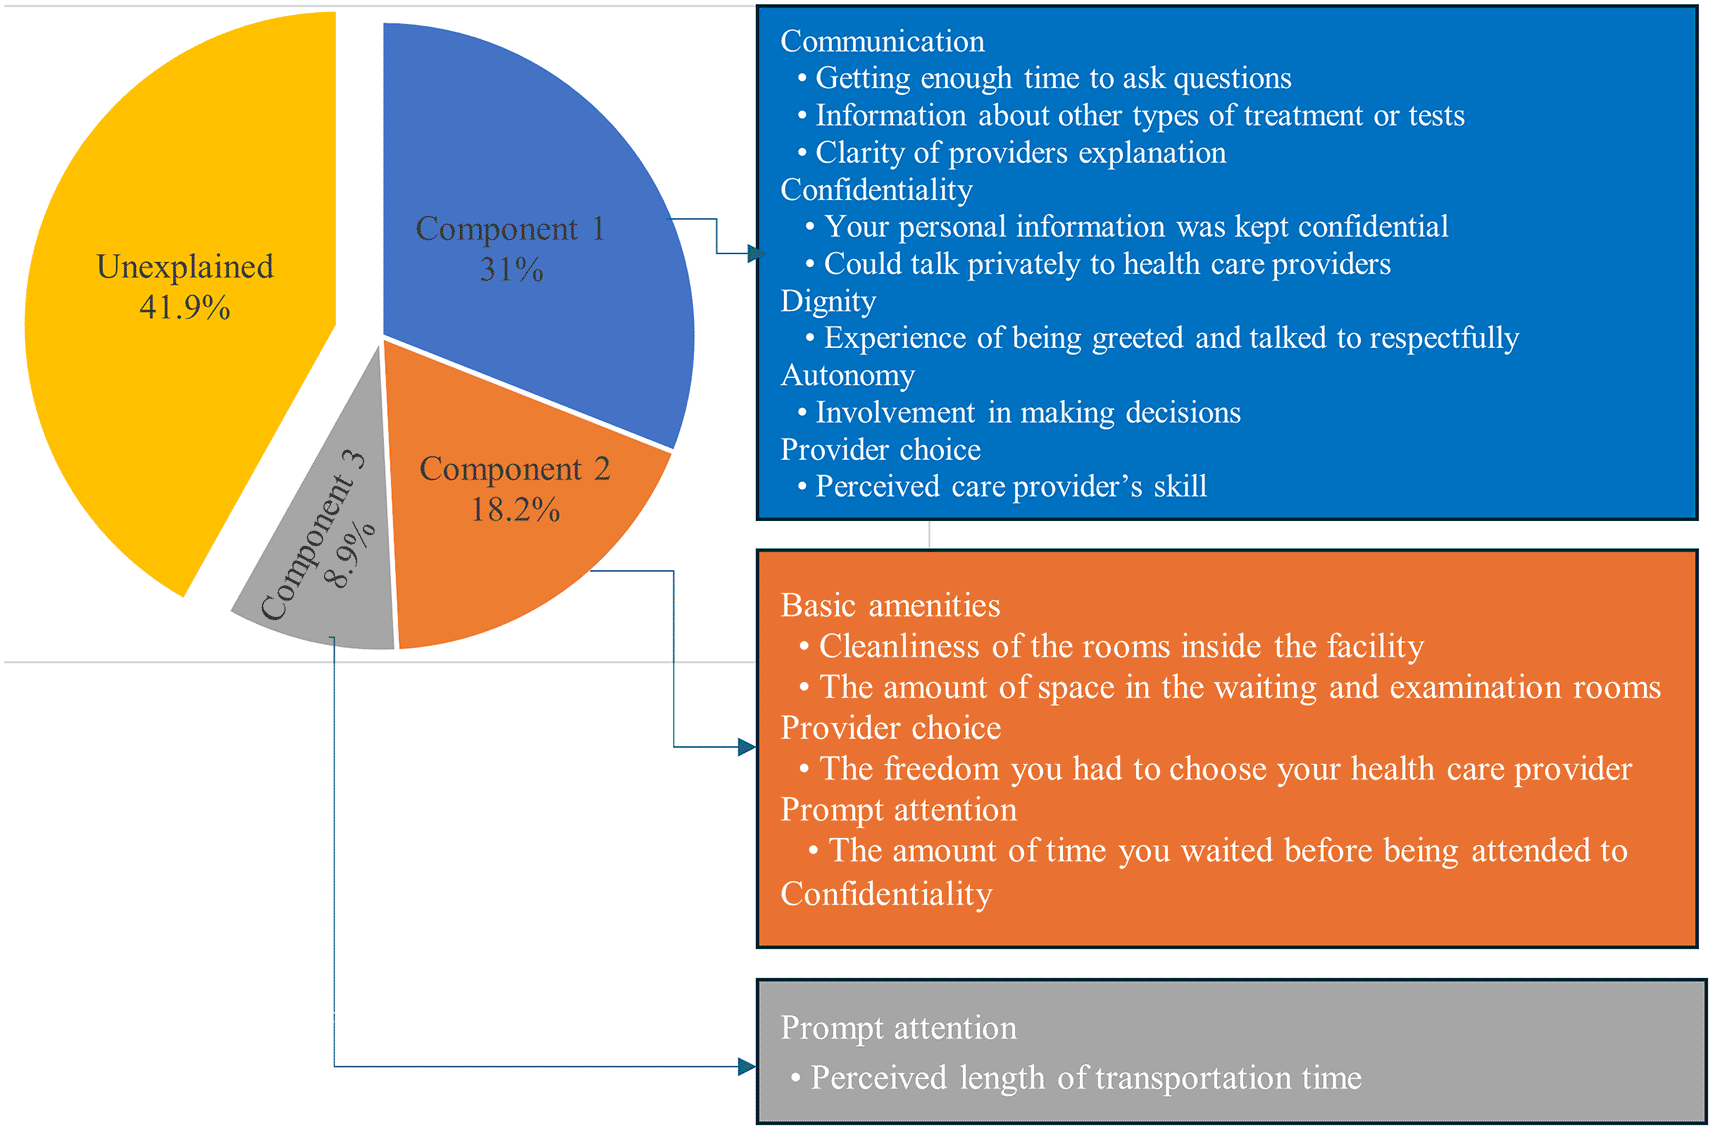
In the principal component analysis (PCA), three components emerged, each with eigenvalues greater than one, collectively accounting for 58.1% of the variance in outpatient health service responsiveness. Patient-centered communication (Component 1), comprising eight items, explained 31.0% of the total variance, as depicted in Figure 1. Moreover, the patient-centered care environment (Component 2), consisting of five items, explained 18.2% of the variance, while prompt attention (Component 3), featuring one item related to prompt attention, accounted for 8.9% of the total variance.
In a bivariate regression analysis, various factors including occupation, educational status, marital status, wealth score, sex, age, ethnicity, religion, means of transportation, self-judged health status, expectation of services, perceived possibility of an appointment, possession of information to choose care providers, consultation duration, and satisfaction score, were analyzed as predictors of the components identified through PCA. Table 3 presents the statistically significant variables in Model 1. These variables were then included in the multiple linear regression analysis and their values are shown in Model 2 of Table 3. According to the results of the bivariate model, public employees had 0.37 units higher (p≤0.001) score in the patient-centered care environment than students. The means of transportation also demonstrated a significant impact on all components, with patients who arrived on foot scoring 0.35 units higher (p≤0.001) in patient-centered communication than those using public transportation.
| Variables | Frequency (%) | Patient-Centered Communication B (95% CI) p-value | Patient-Centered Care Environment B (95% CI) p-value | Prompt attention B (95% CI) p-value | |||
|---|---|---|---|---|---|---|---|
| Model 1 | Model 2 | Model 1 | Model 2 | Model 1 | Model 2 | ||
| Occupation | |||||||
| Student# | 121 (32.9) | ||||||
| Public servant | 71 (19.3) | -0.12 (-0.44, 0.21) | -0.12 (-0.45, 0.22) | 0.28 (-0.00, 0.57)** | 0.37 (0.08, 0.65) *** | -0.21 (-0.49, 0.07) | 0.07 (-0.15, 0.28) |
| Housewife | 57 (15.5) | 0.24 (-0.04, 0.53) | 0.22 (-0.12, 0.57) | 0.16 (-0.10, 0.42) | 0.03 (-0.29, 0.35) | -0.34 (-0.63, -0.06) ** | -0.01 (-0.27, 0.23) |
| Farmer | 41 (11.1) | 0.05 (-0.29, 0.39) | -0.12 (-0.50, 0.26) | 0.33 (-0.08, 0.74)* | 0.26 (-0.15, 0.66) | 0.50 (0.12, 0.87) ****** | 0.36 (0.10, 0.63) *** |
| Others | 78 (21.2) | 0.53 (0.27, 0.79) *** | 0.39 (0.12, 0.65) *** | 0.43 (0.14, 0.72) *** | 0.24 (-0.03, 0.50) * | 0.08 (-0.21, 0.37) | -0.05 (-0.25, 0.14) |
| Ethnicity | |||||||
| Gamo# | 188 (51.1) | ||||||
| Gofa | 61 (16.6) | -0.29 (-0.55, -0.03) ** | -0.40 (-0.70, -0.09) *** | -0.49 (-0.79, -0.18) *** | -0.26 (-0.59, 0.08) | 1.01 (0.74, 1.26) *** | 0.14 (-0.06, 0.34) |
| Amhara | 56 (15.2) | -0.21 (-0.52, 0.09) | 0.04 (-0.25, 0.32) | -0.09 (-0.39, 0.22) | 0.15 (-0.09, 0.39) | 0.06 (-0.23, 0.36) | -0.05 (-0.24, 0.15) |
| Others | 63 (17,1) | -0.23 (-0.54, 0.08) | 0.11 (-0.18, 0.39) | -0.35 (-0.63, -0.06) *** | 0.03 (-0.20, 0.26) | -0.25 (-0.52, 0.03)** | -0.29 (-0.49, -0.09) *** |
| Religion | |||||||
| Orthodox# | 194 (52.5) | ||||||
| Protestant | 152 (41.3) | 0.22 (0.01, 0.44) ** | 0.33 (0.13, 0.53) *** | -0.12 (-0.33, 0.09) | -0.12 (-0.30, 0.06) | -0.05 (-0.26, 0.16) | -0.14 (-0.28, 0.00) ** |
| Others | 22 (6.0) | -0.02 (-0.33, 0.33) | -0.10 (-0.42, 0.23) | -0.18 (-0.66, 0.30) | 0.08 (-0.31, 0.47) | 0.63 (0.17, 1.10)** | 0.34 (0.12, 0.57) *** |
| Marital Status | |||||||
| Married# | 242 (57.8) | ||||||
| Single | 169 (40.3) | -0.03 (-0.24, 0.18) | 0.22 (-0.03, 0.47) * | -0.14 (-0.35, 0.07) | -0.02 (-0.28, 0.23) | 0.09 (-0.12, 0.29) | 0.03 (-0.15, 0.21) |
| Others | 8 (1.9) | 0.16 (-0.24, 0.56) | -0.37 (-1.01, 0.28) | 0.02 (-0.46, 0.50)* | 0.78 (0.09, 1.48)** | 1.89 (1.45, 2.33) *** | 0.35 (0.03, 0.66)** |
| Age | 0.01 (-0.01, 0.02) | 0.01 (-0.00, 0.02)* | 0.0 (-0.00, 0.01) | 0.0 (-0.01, 0.01) | -0.01 (-0.02, 0.00)* | -0.01 (-0.02, 0.00)* | |
| Wealth Score | 0.04 (-0.04, 0.11) | 0.03 (-0.06, 0.09) | 0.08 (0.00, 0.15) ** | 0.09 (0.03, 0.16) *** | 0.08 (0.01, 0.15)** | 0.04 (-0.02, 0.10) | |
| Means of transportation | |||||||
| Public transport# | 197 (53.5) | ||||||
| Walking | 106 (28.8) | 0.35 (0.13, 0.56) *** | -0.01 (-0.24, 0.22) | 0.47 (0.23, 0.70) *** | 0.27 (0.07, 0.47) *** | 0.36 (0.11, 0.61) *** | 0.01 (-0.16, 0.17) |
| Other | 65 (17.7) | -0.36 (-0.66, -0.06) *** | -0.52 (-0.82, -0.21) *** | -0.25 (-0.54, 0.04) ** | 0.11 (-0.14, 0.35) | 0.85 (0.57, 1.12) *** | 0.22 (0.02, 0.42) *** |
| Self-Judged health status | |||||||
| Getting worse | 9 (2.4) | -0.08 (-0.83, 0.66) | 0.00 (-0.63, 0.63) | -0.41 (-0.98, 0.17) | 0.18 (-0.38, 0.74) | -0.53 (-0.98, -0.08)** | 0.12 (-0.29, 0.53) |
| No Improvement | 62 (16.8) | -0.48 (-0.78, -0.18) *** | -0.34 (-0.62, -0.05)** | -0.25 (-0.53, 0.03) * | -0.05 (-0.28, 0.19) | -0.27 (-0.50, -0.03)** | 0.16 (-0.03, 0.36) * |
| Good# | 253 (68.8) | ||||||
| Very Well | 44 (12.0) | 0.44 (0.17, 0.72) *** | 0.10 (-0.21, 0.40) | 0.88 (0.57, 1.18) *** | 0.29 (0.01, 0.56) ** | 0.91 (0.63, 1.20) *** | 0.60 (0.36, 0.84) *** |
| Expectation for services | |||||||
| Low | 45 (12.2) | -0.35 (-0.75, -0.14) *** | 0.01 (-0.33, 0.35) | -0.69 (-0.97, -0.41) *** | -0.46 (-0.73, -0.19) *** | 0.24 (-0.05, 0.52)* | 0.27 (0.01, 0.53)** |
| Medium# | 179 (48.6) | ||||||
| High | 144 (39.1) | -0.09 (-0.31, 0.12) | -0.32 (-0.54, -0.11) *** | 0.44 (0.22, 0.64) *** | 0.18 (-0.02, 0.39) * | 0.40 (0.18, 0.62) *** | 0.08 (-0.06, 0.22) |
| Perceived possibility for appointment | -0.16 (-0.34, 0.03)* | ||||||
| Yes# | 242 (65.8) | ||||||
| No | 126 (34.2) | -0.76 (-0.97, -0.55) *** | -0.57 (-0.79, -0.35) *** | -0.34 (-0.54, -0.13) *** | -0.54 (-0.71, -0.26) *** | -0.00 (-0.14, 0.13) | |
| Have information to choose care provider | |||||||
| Yes | 38 (10.3) | 0.64 (0.43, 0.86) *** | 0.70 (0.42, 0.96) *** | -0.77 (-1.08, -0.46) *** | -1.34 (-1.67, -1.02) *** | 2.28 (2.13, 2.44) *** | 1.8 (1.62, 2.01) *** |
| No# | 330 (89.7) | ||||||
| Consultation duration | 0.01 (-0.00, 0.01) | 0.01 (-0.01, 0.01) | 0.01 (0.01, 0.02) *** | 0.01 (0.01, 0.02) *** | 0.01 (-0.00, 0.02) | -0.01 (-0.05, 0.04) | |
| Satisfaction score | 0.22 (0.12, 0.33) *** | 0.14 (0.00, 0.28) ** | 0.42 (0.32, 0.51) *** | 0.38 (0.25, 0.50) *** | 0.46 (0.38, 0.55) *** | 0.23 (0.13, 0.32) *** | |
In the multiple linear regression model, patients who self-judged their health status as “very well” had a 0.6 units higher score (p≤0.001) for prompt attention compared to those with a “good” self-judged status. Respondents who were uncertain about the possibility of appointments when needed scored 0.57 units lower (p≤0.001) in patient-centered communication. Similarly, patients lacking information to choose their healthcare provider had a 1.34 units lower score (p≤0.001) in the patient-centered care environment than those with information.
The findings obtained from the focus group discussions offer valuable insights into various aspects of responsiveness to healthcare. The results revealed distinct themes and subthemes that were systematically categorized within the six pre-classified components of responsiveness, and one newly emerged theme. These findings contribute to a refined understanding of the healthcare experiences and perceptions of the participants.
1. Autonomy:
Under the theme of autonomy, the emergent subtheme of lack of shared decision making was identified as a concern among participants. They expressed frustration with the discharge of patients without improvement and perception of excessive referrals. Participants highlighted instances in which care providers made decisions without adequate patient assessment, thereby limiting their involvement in the decision-making process. A participant from Arba Minch shared his father’s experiences with Arba Minch Hospital. He stated that his father was discharged from the hospital, despite not showing any improvement after completing his medication.
2. Prompt attention:
Four subthemes were identified: carelessness, insensitivity to time, transportation difficulties, and enhanced reception services. Participants reported instances of carelessness and insensitivity to time on the part of providers, which led to negative consequences, such as missed work and denial of treatment. One participant described a significant incident that occurred while caring for his sister at a hospital. The situation involved a young woman who required intravenous (IV) infusion but had exhausted the available glucose supply in the cannula, resulting in distress. Another participant from Sawula Hospital expressed his concerns, stating, “If they do not know you personally, they will tell their assistant to give you a bed and then they leave… When you come back after buying the prescribed medications, they are already gone; who can help you then?" On the other hand, transportation challenges were identified, particularly the difficulties of carrying patients over long distances using a traditional stretcher locally known as Kareza. However, there were improvements in hospital reception services following the implementation of business process reengineering (BPR).
3. Quality of basic amenities
The subtheme of Unsafe Night arose from concerns regarding basic amenities, specifically in relation to noise and light-related issues. Participants shared their experiences of how noise from adjacent rooms and overcrowded single rooms affected their inpatient experience. Furthermore, light-related problems were identified as causing delays in care and restricting caregivers’ movement. A discussant from Chencha recounted his experience, stating, “I came with my wife, but there was no power. We had to wait a long time. The darkness is more disturbing than our pain at night, as caregivers fall in the rooms due to the absence of light." Although progress has been made in improving the physical structure, decentralized payment centers, and hospital cleanliness, much work remains to be done to address these concerns.
4. Provider choice:
The subthemes that emerged in relation to provider choice were perceived provider competence, limited choices, and weak supervision. These were explored through codes such as professional ethics, concerns about diagnosis and drug prescriptions, and low trust in the quality of healthcare providers’ training. In addition, the challenges faced when choosing providers are discussed, including issues such as shortages, turnover, and doctor fatigue. However, a positive anecdote from Chencha Hospital highlighted recent acts of doctors, with one participant commenting, " … A doctor donated his blood to her and saved her life. This was a humane and worthwhile deed in God’s and our eyes."
5. Dignity:
The subthemes of discrimination, mistreatment, and insecurity were identified within the dignity component. Participants acknowledged a decrease in discrimination following the implementation of business process reengineering (BPR), with instances cited from previous experiences of healthcare providers prioritizing individuals they knew personally. Experiences of mistreatment and insecurity were also disclosed, underscoring the need for further improvement. One participant highlighted the significance of the provider approach, declaring, "The best thing for a human being is giving hope…and if you have a good approach, the patient who is dying may recover. But if you insult him… he would rather like to die."
6. Social support:
The subthemes identified regarding social support were a lack of empathy and short visiting periods. Respondents conveyed that hospital personnel appeared to be less attentive and allowed insufficient visiting time despite a substantial demand for visits. Additionally, instances of inadequate cooperation with family caregivers have been acknowledged. One such instance was recounted by a participant from Arba Minch Hospital, where a university student attempted to return to her friend’s hospital room but was denied entry by the guard because she forgot her caregiver’s badge at the hospital when she left for an exam at her university. This incident was presented as an indication of low empathy among hospital staff. Furthermore, despite a significant number of family members and relatives visiting the hospitals, their visiting times were brief. One participant expressed the challenges they faced: “When my relatives visited me on weekends, it was overcrowded at the entrance door, and the allowed visiting time was from 2:00 PM to 3:00 PM” (Discussant from Arba Minch Hospital).
7. Desired service development
The discussion on desired service development revealed two key sub themes: accessibility and coordination of services and improvements to basic amenities. Participants emphasized the importance of healthcare resource availability, prompt and coordinated care, and well-organized services. Additionally, there was strong desire for improved basic amenities, including cafeterias, food shops, and a clean, well-structured hospital. These improvements were highlighted as essential for enhancing the overall healthcare experience.
This study used a mixed-methods approach to investigate healthcare responsiveness in Gamo Gofa zone, South Ethiopia. The results highlighted the levels of responsiveness across various dimensions and identified crucial factors affecting healthcare services in the area. The quantitative analysis uncovered key components shaping responsiveness, such as patient-centered communication, prompt attention, and a patient-centered care environment. Additionally, the qualitative analysis offered rich contextual insights into lived experiences and perceptions of healthcare responsiveness in the region. By triangulating these findings, this study contributes to the understanding of the challenges and opportunities for improving healthcare responsiveness and enhancing the quality and patient-centeredness of healthcare services in resource-limited settings.
The present study had several strengths and limitations. The mixed-methods approach was crucial in providing a comprehensive understanding of healthcare responsiveness, as it acknowledged that responsiveness is influenced by various factors and contexts (Kong et al., 2018; Sabina Nuti & Anna Maria, 2017). While the survey, through PCA, explained 58.1% of the variances in responsiveness, the mixed method allowed for more in-depth exploration. The quantitative analysis provided a robust foundation for understanding the structural dimensions of healthcare responsiveness, but the qualitative insights from focus group discussions revealed underlying factors and experiences not captured by the survey. The PCA uncovered latent constructs that were not immediately apparent through descriptive statistics or bivariate analyses, enabling more targeted intervention on specific aspects of healthcare services (Kong et al., 2018). However, it is crucial to recognize that this study had certain limitations. For instance, the possibility of social desirability bias cannot be ruled out considering that the study participants were interviewed within a healthcare facility. Additionally, reliance on parents or caregivers may lead to surrogate bias when assessing children’s experiences. Therefore, caution should be exercised when interpreting the results.
The findings revealed that confidentiality and dignity received the highest mean scores for outpatient and inpatient health services, respectively. This aligns with the results of previous studies (Ebrahimipour et al., 2013; Forouzan et al., 2016; Kapologwe et al., 2020; Negash et al., 2022b; Ogaji et al., 2020). The qualitative section of the study did not reveal any subthemes related to confidentiality, which may imply that patients either trusted their hospitals to maintain their privacy or that this was not a prior concern for them. Conversely, dignity was related to a decrease in the experience of discrimination and the need for improvement in mistreatment prevention, particularly in outpatient healthcare settings.
In contrast, the least favorable ratings were given to prompt the attention and quality of basic amenities for outpatient and inpatient services, respectively. This finding is consistent with previous studies (Coronado-Vázquez et al., 2022; Forouzan et al., 2016; Hamid & Begum, 2019; Teymori et al., 2023). Qualitative data revealed several challenges associated with prompt attention such as carelessness, insensitivity to time, and transportation problems. These findings underscore the difficulties of providing prompt care, particularly in emergency situations and pain management. Additionally, the quality of basic amenities was notably lower in the current study, in line with other studies (Ebrahimipour et al., 2013), which may be attributed to resource constraints. This may be because the primary focus is on ensuring the availability of services, rather than providing high-quality amenities.
Provider choice and social support were rated the second lowest for outpatient and inpatient health services, respectively. However, only a small number of patients reported sufficient information to make informed decisions regarding their healthcare providers. This finding is consistent with those of previous studies (Dadgar et al., 2018; Melo et al., 2017; Negash, Atnafu, et al., 2022a). The findings of the qualitative analysis indicated that several elements had an impact on the selection of a healthcare provider, including the perceived level of expertise of the provider, limited choices available when selecting a provider, and perceived inadequacy of supervision. These findings are consistent with those of previous studies (Kozikowski et al., 2022; Tateke et al., 2013). Furthermore, a lack of empathy and brief visiting hours for families and/or relatives challenged the social support provided for inpatient services. Therefore, it is crucial for healthcare providers and hospital staff, including guards, to demonstrate empathy to improve the responsiveness of services (Tateke et al., 2013; Tsang, 2013).
PCA revealed that patient-centered communication played a significant role in explaining the variance in outpatient service responsiveness. Furthermore, qualitative insights indicated that patients were concerned about their limited participation in decision-making processes, which hindered their ability to effectively communicate their perspectives. This lack of involvement has led healthcare providers to make decisions without considering patient concerns, values, or goals (Laurisz et al., 2023; Vahdat et al., 2014). Therefore, fostering patient-centered communication is crucial for healthcare providers to understand patients’ needs and provide appropriate care that aligns with their expectations (Kwame & Petrucka, 2021; Naughton, 2018; Rathert et al., 2017). Ultimately, improving patient-centered communication contributes to a more responsive healthcare experience and person-centered care (Kwame & Petrucka, 2021; Naughton, 2018).
In addition to patient-centered communication, patient-centered care environments (PCCE) have emerged as key factors in explaining the variance in outpatient service responsiveness. Qualitative insights highlight various aspects of patients’ healthcare experiences such as cleanliness, space availability, provider choice, waiting times, and privacy. Patients’ perceptions of these environmental factors significantly affect their overall responsiveness, thereby affecting their sense of dignity, comfort, and satisfaction (Carthon et al., 2020; Greene et al., 2012). Addressing concerns about crowded waiting areas, limited privacy during examinations, and inadequate facilities is necessary to improve PCCE and provide a positive and respectful healthcare experience for patients (Greene et al., 2012). Enhancing patient-centered communication and the physical environment are vital for creating a healthcare system that not only meets clinical needs but also ensures a positive experience for patients, ultimately achieving a truly patient-centered approach (Greene et al., 2012).
Prompt attention was a critical component of responsiveness, as identified by PCA, and it was the lowest-performing component in the level of responsiveness, highlighting significant areas for improvement. This aspect was essential for high-quality outpatient care, as transportation duration played a key role in its variability. The qualitative findings revealed several obstacles affecting prompt attention, including careless medication administration, time insensitivity, and transportation challenges. Issues such as healthcare providers’ punctuality and absenteeism exacerbate these problems, potentially stemming from organizational culture, resource constraints, and motivational factors. Transportation difficulties significantly affect prompt attention and patient access, which is consistent with previous studies (Stewart Williams et al., 2020). However, improvements in reception services following business process reengineering have positively affected emergency care and patient distribution. Addressing these issues requires a comprehensive approach that considers organizational culture, resource allocation, and staff motivation. By addressing these underlying factors, healthcare systems can become more responsive and patient-centered, ultimately leading to improved patient satisfaction and outcomes (Pantoja et al., 2017).
The determinants of responsiveness included sociodemographic variables, such as occupation, ethnicity, marital status, wealth score, and self-judged health status, which collectively accounted for over one-third of the identified factors, consistent with previous studies (Stewart Williams et al., 2020; Valentine et al., 2015). Additionally, service-related factors, including satisfaction, consultation duration, and perceived possibility of further appointments, were crucial in shaping responsiveness perceptions. This finding is consistent with that of previous studies (Negash et al., 2022a). Furthermore, means of transportation, which reflect community characteristics, emerged as a statistically significant determinant of responsiveness to outpatient services. This highlights the importance of considering both micro- and macro-environments when assessing healthcare responsiveness (Mirzoev & Kane, 2017).
Our study uncovered significant disparities in healthcare responsiveness, emphasizing the importance of patient-centered communication, prompt attention, and patient-centered care environments as crucial components. In terms of responsiveness levels across various dimensions, dignity and confidentiality received the highest ratings, particularly for inpatient and outpatient care. Conversely, the basic amenities for inpatient care and prompt attention to outpatient services had the lowest scores. Notably, prompt attention has emerged as a critical, yet underperforming component, highlighting the need for targeted interventions to address systemic delays and inefficiencies. In addition, the qualitative insights have highlighted challenges such as healthcare providers’ time insensitivity, inadequate facilities, and limited involvement in decision-making. To address these gaps and enhance healthcare quality in the Gamo Gofa Zone, a comprehensive approach involving improvements in healthcare providers’ time management, facility adequacy, privacy measures, and communication practices is essential. Collaborative efforts are vital for addressing the identified gaps, focusing on patient-centered care and prompt attention.
| Views | Downloads | |
|---|---|---|
| F1000Research | - | - |
|
PubMed Central
Data from PMC are received and updated monthly.
|
- | - |
Provide sufficient details of any financial or non-financial competing interests to enable users to assess whether your comments might lead a reasonable person to question your impartiality. Consider the following examples, but note that this is not an exhaustive list:
Sign up for content alerts and receive a weekly or monthly email with all newly published articles
Already registered? Sign in
The email address should be the one you originally registered with F1000.
You registered with F1000 via Google, so we cannot reset your password.
To sign in, please click here.
If you still need help with your Google account password, please click here.
You registered with F1000 via Facebook, so we cannot reset your password.
To sign in, please click here.
If you still need help with your Facebook account password, please click here.
If your email address is registered with us, we will email you instructions to reset your password.
If you think you should have received this email but it has not arrived, please check your spam filters and/or contact for further assistance.
Comments on this article Comments (0)