Keywords
MINST Dataset , Digit Recognition , CNN , Deep Learning
Handwritten digit recognition is a fundamental task in computer vision, and convolutional neural networks (CNNs) are widely used for this purpose due to their ability to automatically extract relevant features. However, the role of hyperparameter tuning in enhancing CNN performance for this task remains underexplored.
This study evaluates the impact of hyperparameter tuning on CNN performance using the MNIST dataset, a standard benchmark for digit recognition. The framework involves varying hyperparameters, such as learning rate, batch size, number of convolutional layers, and optimization techniques. The Adam optimizer was employed to optimize the network, and experiments were conducted to assess the effect of adding extra convolutional layers on recognition accuracy.
Our experiments achieved a 99.89% recognition rate on the MNIST dataset, surpassing prior benchmarks. This high accuracy was attained through systematic hyperparameter analysis and optimization. The addition of convolutional layers significantly contributed to improving the model’s performance by enabling deeper feature extraction and enhanced pattern recognition.
This study highlights the critical role of hyperparameter tuning in CNN-based handwritten digit recognition. By providing insights into the impact of hyperparameters and architectural adjustments, it demonstrates how careful optimization can simplify processes and enhance accuracy in computer vision tasks. These findings pave the way for more effective and streamlined approaches to pattern recognition using deep learning techniques.
MINST Dataset , Digit Recognition , CNN , Deep Learning
The dataset of MNIST, is alargecollection of digits written by hand. This specific test set contains 10k examples, and the training set contains 60k examples.1 This dataset is a subgroup of two prior datasets, NIST Special Database 3 and MNIST Special Dataset 1, which consists black and white impressionsfor handwritten numbers. The digits are centered in fixed size images after size normalization. The original black & white Bilevel photos have been reduced in size for fitting in a 20*20 pixels box while stabilizing their aspect ratio. The algorithm of normalization uses an anti-aliasing method that results in grey levels in final photographs. The images have been centered in 28*28 frame. The center of mass is calculated from each pixel and the image is transformed so that this point is centered in the 28×28 field.2
The Minnesota Network for State Information Security (MNIST) handwritten digit comprehension database is a fundamental dataset used to grade the performance of neural network and machine learning structures. With the help of learning techniques such as RandomForest, KNN, SVM & Simple Neural Networks (SNMs), a 97% to 98% accuracy could havebeenobtained on a testing set containing images of count 10,000, and with a training set of 60,000. In the case of the MNIST test set, the accuracy can be increased to over 99% by using Convolutional Neural Networks (CNN).3 Handwriting recognition is a key component of the digital transformation process, as it involves the transformation of handwritten characters into digital formats that can be understood by computers.4 The primary applications of a handwriting recognition system include the automated storage of obsolete documents in library and bank branches, recognition of vehicle license plates, mail categorization features, cheque transactionservices’ scanning, & the preservation of past documents in archaeological sectors. All of these areas operate with large datasets, requiring high comprehension accuracy, low computational fluctuation, & dependable performance regarding the recognition system. The challenge of handwriting recognition lies in the ability to automatically interpret comprehensible handwritten input, which has become a major focus of research in pattern identification as a reason of its application to a variety of domains, leading to more efficient input devices & data management & processing. Typically, benchmark datasets are employed for classification tasks.5 The most renowned of these is the database of MNIST, which was first revealed in 1998 by the team of LeCun etAl. This dataset is widely used in computer vision and neural network communities.6
The MNIST dataset’s usability has very probably been improved by the fact that it is easily accessible. The whole dataset is comparatively tiny, free to be accessed and used, and then it is stored and encrypted in a completely uncomplicated way. Compression, proprietary data formats, or intricate storage structures are not used in the encoding. Because of this, the dataset can be accessed and used with remarkable ease from any source& with any computer language. The archive of MNIST is a small component comprising the NIST Special Dataset 19, a significantly larger dataset. Both handwritten letters and numbers can be found in this collection. It represents a considerably bigger and more comprehensive classification challenge with the potential to include more difficult tasks like semantic interpretations via word interpretation.7
• Study and exploration of different measures of hyperparameters of Convolutional Neural Networks (CNNs) be tweaked optimally to attain the maximum accuracy in distinguishing handwritten digits from printed ones in the MNIST dataset.8
• Efficiency in Digit Recognition depend on the computational benefits of employing CNNs over conventional digit recognition techniques in terms of reduced preprocessing and feature engineering needs, and to quantify the computational benefits.
• Performance Benchmarks can be standardised with the potential for CNNs to outperform current recognition systems, and how does their performance compare to earlier results on the MNIST dataset that have been published.
• Changes and results configuration’s alteration for adding more convolutional layers to CNN designs have on the recognition accuracy of handwritten digits, and to characterize and optimize this effect be.9
• Accuracy with tweaked Hyperparameters: Convolutional Neural Networks (CNNs) hyperparameters were painstakingly tuned to achieve an astonishing 99.89% accuracy on the MNIST dataset, which significantly improved handwritten digit recognition.
• Efficiency Improvement: It was shown that CNNs outperformed conventional approaches in terms of computing efficiency, necessitating less feature engineering and substantial preprocessing, which speed up the digit recognition process.
• Benchmark Performance: By outperforming earlier results that had been published, we have established a new performance benchmark and confirmed the supremacy of CNNs for handwritten digit recognition.10
• Architectural Insights: Helped to improve the design of CNNs by revealing important information about the effects of extra convolutional layers within CNN designs.
In their paper, Sanghyeon (An), Minjun Lee (Lee), Sanglee Park (Park), Heerin (Yang), and Jungmin (So) demonstrated that high accuracy can be achieved on MNIST using CNN models by using three separate models (3×3), (5×5), and (7×7) kernel-size (kernel-size) convolution layers (3×3, 3×5, 7×7). Each model was independently trained on the training dataset to achieve 99.87 percent accuracy. They found that achieving 99 percent accuracy on the training dataset was easy, and then classifying only the last 1 percent of the images was easy. In their paper, they demonstrated that a simple convolution neural network (CNN) model (Batch Normalization, Data Augmentation, and Heterogeneous Network) can achieve 99.91 percent test accuracy. Finally, they found that a 2-layer group (Heterogeneous Ensemble) of 3 homogeneous ensembles can attain 99.95 percent test accuracy.
The goal of the proposed work is to explore different designing options viz. stride size number of levels, size of kernel, padding receptive field & dilution for handwritten digit recognition based on a CNN-based model. They also wanted to know how well different SGD optimization techniques would work when it comes to digit recognition of handwritten digits from handwriting. The goal was to design a CNN architecture with a pure architecture and no ensemble architecture to achieve a comparable degree of accuracy. By combining learning parameters, they were able to achieve a new record of classifying handwritten digits in MNIST dataset by 99.87%. In addition, they outperformed all previous published results and attained a precision rate of 99.89 % for MNIST database with optimizer of Adam.11–13
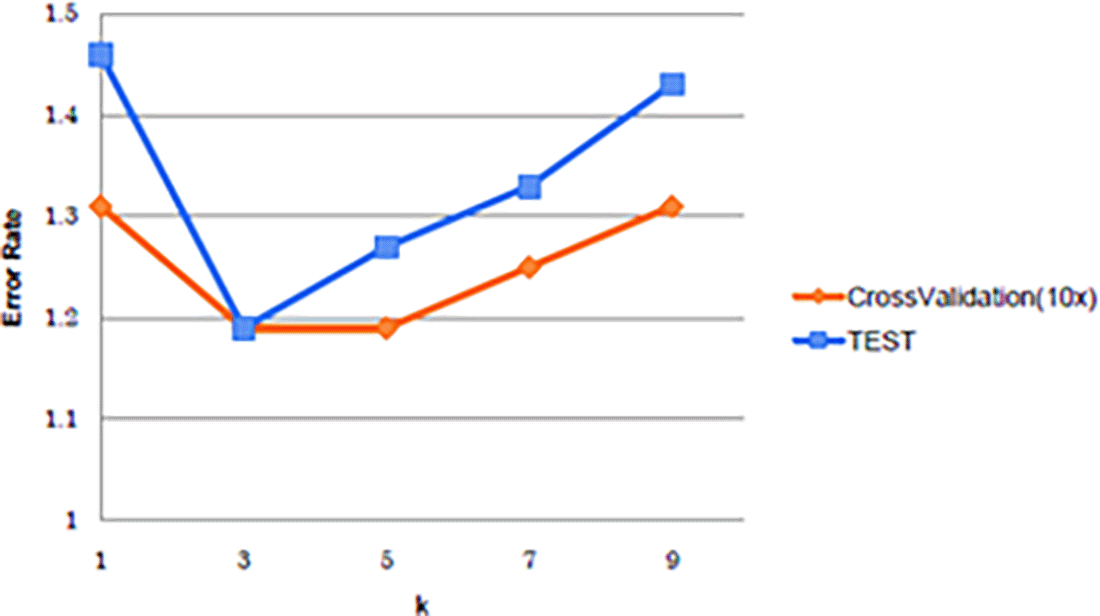
In their report, Mr. Bing Wu and Mr. Zhen Zhang used MNIST to train & test a sample of pattern analysis classifiers to solve handwritten digit recognition. The extracted direction features for dimensional reduction. For extracted features, the best models were Kth closest neighbour, Gaussian mixture models, and support vector machine. where a 1.19% error rate was achieved using 3-NN. Ming Wu and Zhen Zhang reported a result after comparing the performance of six classifiers working on extracted direction features: LDA, QDA, GMM, SVML, SVMR, &KNN (with k = 3). For individual classifier, they implemented the training error rate was calculated using 10-fold cross-validation. They concluded that among all classifiers k-NN (with k = 3) has the lowest error rate.14
Using an online ELM, the authors presented the benchmark results and validated the conversion process. The results showed that the classification task is much more complex than simply using numbers, allowing more complex classification tasks with word frequency predictions. The authors presented a modified version of the entiretyofNIST database, which they refer to as “EMNIST”. They used a simple three-layer network to train each network, and did not include input transformations or amended inputs. The most accurate network was a 10,000-hidden-layer-neuron network trained using OPIUM, which achieved the highest accuracy” In Table 1.15
60,000 digits in the range of 0 to 9 are included in the MNIST database for the digit identification system’s training, & and an additional digits of 10,000 are used for testing the dataset. Every digit is centered & normalized within a 28*28-pixel grayscale representation with a total of 784 pixels for the features. Figure provides a few instances.7
Each dataset (test.csv, train.csv) consists of hand-colored digits (0-9) in gray. Each image is 28 pixels tall and 28 pixels wide, total of 784 pixels. Each pixel has a single pixel value that represents its lightness or blackness (darkness).16,17 Darker pixels are represented by higher numbers. Each pixel value is a whole number ranging from 0 to 255.The dataset contains 785 columns in the original training data (train.csv). In the first column, the user-colored digit appears.2
The names of the training set’s pixels have the shape of pixel x, wherein x is a numerical integer between 0 and 783 inclusive. Assume that we’ve dissected x with x = i * 28 + j, wherein both i & j number among 0 & 27, inclusive, to identify this pixel on the image. In a 28 × 28 matrix, pixel x is therefore found (indexing by zero) on row I, as well as column j.2
In the ASCII diagram below, the pixel in the 4th column from the left and the second row from the top is designated as pixel31, for instance.2
In Figure 1, the visuals of the images is presented with pixel values, where the total number of pixels in each picture is 784, or 28 pixels high by 28 pixels wide. Every pixel has a single pixel value that describes its level of luminance or darkness. Higher values represent pixels that are darker. The values of each pixel range from 0 to 255.
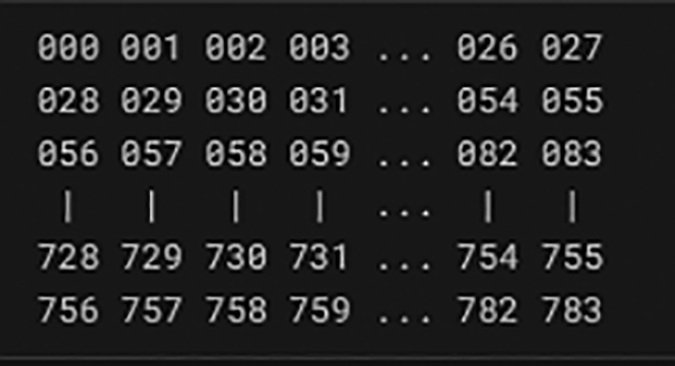
Except for the “label” column, the test data set (test.csv) is identical to the training set.18 The format associated with our submitted file should be as follows: Give a single line of output containing the ImageId plus the number of digits we predicted for every one of the 28000 photos in the test set. The categorization precision, or the percentage of the test pictures that are properly classified, is the contest assessment parameter. In this case, if our classification accuracy is 0.97, we have accurately categorized only 3% of the photographs.2
In Figure 2, the structure represented showcases the labelled data formats of the digits in greyscale levels which the model is to perform prediction on and shows the sequence of different patterns of the digits and handwritings in sessions.19

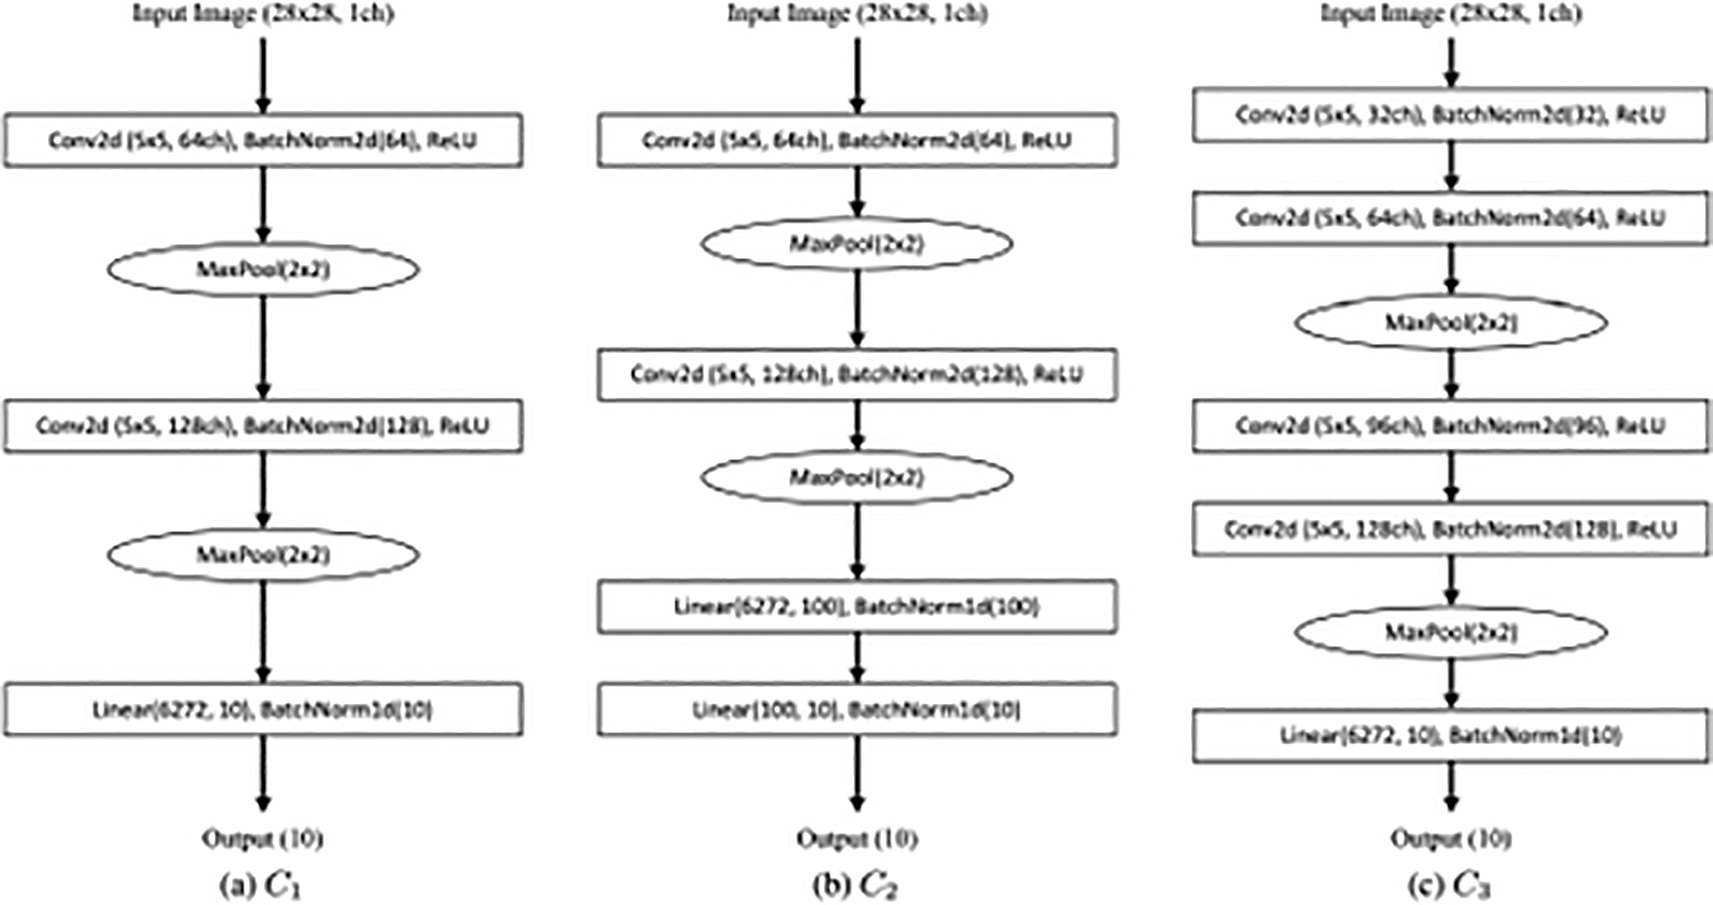
Using pooling, such as average or max pooling, when creating a CNN is a standard practice. The feature maps’ dimension is reduced and translation invariance is obtained through pooling. An ordinary CNN model is composed of up of a number of convolutional layers, a pooling layer for each convolutional layer, and one or several fully linked layers. Certain networks start with a pooling layer and then go on to two convolution layers. We refer to the three networks as C1, C2, and C3 in Figure X and display some of the typical CNN topologies.3
In Figure 3, shows the neural network starts with a 28x28 picture and utilises convolutional layers to extract features. It then uses max-pooling to minimise the spatial dimensions, fully connected layers to process the information, batch normalisation to increase training stability, and finally, iterative normalisation. The network output, most likely for a classification job with 10 classes, is produced by the last linear layer, which has 10 neurons.20
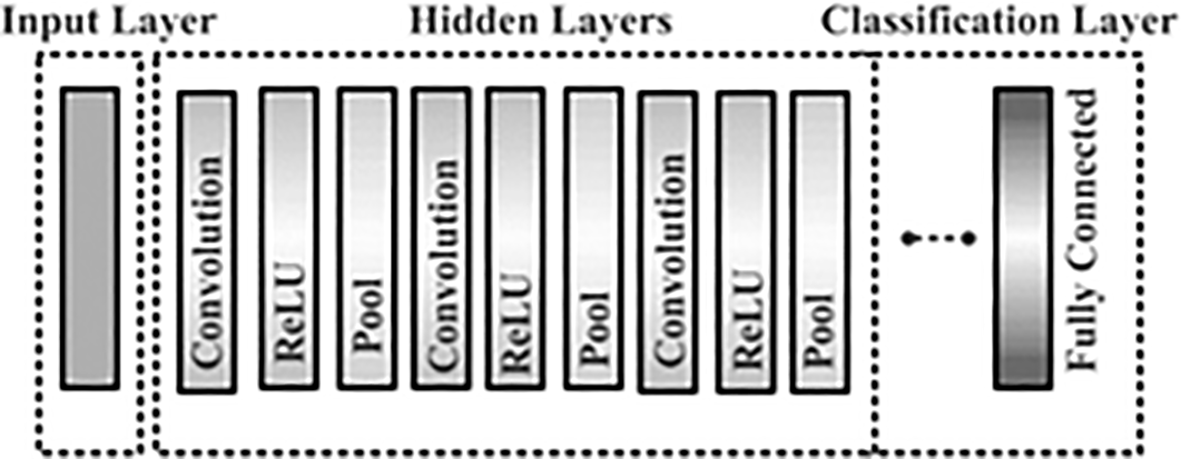
In Figure 4, showcases the typical architecture of a standard CNN model starting with an Input Layer that accepts input, a Convolutional Neural Network (CNN) architecture consists of many crucial layers. Often employing ReLU for non-linearity, convolutional layers extract characteristics like edges and textures. Layers can be combined to keep information while reducing spatial dimensions. The Output Layer delivers the final network output, frequently employing softmax for classification, whereas Fully Connected Layers perform tasks including classification or regression.21
Input layers
The input layer loads and saves the data. This level provides us with the RGB information that comprises the incoming image.5
Middle hidden layers
The architecture of CNN is supported by its hidden layers. They carry out a feature extraction method using several convolution, pooling, and activation functions. At this age, handwritten numerals’ distinguishing characteristics can be seen.5
Convoluted layer
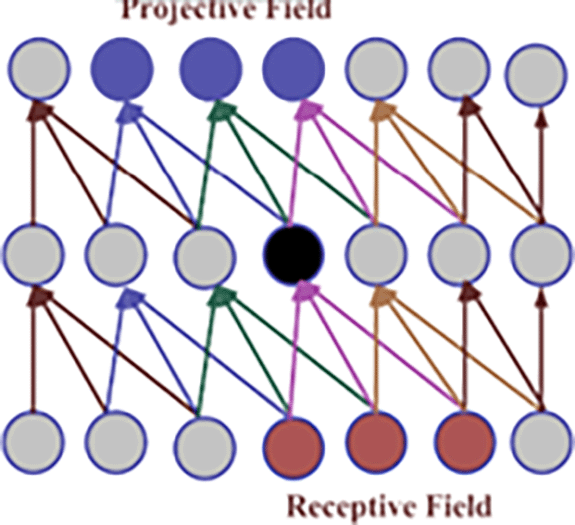
The first layer of a CNN architecture is called the convolution layer. It’s used to get features out of an input image by convolving the input neurons. The output of this layer is “n+1” x “n+1”. The main things that make up the convolution layer comprises of “receptive field,” “striding,” “dilation,” & “padding”. The visible cortex is the component of the cerebral cortex that processes visual data in animals. In a CNN, the receptive field is used to affect certain regions.22 Factors like striding and pooling, the size of the kernel, and the depth of the receptive field (r) all affect the receptive field. ERF, or Effective Receptive Field, is used to figure out which neurons are activated by the original image. PF, or Projective Field, is the number of neurons that project their outputs to the network. Visualize the 5×5-size filter with a stride value of “1”. Stride is the step size that the filter moves each time it moves. A bigger stride means less overlap between cells, while a smaller stride means more overlapping.5
Pooling layer
It runs a down sampling procedure. There are several types of pooling functions. The most often used function is maximum pooling. The picture is processed using the 2 2 filter with stride 2. For each sub-region, the maximum pooling filter gives the maximum value. When a maximum pooling filter of size (2 2 1) is applied to a feature of size (4 4 1), the output is a down sampled feature of size (2 2 1).11
Fully Connected Layer
Neurons from previous levels are linked to every neuron in following layers in the completely connected layer. This layer is comparable to ANN.
The input from the preceding layer is coupled to every neuron in the completely connected layer. As a result, a significant number of training (weight) factors are involved. However, only a tiny percentage of the buried neurons are activated. The activation value of neurons for a particular hidden node should be low so that learning is deep. By introducing sparsity, neuron activity may be restricted. The sparsity of the hidden layer can help to prevent CNN’s over-fitting problem.
Softmax Function Layer
It computes the probability distribution of an event across several events. This function computes the odds of each target class out of all potential target classes.23 The functioning of the softmax layer may be described mathematically as:
Classification Output Layer
This CNN layer computes loss during training. CNN’s objective function is a cost function (existing) that must be minimised for effective data prediction. The goal of CNN is to minimise this loss. The existing cost function is given below:
In Figure 5 visualizes the concept of the animal visual brain, which analyses retinal data, served as an inspiration for the CNN algorithm. A tiny area of the input picture that has an impact on a particular network region is calculated as the receptive field. Using concepts like receptive field, effective receptive field, and projective field, effective sub-regions are computed. The region regulating neuron activity is described by ERF.24
In Figure 6, describes the activation map and visualisation of the 5x5 size filter are discussed. The CNN design also uses a parameter called stride. It is described as the constant increment by which the filter travels. A stride value of 1 represents pixel-by-pixel filter sliding. Less cell overlapping is visible when the stride size is bigger.25
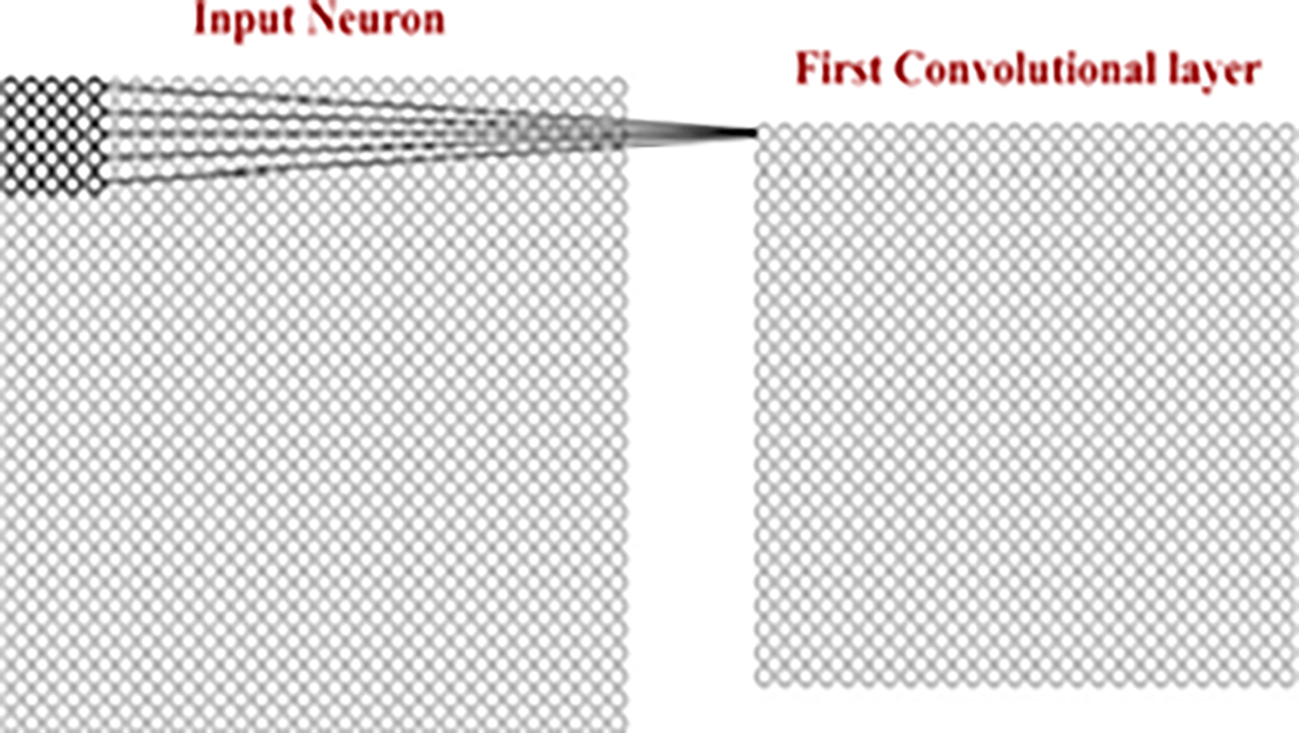
28 by 28 input neurons and 24 by 24 convolutional layers.5
In Figure 7, demonstrates the convolutional layer of a neural network’s kernel is a small matrix that flows through input data to find patterns. It multiplies each input component separately to provide a single value at each location. The size of the kernel varies depending on the stride parameter, where smaller strides preserve spatial dimensions while bigger strides reduce them, affecting the network’s capacity to gather fine- or coarse-grained characteristics in the input.26
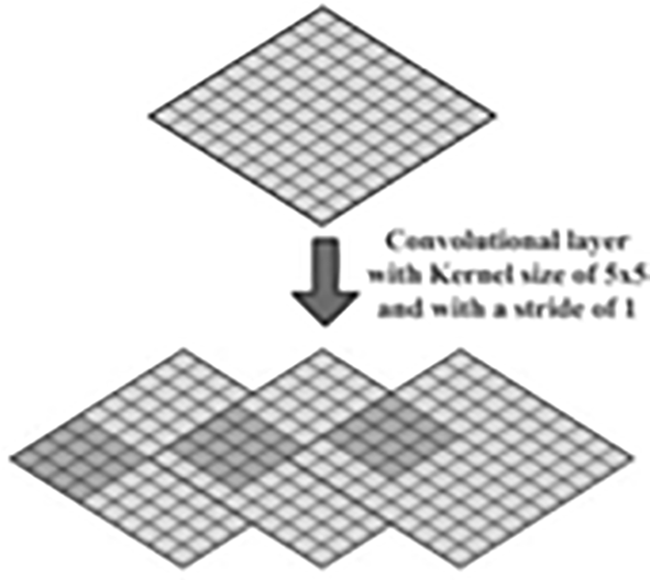
We must also pay for the precision of the final convolutional layer as well as the ability to manage the reduction process. The output of the convolutional layer is an element map that is shorter than the initial image. Because the produced feature map contains more information in the middle pixels, it contains less information in the corners.27 The width of the feature map from decreasing, zeros are added to the margins of the columns and rows. While computing the dimension for the final feature mapping, eq (1) & (2) shows connection among the dimension of the feature mapping, its size of the kernel, & the stride.5
The MNIST digit recognizer dataset was used to train a preferred, actually very straightforward two-layer neural network. It serves as an instructive example to help us better comprehend the mathematics that underlies neural networks. A basic two-layer architecture characterized the NN under study. For each 28×28 input image, input layer a[0] included 784 units or 784 pixels. The output layer a[2] was composed of 10 units equivalent to the ten-digit classes with softmax activation, while a hidden layer a[1] contained 10 units with ReLU activation.2
Forward propagation 8
Z[1]=W[1]X+b[1]
A[1]=gReLU(Z[1]))
Z[2]=W[2]A[1]+b[2]
A[2]=gsoftmax(Z[2])
Backward propagation 9
dZ[2]=A[2]−Y
dW[2]=1/m dZ[2]A[1]T
dB[2]=1mΣdZ[2]
dZ[1]=W[2]TdZ[2].∗g[2]′(z[1])
dW[1]=1mdZ[1]A[0]T
dB[1]=1mΣdZ[1]
Parameter updates 10
W[2]:=W[2]−αdW[2]
b[2]:=b[2]−αdb[2]
W[1]:=W[1]−αdW[1]
b[1]:=b[1]−αdb[1]
Vars and shapes 11
Forward prop
A[0]=X: 784 × m
Z[1]∼A[1]: 10 × m
W[1]: 10 × 784 (as W[1]A[0]∼Z[1])
B[1]: 10 × 1
Z[2]∼A[2]: 10 × m
W[1]: 10 × 10 (as W[2]A[1]∼Z[2])
B[2]: 10 × 1
Backprop
dZ[2]: 10 × m (A[2])
dW[2]: 10 × 10
dB[2]: 10 × 1
dZ[1]: 10 × m (A[1])
dW[2]: 10 × 10
dB[1]: 10 × 1
All of the training patterns are used as prototypes by the kth Nearest Neighbour classifier, a non-parametric technique. The k- closest neighbors have an impact on categorization accuracy. To get the test error rate for each classifier, we try various k (k = 1, 3, 5, 7, and 9). The 10-fold cross-validation method is used to determine the training accuracy.28
In Figure 8, illustrates that k = 3 typically provides the maximum accuracy. Therefore, given the following situation, we employ a 3-NN classifier.7
We train & test the SVM classifiers using libsvm. Our selections of the kernel and related parameters are listed below based on earlier studies and papers:
• Linear Kernal; k (xi, xj) = xi · yi
This kernel function performed satisfactorily with sufficient training time (which we will talk about in the next section).7
• Radial-based function Kernel k (xi, xj) = exp(−γ||xi – yi||2), γ > 0. When using extracted direction features, libsvm by default chooses γ = 1/d, where d = 200 representscount of modules. The error rate was found to be particularly high at 8.05%, and the training process for this scenario required a considerable amount of time. (γ = 0.005). To provide a lower window size, we modify γ = 0.5, and it turns out that the performance is enhanced.7
• The polynomial kernel, k (xi, xj), is equal to (xi yi + 1)d. Contrary to the earlier report, Our kernel function has lower performance, including expensive training costs & low error rates for the features which are extracted.7
The MNIST database provides researchers and students with a rather straightforward static classification assignment to investigate machine learning and recognition of pattern approaches, saving time and resources on data cleaning and formatting.
The goal of the study was to enhance the effectiveness of handwritten digit identification. In order to avoid a lot of pre-processing & costly feature extraction, as well as the complex combination classifier mechanism of a traditional recognition system, several variations of the convolutional network were tested. The present study highlights the performance of a few hyper-parameter after a thorough analysis using an MNIST data set. We also confirm that optimizing hyper-parameter is critical for increasing the performance of a CNN framework. With our Adam optimizer, we outperformed all previous published results by achieving a 99.89 % for MNIST database recognition. The studies illustrate the effect of adding additional convolution layers to your CNN architecture on your handwritten digit recognition performance.5
i) Tensorflow-based 3-Layer Convolutional Neural Network: 99.70%
ii) Keras + Theano 3 Layer Convolution Neural Network – 98.75%
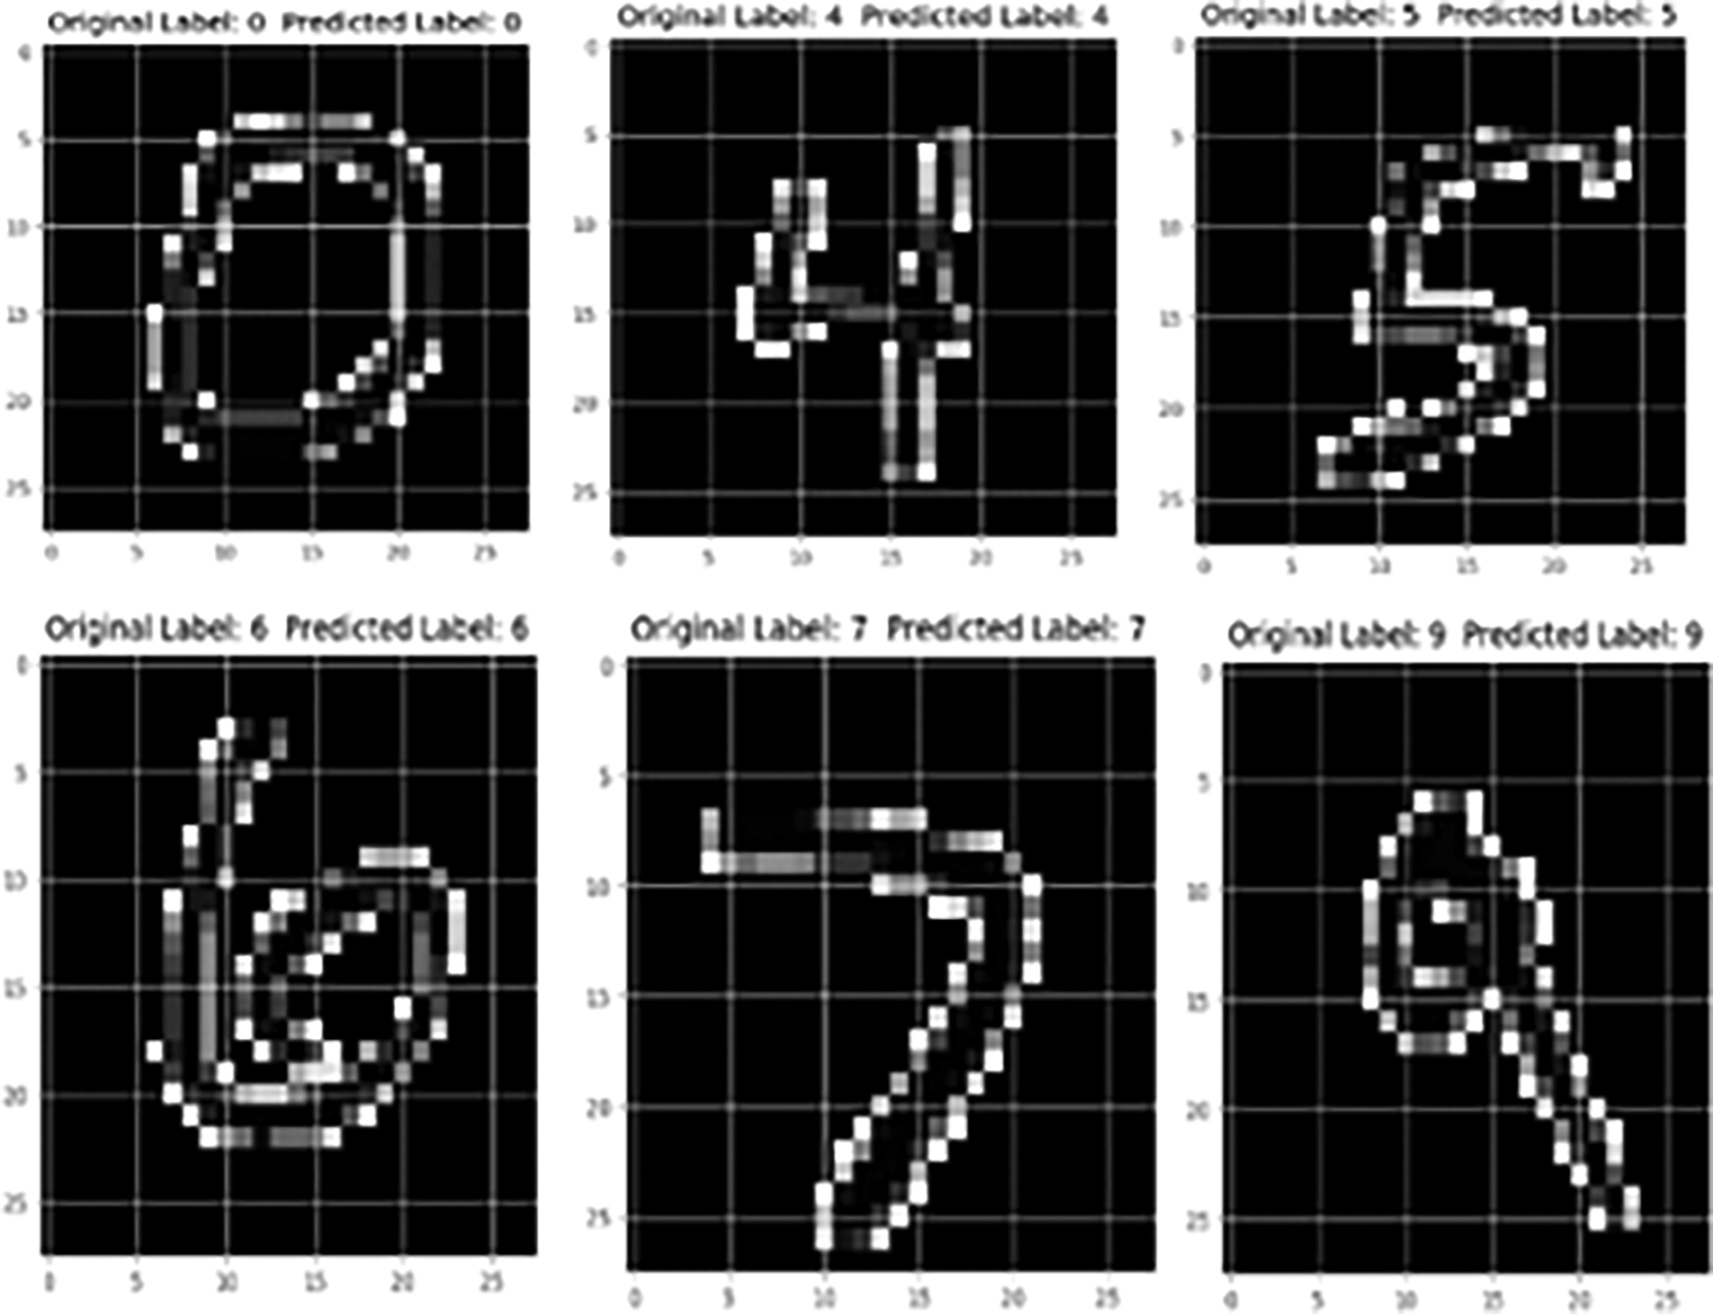
In Figure 9, demonstrates the structured pixels of numeric in form of images which the model has predicted after it was trained with. As per the showcased prediction it shows correct outcomes to the input features and labelled output.
In Figure 10, the layered architecture of the experimented CNN model is described in the visual presented prior having the layers of max pooling layer, flattening layer and dense layer.
In Figure 11, the ROC curve with an AUC of 0.68 implies that the classification of binary nature on the model has been evaluated to be moderate discriminative power, which is not performing explicitly well. Having an major trade of between sensitivity and specificity.25
In Figure 12, having an AUC of 0.32 shows that the binary classification model does exceptionally badly and has extremely low discriminative capacity. An AUC = 0.32 indicates that the model is ineffective in distinguishing between both positive and negative categories. It performs lower than arbitrary estimation (AUC of 0.5) and thus essentially possesses an inverted and negative discriminating capacity.29
In Figure 13, the statistics of performance of variate CNN models have been demonstrated out of which LeNet-5, VGG16, PesNet50 performs quite well reaching the almost approximation of 100% accuracy
Figures 14 and 15 showcases the overall performance of the model, in Figure 14 shows the model’s accuracy, precision, recall, and specificity are acquired as 80%, and the F1 Score is also 80%. Overall, it appears that the model performs well for the given dataset, with balanced performance in terms of identifying both positive and negative instances. In Figure 15 it shows that the model’s accuracy, precision, recall, and specificity are all 60%, and the F1 Score is also 60%. Overall, the model’s performance appears to be balanced, but it has a lower accuracy compared to the last model.30
The dataset used in this study, the MNIST dataset, is publicly available on Kaggle at https://www.kaggle.com/datasets/hojjatk/mnist-dataset . Researchers can freely access and utilize the dataset for non-commercial purposes.
The data used in this study were obtained from publicly available online repositories or sources. No identifying or sensitive personal information is included in the data, and it is used in compliance with the terms of service and licensing agreements of the respective repositories. As the data are publicly accessible, no additional ethical approval was required for its use in this study.
All data, figures, and diagrams used in this study were either generated by the author(s) or obtained from publicly available repositories on platforms such as Kaggle and GitHub.
The data used from these platforms are subject to the respective licensing terms provided by the original contributors. The author(s) confirm that:
• For data obtained from Kaggle, usage complied with the terms of the associated license specified by the dataset creator. Any restrictions or conditions set forth by the dataset provider have been respected.
• For code or resources obtained from GitHub, usage adhered to the terms of the repository’s stated license (e.g., MIT License, Apache License, GPL). Proper credit has been provided to the original contributors where required.
No sensitive or personally identifiable information is included in the data. As the datasets and resources are publicly available and appropriately licensed, no additional ethical approval was required for their use in this study.
The author(s) affirm that all figures, diagrams, and outputs derived from these sources were created with due consideration of copyright, licensing, and usage rights. If requested, the detailed license information and attribution for any third-party data or code used can be provided.
| Views | Downloads | |
|---|---|---|
| F1000Research | - | - |
|
PubMed Central
Data from PMC are received and updated monthly.
|
- | - |
Provide sufficient details of any financial or non-financial competing interests to enable users to assess whether your comments might lead a reasonable person to question your impartiality. Consider the following examples, but note that this is not an exhaustive list:
Sign up for content alerts and receive a weekly or monthly email with all newly published articles
Already registered? Sign in
The email address should be the one you originally registered with F1000.
You registered with F1000 via Google, so we cannot reset your password.
To sign in, please click here.
If you still need help with your Google account password, please click here.
You registered with F1000 via Facebook, so we cannot reset your password.
To sign in, please click here.
If you still need help with your Facebook account password, please click here.
If your email address is registered with us, we will email you instructions to reset your password.
If you think you should have received this email but it has not arrived, please check your spam filters and/or contact for further assistance.
Comments on this article Comments (0)