Keywords
ChIP-seq, CUT&RUN, CUT&Tag, bioinformatics, workflow, snakemake
ChIP-seq, CUT&RUN, CUT&Tag, bioinformatics, workflow, snakemake
As genome sequencing technologies and their applications continue to rapidly evolve to include epigenomic information, a vast amount of sequencing data is accumulating.1 Journals now commonly mandate the deposition of raw sequence data to public databases, such as the International Nucleotide Sequence Database Collaboration Sequence Read Archive (SRA), generating a substantial volume of sequencing data.2 These mandates are further supported by funding agencies, such as the National Institutes of Health (NIH), which requires NIH-funded research to publish sequence data as part of their Genomic Data Sharing Policy.3 Therefore, there is an increasing need for more comprehensive and biologically relevant data analysis workflows that promote reproducibility of results and allow for increased leverage and comparisons of publicly available data. Although mandated availability of data is beneficial to science, data analysis pipelines are often complicated, with divergent results due to variation in analysis steps, parameter usage, software used, and software version. These problems can partly be solved by workflow managers, which control for analysis step order, software versions via virtual environments, software parameters, etc. This is especially important for workflows requiring multiple analysis steps, such as sequence data produced by chromatin immunoprecipitation assays, where small differences in analytical steps can yield different results.
Chromatin immunoprecipitation followed by sequencing (ChIP-seq) is a technique commonly used to identify protein binding sites in the genome.4,5 Briefly, DNA associated proteins are chemically fixed onto DNA with a crosslinking agent. The resulting chromatin is then fragmented by either sonication or enzymatic digestion into 100-500 base pair fragments. Next, chromatin fragments bearing the protein of interest are immunoprecipitated using protein-specific antibodies. Typically, ChIP-seq experiments utilize two controls: (1) an input control to correct for differences in sonication and genomic DNA sequence bias and (2) a mock IP to account for nonspecific interactions of the antibody used.6–8 Ultimately, the chemical cross-link is reversed, allowing the DNA bound by the protein to be purified and then sequenced. In addition to ChIP-seq, other chromatin immunoprecipitation assays, such as cleavage under targets and release using nuclease (CUT&RUN) and cleavage under targets and tagmentation (CUT&Tag) are similarly utilized to assess protein binding sites.9,10 In CUT&RUN, antibody binding occurs directly on protein-bound DNA fragments within intact nuclei, with DNA fragmentation accomplished enzymatically using a fusion protein containing Protein A and micrococcal nuclease (MNase), in contrast with ChIP-seq’s reliance on sonication for DNA fragmentation. In CUT&Tag, a fusion protein combines Protein A and Tn5 transposase, allowing for simultaneous tagging and binding of sequencing adapters to protein-bound DNA fragments.
Following the unique approaches of ChIP-seq, CUT&RUN, and CUT&Tag in isolating protein-bound DNA, the generated DNA sequence data is aligned to a reference genome, and a peak caller is typically used to identify regions of interest. These peaks are “broad” for proteins with large areas of interactions with DNA, such as histones and DNA methylation interacting proteins (e.g. H3K27me3, H3K36me3, H3K9me3 H3K4me1, etc.). Conversely, proteins that act as transcription factors with sequence specific regions of interaction and select histone marks produce “narrow” peaks (e.g. c-Myc, CTCF, REST, H3K27ac, H3K4me3). Analyzing these different types of DNA binding proteins can sometimes call for different computational controls, requiring researchers to identify analysis software best suited for analyzing their data. Given the variation in how peaks are generated, there is a significant amount of statistical noise in these experiments, which can hinder the efficacy of peak calling algorithms. This is further complicated by sequencing issues associated with strand bias, GC content, PCR amplification, library preparation, primer choice, sequencing platform, and antibody choice.8,11–20 Consequently, it is increasingly difficult to reproduce or replicate experimental findings. From this point forward, “reproducibility” refers to an individual’s or group’s ability to generate the same findings as another study, whereas “replicability” represents an individual’s or group’s ability to recreate findings multiple times using the same data input. Overall, this highlights the need for consistent and controlled data analysis practices, ensuring reproducibility and replicability of results.
Here, we present Rocketchip, available at https://github.com/vhaghani26/rocketchip, to address key aspects of these problems. Rocketchip reduces variation in data analysis methodologies, increase reproducibility and replicability of experimental results, and encourage greater usage of publicly available sequence data.
Rocketchip is an automated bioinformatics workflow written in the Python-based (v3.10.12) workflow manager, Snakemake (v7.32.4)21 ( Figure 1). Rocketchip takes full advantage of Snakemake’s capabilities to ensure a highly flexible and adaptable workflow. By consolidating Snakemake rules from various software tools into a single file tailored to the user’s data, Rocketchip supports the seamless incorporation of new tools and updates. This design is crucial in the rapidly evolving field of bioinformatics, allowing Rocketchip to stay current with the latest advancements without requiring a complete overhaul of the existing pipeline. Additionally, Rocketchip efficiently handles large-scale genomic studies by leveraging Snakemake’s ability to process hundreds of files and utilize parallelization based on available computational resources. This makes it suitable for handling extensive datasets on high-performance computing (HPC) systems, ensuring that users can perform complex analyses with optimal resource allocation. Furthermore, Rocketchip utilizes Snakemake’s error-handling capabilities, including a log of standard error outputs per sample, enabling users to investigate and address specific data processing issues as well as utilizing the capability to resume workflows from the point of failure rather than re-running the entire pipeline. This error-handling capability is further enhanced by the inclusion of two FastQC steps in Rocketchip’s workflow, one at the beginning and one after deduplication, to provide additional checkpoints for assessing sequence quality and detecting potential issues.
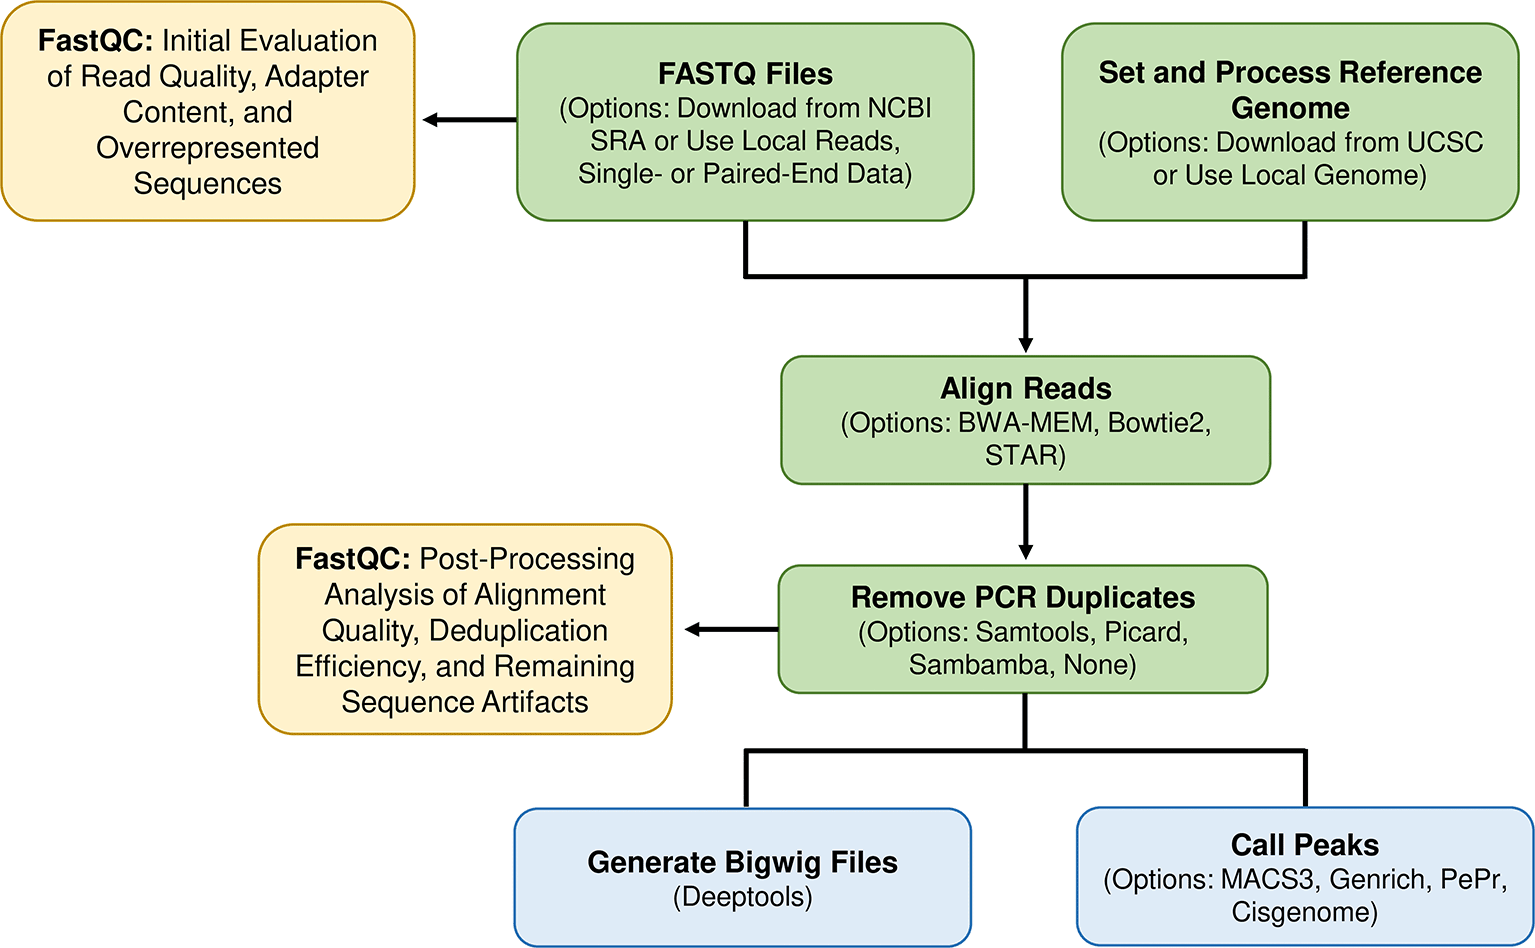
Rocketchip begins by downloading raw sequencing data and the reference genome, followed by an initial quality control check. Next, the raw data is aligned to the reference genome using the user’s choice of alignment software, and PCR duplicates are optionally removed. A second quality control check is performed after deduplication to assess alignment quality and any remaining artifacts. Aligned data is then converted into bigwig files for visualization, and peak calling is performed using customizable options for peak type and control usage. The final outputs include processed data ready for downstream analysis or visualization in genome browsers.
Rocketchip downloads ChIP-seq data directly from the SRA, the largest publicly available sequence database, using the SRA Toolkit (sra-tools, 3.0.9).2,22 The SRA Toolkit downloads data via the prefetch and fasterq-dump functions, then splits the raw DNA sequence read file into respective paired-end (PE) read files using the flag --split-files and converts them into FASTQ file formats, whereas for single-end (SE) read files, the SRA Toolkit is utilized solely for the download and conversion of raw read data into FASTQ format. Rocketchip also presents the option for users to use local (i.e. non-SRA sourced) ChIP-seq data by providing their own FASTQ files. In parallel, Rocketchip downloads and processes a reference genome of the user’s choice from the UCSC Genome Browser.23 After downloading and converting files, files are stored in the local file system in FASTA and FASTQ formats. Users also have the option of storing their own custom genomes and sequencing reads that are not yet publicly available.
In Rocketchip, raw sequence data undergoes a quality control step using FastQC (v0.12.1) with default parameters to assess potential problems that could impact downstream analysis, including levels of data duplication, base pair quality, adapter contamination, and overall sequence quality.24 This initial FastQC step provides users with the ability to investigate samples if downstream analysis fails, which can occur if there are problems involving sequence quality, contamination, or high levels of data duplication. Raw sequence data is then aligned to the reference genome using the user’s choice of alignment software from BWA-MEM (v0.7.17), Bowtie2 (v2.5.2), or STAR (v2.7.11a), each with the default parameters.25–27 Intermediate data files are processed as necessary for deduplication. PCR duplicates are removed from sequence data using a user’s choice of deduplication software from Samtools (v1.18) with --mode s (i.e. standard PCR duplicate detection), Picard (v3.1.1) using MarkDuplicates, Sambamba (v1.0.0) with default parameters, or no deduplication.28–30 Deduplicated data files are subject to another quality control step using FastQC to provide further information, such as alignment quality, validating processing steps (i.e. success of deduplication), and detecting any remaining biases or artifacts (e.g. GC content, adapter contamination, etc.) to ensure overall data integrity. Next, Deeptools’ (v3.5.4) bamCoverage function with default parameters is used to convert data from the BAM file format to the bigwig file format, which can be used for visualization of ChIP-seq data in the UCSC Genome Browser or other visualization tools.31 Finally, in Rocketchip, peaks are called with a user’s choice of software from MACS3 (v3.0.0b3) with the --bdg option, Genrich (v0.6.1) using default parameters, PePr (v1.1.24) using default parameters, or CisGenome (v2.0).32–35 For CisGenome, if a control was used, the seqpeak command was employed with the default options. Without a control, CisGenome ran two rounds of peak calling using the hts_peakdetectorv2 command with options “-w 100 -s 25 -c 10 -br 1 -brl 30 -ssf 1.”
Peak-calling options in Rocketchip include narrow versus broad peak calling and use of a control where appropriate. Software version control is handled using Conda to ensure reproducibility of results and compatibility between software versions.36 Software options were chosen based on options for command line use, ease of installation, and their standard use in the field.
Users interested in using Rocketchip can install the source code via PyPi (i.e. `pip install Rocketchip`). Rocketchip requires a minimum Python version >=3.6. Associated dependencies are Conda installable and are stored in an environment file (https://github.com/vhaghani26/rocketchip/blob/main/environment.yml) with recommended software versions compatible with Rocketchip. This allows user flexibility in installing only dependencies of interest (e.g. only MACS3 instead of MACS3, Genrich, and PePr) and changing dependency versions if desired for algorithm benchmarking purposes or to ensure compatibility with the user’s environment during installation. After installation, the user must create a project YAML file containing relevant project details, including which genome to use for alignment, sample names and paths if using local data, and software selections for the workflow to execute. Rocketchip will use this input to generate a Snakefile tailored specifically to the user’s data, project details, and requested software combination with appropriate parameters. Then, the user will run the Snakefile using Snakemake’s command-line interface arguments, which are briefly detailed in the Rocketchip GitHub repository (https://github.com/vhaghani26/rocketchip). Overall, this approach offers users flexibility to efficiently test various software combinations for their data. It simplifies the execution of an entire workflow into just a few steps: installation, creating a project file, running the Rocketchip command, and executing the workflow with Snakemake. Additionally, it enhances the reproducibility of results by documenting all inputs, outputs, and software versions, while leveraging the automated nature of Snakemake’s workflow execution.
In order to ensure that all combinations of software can be integrated seamlessly and used for ChIP-seq data analysis, we selected a deeply sequenced experimental ChIP-seq study targeting a transcription factor, MeCP2, in mouse main olfactory epithelium conducted by Rube et al. 2016, hereafter referred to as “Rube”,37 and a ChIP-seq study targeting NRF2 in human non-small lung cells conducted by Namani et al. 2019, hereafter referred to as “Namani”.38 To facilitate this comprehensive assessment, these data sets were run through Rocketchip using all four peak callers, namely MACS3, CisGenome, Genrich, and PePr. This was used in combination with each of the three aligners, BWA-MEM, Bowtie2, and STAR and four deduplication techniques, Samtools, Sambamba, Picard, and no deduplication. Additionally, to validate that Rocketchip can be run with or without a control (i.e. input or IgG control), this analysis was conducted with both the usage and omission of the corresponding control for each data set, with the exceptions of CisGenome and PePr, which can only be run if a control is used in the analysis. Each test was run three times to assess Rocketchip’s ability to replicate experimental results.
Each algorithm demonstrated varying peak-calling efficiency, influenced by several key factors ( Figure 2, Supplementary Table 1). Most notably, the source of the data (i.e, Namani vs. Rube) revealed dramatic differences in the performance of peak-calling algorithms. For the Rube data, MACS3 consistently yielded the highest number of called peaks. All methods of deduplication produced comparable peak counts. Bowtie2 and BWA-MEM performed similarly, identifying slightly more peaks compared to STAR. CisGenome called the fewest peaks, significantly influenced by the deduplicator and aligner used. Without deduplication, CisGenome identified the fewest peaks across any software combination, while peak counts increased with any deduplication method. When STAR was used as the aligner with CisGenome, peak counts were the lowest. BWA-MEM yielded a higher peak count than Bowtie2 but exhibited more non-deterministic behavior compared to Bowtie2 and STAR. For Genrich, peak counts increased when the control was omitted during peak calling. In contrast to CisGenome, Genrich had the highest peak counts when no deduplication was used and when STAR was used for alignment. The other deduplicators and aligners showed negligible differences in peak counts. When using PePr for peak calling on the Rube data, no deduplication yielded the highest peak count, with other deduplication methods yielding similar results. Unlike the other algorithms, each aligner performed differently with PePr, with STAR identifying the most peaks, followed by BWA-MEM and then Bowtie2. Both the narrow- and broad-peak-calling algorithms yielded negligible differences, except for CisGenome, which had less deterministic results when peaks were defined as narrow and run through Rocketchip.
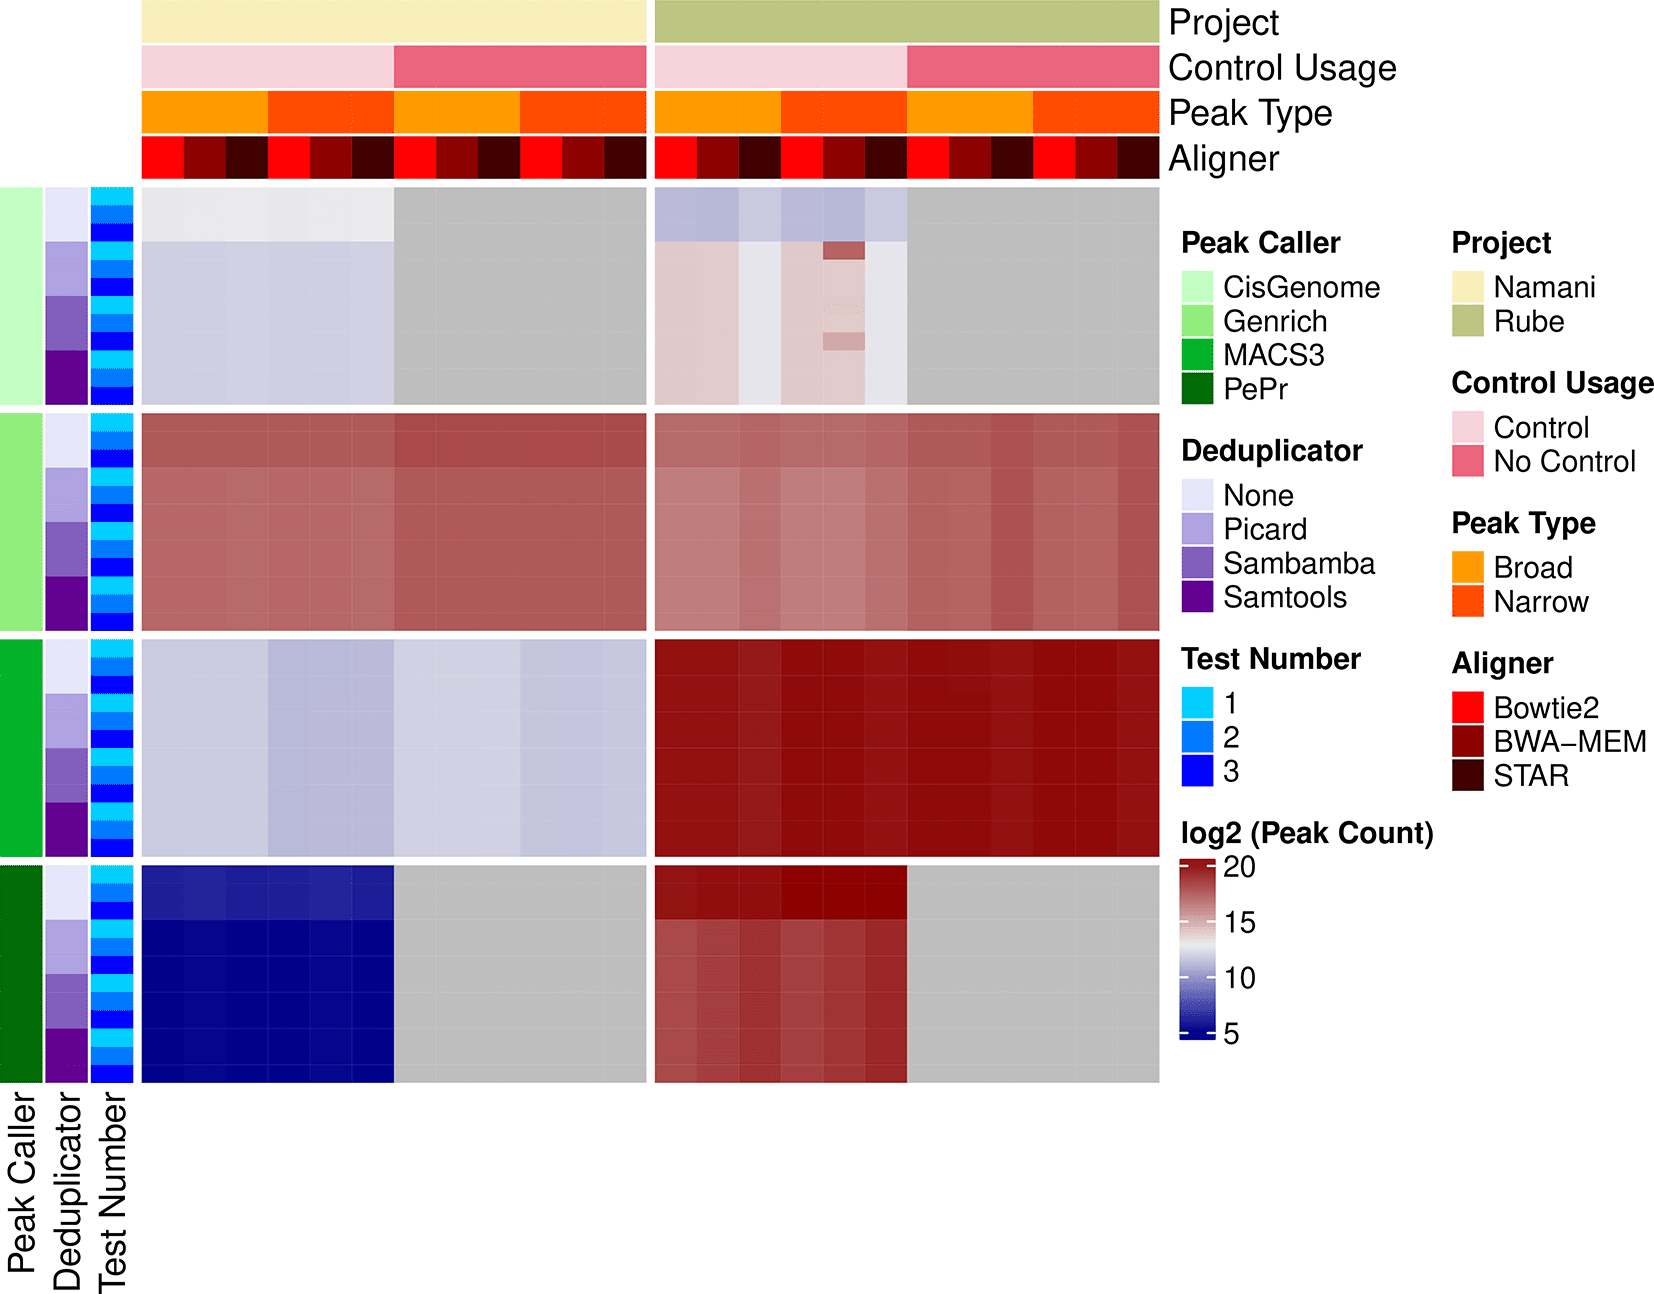
ChIP-seq data from Namani et al. 2019 and Rube et al. 2016 were run through all software combinations in Rocketchip three times each. The data source (i.e. Rube vs. Namani) is yellow, with the light yellow corresponding to the Namani data and darker yellow corresponding to the Rube data. A subset of analyses were run with a control vs. no control. This is represented by light pink for a control being used during peak-calling and dark pink if a control was omitted during peak-calling. The data was run through the software combinations as both a broad peak (light orange) and narrow peak (dark orange) to evaluate algorithm performances, though the Namani data uses NRF2, which is characterized best by narrow peaks, and the Rube data uses MeCP2, which is characterized best by broad peaks. The aligners are represented in red, with Bowtie2 being a light red, BWA-MEM being a medium shade of red, and STAR being a dark red. The peak-caller is highlighted in green with shades of green getting progressively darker for Cisgenome, Genrich, MACS3, and PePr. Similarly, the deduplicator is represented by shades of purple, with no deduplication (“None”) being the lightest, followed by Picard, Sambamba, and then Samtools, which is the darkest. Because each combination was run three times, each of the three trials is plotted by shades of blue. The first trial is a light shade of blue, the second trial is a medium shade, and the third trial is the darkest shade. Raw peak counts were log2 transformed and plotted in the heatmap. Darker red corresponds to higher peak counts while darker blue corresponds to lower peak counts. Gray corresponds to “NA” values, as PePr and CisGenome cannot be run without a control. Raw peak counts can be found in Supplementary Table 1. The heatmap was created using R (v4.2.3) with a kernel (r-irkernel v1.3.2) in Jupyter Notebook (v1.0.0) using the following packages: ComplexHeatmap (v2.14.0), dplyr (v1.1.4), tidyr (v1.3.1), reshape2 (v1.4.4), stringr (v1.5.1), and MASS (v7.3.60.0.1).
For the Namani data, notable contrasts in peak-calling outcomes were observed across various algorithms. Genrich consistently yielded the highest number of peaks, contrasting with the Rube data where MACS3 showed higher peak counts. Interestingly, PePr consistently produced the lowest peak counts for the Namani dataset despite performing second best for the Rube data. The choice of aligner did not significantly impact peak counts overall; however, omitting deduplication generally resulted in slightly higher peak counts across all peak-callers. Unlike the Rube data, where the distinction between narrow- and broad-peak calling showed minimal differences across algorithms, the Namani data exhibited variability based on this distinction. Specifically, MACS3 identified higher peak counts under the assumption of broad peaks compared to narrow peaks.
In addition to assessing the results of the different algorithms, we also assessed Rocketchip’s ability to replicate experimental findings. Both the Namani and Rube data sets were run through every software combination in Rocketchip three times, totaling 288 software combinations with three trials per combination. Among the 288 software combinations tested, 274 combinations (95.14%) demonstrated perfect replication of peak counts across all three trials (i.e. every trial yielded identical peak counts). Surprisingly, despite identical software versions, computational resources, and inputs, certain combinations of data and software were non-deterministic, with 4.86% (14 out of 288) exhibiting variability in peak counts ( Table 1). Given that non-deterministic results were observed exclusively for the Rube data, this data was downsampled to 5,000 reads per sample using Seqtk (v1.4) and rerun through every combination 100 times to further assess the source of variation. While variation in peak counts persisted, the maximum range between the minimum and maximum observed peaks was limited to one across all combinations (see Supplementary Table 2). Notably, the software combinations that produced non-deterministic results differed from those in the initial analysis. Therefore, we hypothesize that the low level of variation observed in our results may stem from runtime errors.
Overall, these findings underscore four critical points. First, the choice of software combination, including the algorithm, deduplication method, and aligner, has a significant impact on peak-calling outcomes. Second, even with strict control of factors impacting the analysis, we still observe some variability in peak calling, albeit in a small subset of cases. Third, dataset-specific nuances significantly impact the performance of different software combinations, resulting in a differing consensus on what the “best” software combination is. Finally, the results validate that all available software combinations can be successfully executed within Rocketchip, ensuring flexibility and robustness in ChIP-seq analyses.
Benchmarking algorithm performance on real biological data is challenging, as true binding sites are not known. To illustrate Rocketchip’s ability to benchmark algorithm performance, six simulated test data sets were designed for each combination of PE and SE reads with narrow and broad peaks. Each data set has two replicates and a synthetic genome composed of uniformly distributed base pairs. The dataset is modeled to have precisely 1000 peaks with varying numbers of 150 base pair long reads per peak to represent various peak coverage depths for different data sets: 4X, 8X, 16X, 32X, 64X, and 128X. Peaks were evenly distributed 2500 base pairs apart for narrow peaks and 5000 base pairs apart for broad peaks. Read locations within peaks were simulated with a Gaussian distribution centered on the peak summit, spanning 400 base pairs for narrow peaks and 1500 base pairs for broad peaks. Reads were dispersed with a standard deviation of 0.1 to ensure variability around the peak summit. A study assessing PCR duplication in ChIP-seq found that PCR duplication ranged from 2.94-55.38% among their tested ChIP-seq data sets, ultimately concluding that a rate of 20% duplication or less is most effective for read mapping.39 Thus, PCR duplicates were simulated at a 20% rate. Input controls, which represent sonicated DNA fragments, were modeled as randomly distributed genomic reads.
This dataset was run through all combinations in Rocketchip, including the inclusion and exclusion of the input control, which accounts for genomic noise and is believed to improve accuracy. CisGenome and PePr require a control, so they were only tested with the input control. We varied read type (PE and SE) and peak type (narrow and broad) to systematically evaluate software performance across all combinations. The objective of this experiment was to assess accuracy, precision, and sensitivity of each combination, where accuracy, which is measured using F1 scores, measures how well peaks match true binding sites, precision indicates the proportion of true peaks among identified peaks, and sensitivity measures the proportion of true peaks detected.
F1, precision, and sensitivity scores were calculated based on true positive (TP), false positive (FP), or false negative (FN) base pairs within peaks. TP represents overlapping base pairs between expected and observed peaks, FP represents base pairs in observed peaks not matching expected peaks, and FN represents base pairs in expected peaks not observed. F1 scores were calculated as [2TP/(2TP + FP + FN)], precision as [TP/(TP + FP)], and sensitivity as [TP/(TP + FN)]. For Cisgenome and PePr, TP, FP, and FN were set to zero, as they cannot be run without a control, indicating an inability to be accurate, precise, or sensitive without using a control.
The results of this experiment revealed that, generally, narrow peak-calling had higher accuracy, precision, and sensitivity than broad peak-calling ( Figure 3). Interestingly, the peak callers with the highest F1, precision, and sensitivity scores, Genrich and MACS3, performed better when run without an input control compared to with a control. MACS3 and Genrich had the highest accuracy, precision, and sensitivity, followed by PePr and Cisgenome, which is consistent with the analyses using the Rube and Namani data. No major differences were observed based on the aligner or deduplicator used in any of the analysis. Overall, this analysis provides further insights into the algorithm performances, allowing for more robust and informed decisions in ChIP-seq data analysis.
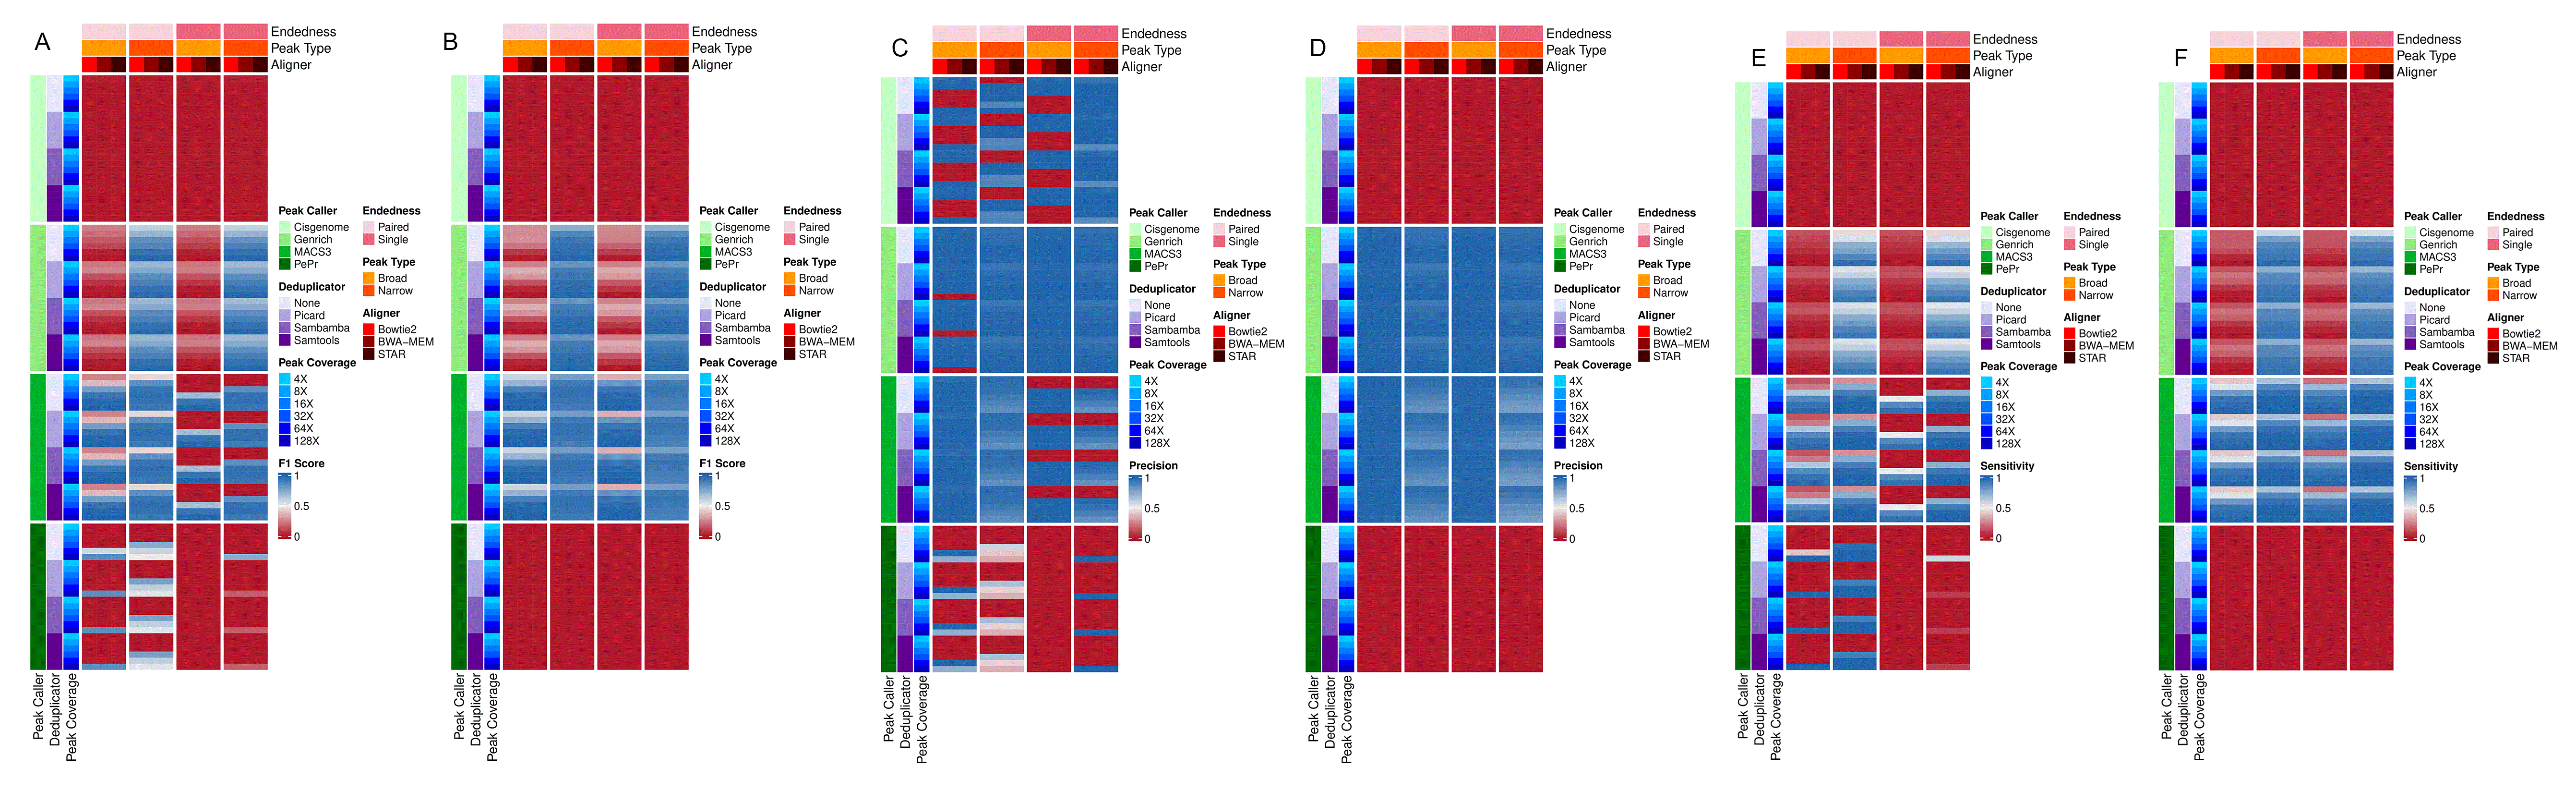
Simulated ChIP-seq data was run through all software combinations in Rocketchip. For each heatmap, the endedness of the data (PE vs. SE) is pink, with the light pink corresponding to PE data and dark pink corresponding to SE data. The data was run using broad peak (light orange) and narrow peak (dark orange) algorithms depending on whether broad or narrow peaks were modeled, respectively. The aligners are represented in red, with Bowtie2 being a light red, BWA-MEM being a medium shade of red, and STAR being a dark red. The peak-caller is highlighted in green with shades of green getting progressively darker for Cisgenome, Genrich, MACS3, and PePr. Similarly, the deduplicator is represented by shades of purple, with no deduplication (“None”) being the lightest, followed by Picard, Sambamba, and then Samtools, which is the darkest. The peak coverage, ranging from 4X-128X is depicted using shades of blue, with the shade getting darker as peak coverage increases for the given data set. Darker red shading in the plotted heatmap values corresponds to higher accuracy, precision, or sensitivity, while darker blue corresponds to lower accuracy, precision, or sensitivity. (A) The plotted values represent the calculated F1 scores when incorporating a control during peak-calling. (B) The plotted values represent the calculated F1 scores when omitting a control during peak-calling. (C) The plotted values represent the calculated precision scores when incorporating a control during peak-calling. (D) The plotted values represent the calculated precision scores when omitting a control during peak-calling. (E) The plotted values represent the calculated sensitivity scores when incorporating a control during peak-calling. (F) The plotted values represent the calculated sensitivity scores when omitting a control during peak-calling. The heatmaps were created using R (v4.2.3) with a kernel (r-irkernel v1.3.2) in Jupyter Notebook (v1.0.0) using the following packages: ComplexHeatmap (v2.14.0), dplyr (v1.1.4), tidyr (v1.3.1), reshape2 (v1.4.4), stringr (v1.5.1), and MASS (v7.3.60.0.1).
Rocketchip was tested for compatibility with a range of genomes from the UCSC Genome Browser, which includes the seven commonly used genomes displayed by default in the “Genomes” tab: human (hg38), mouse (mm10), rat (rn6), zebrafish (danRer11), fruitfly (dm6), worm (ce11), and yeast (sacCer3). Three published ChIP-seq data sets on the SRA with varying read coverage were selected per genome and run through Rocketchip ( Figure 4).40–51 All experiments used PE data and were conducted using BWA-MEM for alignment, Samtools for deduplication, and MACS3 for peak-calling. These experiments were run on an HPC with 64 CPUs and 250 GB of memory available, running one job at a time without parallelization. To ensure consistency, genome copies were deleted between runs using the same genome to ensure that the run time accounts for the full workflow. The results of this experiment validated Rocketchip’s compatibility with the seven primary genomes from the UCSC Genome Browser and use of sequence data hosted on the SRA. Additionally, it provides users with estimates of how long Rocketchip should run for different genomes to allow for appropriate computational resource requests. Run times ranged from 0.55 hours to 20.54 hours depending on the genome size and read data used.
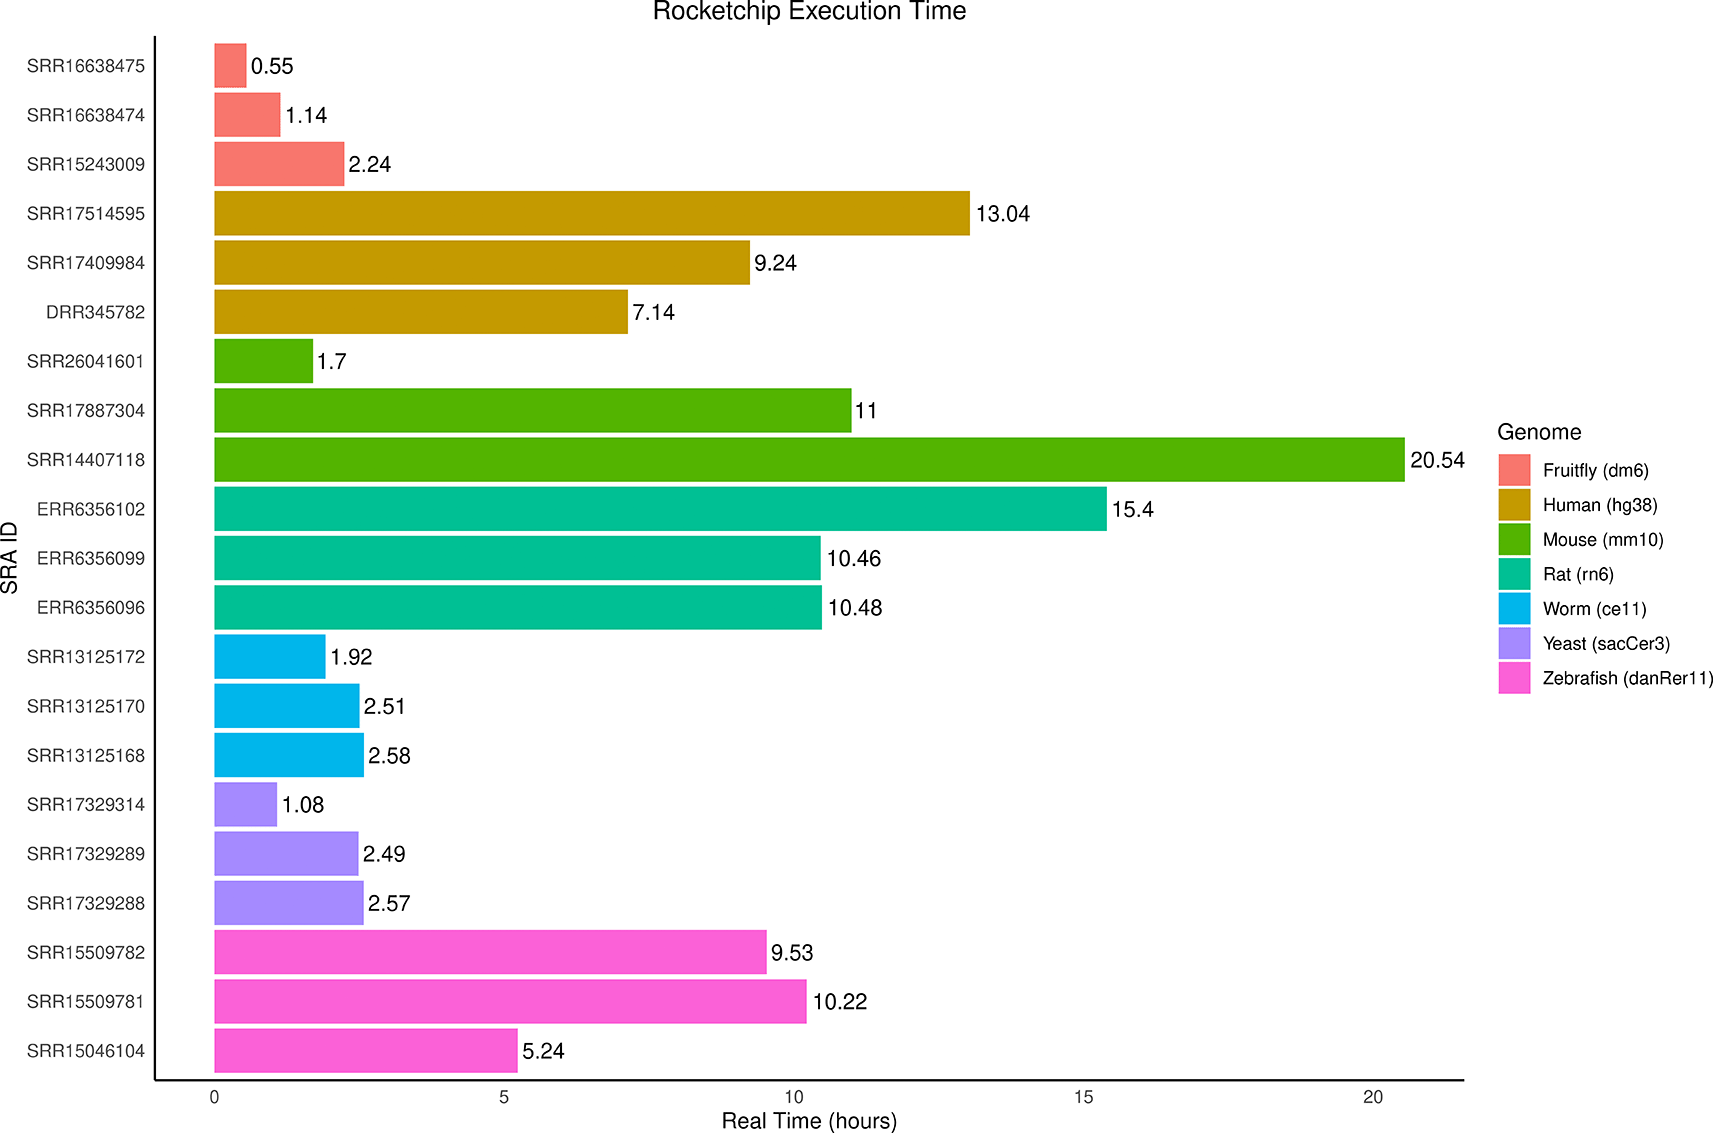
This is a horizontal bar plot representing how long (in hours) each sample per genome took to run. The label on the bars represents the time in strictly hours (i.e. not hours and minutes) that each sample took to run through the pipeline from beginning to end assuming no prior storage of any data required of the analysis. The color of the bars corresponds to which organism the sample comes from and which genome it was run with: red for dm6, orange for hg38, green for mm10, turquoise for rn6, blue for ce11, purple for sacCer3, and pink for danRer11. The bar plot was created using R (v4.2.3) with a kernel (r-irkernel v1.3.2) in Jupyter Notebook (v1.0.0) using the following packages: ggplot2 (v3.4.4) and dplyr (v1.1.4).
As of June 18, 2024, there are 363,213 ChIP-seq, 494,128 CUT&RUN, and 19,492 CUT&Tag data sets available on the SRA. Due to the increasing use of CUT&RUN and CUT&Tag, we wanted to assess Rocketchip’s ability to effectively process data generated by these mapping techniques. Therefore, we applied Rocketchip to CUT&RUN and CUT&Tag data generated by Akdogan-Ozdilek et al. that sought to characterize the zebrafish epigenome during embryogenesis.52 This data set was chosen due to the thorough documentation of the results and high sequence data quality.
In evaluating the performance of Rocketchip for CUT&RUN and CUT&Tag data analysis, we assessed several key metrics, including the percentage of reads aligned, sequence duplication percentages, and peak counts ( Table 2). The alignment percentage was chosen as a metric due to its significance in assessing the overall data processing efficiency and alignment accuracy. Alignment percentage serves as a key indicator of how effectively Rocketchip handles the unique characteristics of CUT&RUN and CUT&Tag data sets, ensuring that a substantial proportion of reads are appropriately mapped to the reference genome and available for further analysis. Sequence duplication percentages were also evaluated, as they indicate Rocketchip’s ability to reduce data redundancy while maintaining data quality throughout the pipeline. Additionally, peak counts provide insight into Rocketchip’s ability identify and quantify expected protein binding sites. Comparisons between processed read counts and peak counts demonstrate that Rocketchip scales appropriately with the number of reads remaining after data processing, reflecting its capacity to accurately assess and interpret the genomic data.
The CUT&RUN data set consisted of nine samples. Six samples were SE reads and corresponded to two replicates each for detection of H3K4me3, H3K27me3, and H3K9me3 (SRR14850825 and SRR14850826, SRR14850827 and SRR14850828, and SRR14850829 and SRR14850830, respectively). The remaining three sets were PE read samples that corresponded to two replicates for the detection of RNA polymerase II and mock IP control using the IgG antibody (SRR14850831 and SRR14850832, and SRR14850833, respectively). The study that originally produced these data sets employed Bowtie2 to align sequences, Samtools to filter aligned sequences, and HOMER for peak-calling. Rocketchip was run using Bowtie2, Samtools, and MACS3 for broad peak-calling. As the data was partially SE and partially PE reads, analyses were conducted separately, with the control being used for the PE analysis due to compatibility. Sequence duplication percentages varied across samples, with some samples exhibiting high duplication rates, which is indicative of data redundancy that Rocketchip managed effectively. Comparisons between processed read counts and peak counts demonstrated that Rocketchip scales appropriately with the number of reads remaining after data processing, reflecting its capacity to accurately assess and interpret genomic data. Original alignment percentages were compared to those obtained via Rocketchip. A paired t-test was conducted using each SRA input as an observation, yielding a p-value of 0.00302, with Rocketchip consistently producing significantly better alignment percentages for the CUT&RUN data compared to the original analysis. The mean difference in the alignment percentages was 32.66%. We also noted that Rocketchip detected a substantial number of peaks in relation to the processed reads, indicating its ability to effectively parse and process signal (peaks) versus biological noise. We hypothesize that the alignment accuracy differences are related to the use of different Bowtie2 versions, as the original study used Bowtie 2.4.1 to align their CUT&RUN data, whereas Rocketchip used version 2.5.2. The GitHub change log for Bowtie2 version 2.5.1, one version earlier than the one Rocketchip uses, notes: “fixed an issue affecting bowtie2 alignment accuracy” and “fixed a segmentation fault that would occur while aligning SRA data.” This highlights the need to revisit and utilize publicly available data, as software updates can improve data processing and thus yield more accurate results. This also highlights Rocketchip’s ability to accurately and effectively process CUT&RUN data.
The CUT&Tag data set used for testing in Rocketchip was comprised of six PE read samples. There are three replicates each of H2A.Z at 6 hours and 24 hours post fertilization (SRR14870792, SRR14870793, and SRR14870794 and SRR14870795, SRR14870796, and SRR14870797, respectively). The original study used Bowtie2 for alignment, Samtools for filtering, Picard for deduplication, and MACS2 for peak-calling. We ran Rocketchip using Bowtie2, Samtools, and MACS3. Similar to the CUT&RUN data, sequence duplication percentages varied, and Rocketchip was able to efficiently process the data without encountering any errors. Original alignment percentages were compared to those obtained via Rocketchip. A paired t-test was conducted using each SRA input as an observation, yielding a p-value of 0.00015, with Rocketchip resulting in lower alignment percentages for the CUT&Tag data compared to the original analysis. The magnitude of difference in alignment percentages, however, was less than that of the CUT&RUN data, as the mean difference by Rocketchip was -8.41% for CUT&Tag as opposed to +32.66% for CUT&RUN. However, the alignment percentages achieved in our Rocketchip CUT&Tag analysis still surpassed every alignment percentage reported in the original study for their CUT&RUN data, suggesting that Rocketchip is suitable for analyzing CUT&Tag data. We hypothesize that the alignment difference may be due to the usage of both Samtools and Picard in the original CUT&Tag analysis as opposed to just using Samtools in Rocketchip.
Rocketchip is a distinct, novel, and innovative tool due to its unique approach to automating and allowing for flexibility in ChIP-seq, CUT&RUN, and CUT&Tag data analysis workflows. Unlike traditional methods that often require manual intervention and lack reproducibility, Rocketchip provides a straightforward solution by integrating existing software to automatically run analyses for large-scale datasets. Researchers can easily interchange analysis components and rerun their analysis to identify the most appropriate software options for their data. Additionally, Rocketchip was designed to be user-friendly, making it more accessible to researchers with limited bioinformatics expertise compared to traditional methods that require users to navigate software installation, parameter determination, and command inputs from scratch, promoting broader utilization of publicly available sequence data.
In our analyses of Rocketchip using published experimental ChIP-seq, CUT&RUN, and CUT&Tag data, we demonstrated Rocketchip’s ability to handle diverse software combinations seamlessly, which is critical given the variability observed in peak-calling efficiency across different datasets and software tools. We found that the choice of peak caller, aligner, and deduplication method significantly influenced peak-calling outcomes in a data-specific manor. These disparities persisted even when identical software combinations were employed, highlighting the significant impact of dataset-specific factors on the results. This can likely be attributed to NRF2 exhibiting a narrow-peak pattern, while MeCP2 exhibits a broad-peak pattern with a low signal-to-noise ratio.37,38,53 These variations underscore the importance of selecting the appropriate software combination tailored to specific experimental contexts.
Rocketchip demonstrated a notable ability to replicate results across multiple runs, achieving a perfect replication rate of 95.14% across 288 software combinations tested (i.e. 274/288 combinations yielded identical peak counts in all three trials conducted for each combination). However, 4.86% of the combinations (14/288) exhibited variability in peak counts, highlighting instances of non-deterministic behavior despite using the same software versions, computational resources, and input data. This inconsistency underscores the complexity of peak calling algorithms and their sensitivity to specific data and software combinations. In our follow-up analysis with the downsampled Rube data, peak counts once again showed non-deterministic behavior, but variations were limited to a maximum range of one peak across all combinations. Interestingly, the software combinations yielding these inconsistent results differed from those in the initial analysis, indicating that runtime errors or concurrency errors related to multithreading may contribute to the observed variability. Ultimately, the persistence of any variation in results using Rocketchip highlights the need for the further investigation of determinism in algorithms commonly used for analyzing genomic data. Furthermore, there is a seemingly constant push to standardize pipelines and tools, but these analyses demonstrate that standardization is likely not possible due to differences in genomic data. There is, therefore, an increasing need for flexible workflows that provide a streamlined approach to facilitate robust data analysis.
In our analyses of Rocketchip using simulated data, we evaluated the accuracy, precision, and sensitivity of various software combinations. Notably, our results indicate that peak-calling performance varied significantly with different configurations and peak types, particularly at lower coverage levels. Consistent trends observed across both simulated and experimental datasets, including the Rube and Namani data, highlight the importance of careful selection of software in the analysis of ChIP-seq data. While synthetic datasets provide a controlled environment for testing algorithm performance, they inherently lack the complexity of real biological samples, necessitating further investigation in more diverse biological contexts.
For the CUT&RUN analysis, Rocketchip significantly improved the percentage of mapped reads, likely due to the use of the updated Bowtie2 version. However, for CUT&Tag, Rocketchip resulted in lower read alignment that could not be easily explained by differences in the aligner or deduplicator used prior to peak-calling. This unsolved discrepancy highlights the necessity of documenting software versions and parameters used in analyses to enable replication of results.
When using Rocketchip, a few possible limitations to Rocketchip should be considered. First, it should be noted that broad and narrow-peak-calling must be done in separate Rocketchip runs. This is due to the inherent variability in how peaks are represented via read counts. Similarly, SE and PE data sets must be run separately, as these data types are processed differently at the start of the analysis. Additionally, updating software may yield incompatibilities between dependencies; however, Rocketchip ensures version control via Conda to eliminate potential problems with version incompatibilities.
Future goals for Rocketchip include packaging Rocketchip source code and all dependencies to be Conda installable. We are also interested in updating Rocketchip to facilitate cloud computing options on a per rule basis (i.e. submitting each rule as its own job). We also look forward to expanding Rocketchip’s selection of software, including other peak-calling algorithms, to provide further user customization options. For instance, WASP54 has recently become a leading method for deduplication of sequence data. It takes an allele-aware approach to mapping reads back to the reference genome, and discards reads that fail to map to the same region of the genome when the complementary read is considered. This approach reduces false positives for allele imbalance and can help improve peak quality in ChIP-seq data. This algorithm has already been incorporated into STAR alignment. Thus, we aim to release a future version of Rocketchip with an option of using WASP, which will thereby circumvent the following deduplication step in the pipeline.
Currently, Rocketchip’s core function is to provide researchers with flexibility using different avenues to analyze their data, eventually resulting in the identification of enriched regions (i.e. binding sites). However, differences in experimental design pose challenges for downstream analysis because ChIP-seq can be used for various purposes, such as motif finding, differential binding analysis, or classifying the epigenomic landscape. For instance, experimental uses of ChIP-seq can vary from characterizing the motif of a newly identified transcription factor to understanding protein binding behavior across different concentrations of protein expression and more. Essentially, the diversity in ChIP-seq applications highlights the difficulty of creating a one-size-fits-all solution for post-peak-calling analysis. Nevertheless, Rocketchip’s adaptability allows it to serve as a robust tool for a wide range of research goals, leaving downstream analysis customizable based on the specific needs of researchers. Should researchers choose to implement motif-finding for their data, a plethora of options are available for use, including HOMER55, HOCOMOCO,56 MEME SUITE,57 XXmotif,58 etc. Other options for downstream analysis include differential binding analysis using tools such as BEDTools59 or GenomicRanges60 and gene ontology/enrichment analysis using tools such as Enrichr61 and GOnet.62
Future goals for analyses using Rocketchip include conducting a meta-analysis of all published data sets for a specific transcription factor. With increased sample sizes and varying coverage, this may yield improved accuracy of transcription factor motifs and in vivo binding properties across a variety of different tissue types and conditions. Additionally, we hope to conduct tests on simulated ChIP-seq data to better understand what factors impact ChIP-seq data and how they do so. This includes modeling narrow vs. broad peak regions, as well as varying peak density and coverage, GC-rich regions, overlapping and bimodal peak regions, and levels of PCR duplication. Synthetic data with these modeled characteristics can be run through the various software combinations within Rocketchip to better understand which tools are better suited for different types of data. Ultimately, this would further researchers’ ability to better tailor specific analysis tools to their data.
- Source code available from: https://github.com/vhaghani26/rocketchip
- Archived software available from: https://doi.org/10.5281/zenodo.15319648
- License: MIT License.
| Views | Downloads | |
|---|---|---|
| F1000Research | - | - |
|
PubMed Central
Data from PMC are received and updated monthly.
|
- | - |
Provide sufficient details of any financial or non-financial competing interests to enable users to assess whether your comments might lead a reasonable person to question your impartiality. Consider the following examples, but note that this is not an exhaustive list:
Sign up for content alerts and receive a weekly or monthly email with all newly published articles
Already registered? Sign in
The email address should be the one you originally registered with F1000.
You registered with F1000 via Google, so we cannot reset your password.
To sign in, please click here.
If you still need help with your Google account password, please click here.
You registered with F1000 via Facebook, so we cannot reset your password.
To sign in, please click here.
If you still need help with your Facebook account password, please click here.
If your email address is registered with us, we will email you instructions to reset your password.
If you think you should have received this email but it has not arrived, please check your spam filters and/or contact for further assistance.
Comments on this article Comments (0)