Keywords
Food Inflammatory Index, Diet, Gut Microbiota, Diabetes, diet-microbiota-diabetes axis.
Diet is a key modulator of gut microbiota composition, and dietary inflammation may significantly influence metabolic disorders such as diabetes. In this study, we explored the relationship between the Food Inflammatory Index (FII) and gut microbiota composition in 234 type 2 diabetic patients from Saudi Arabia.
A total of 234 Participants were divided into quartiles according to their FII scores, which increased progressively, effectively distinguishing varying levels of dietary inflammatory potential.
Microbiome sequencing revealed that while overall alpha diversity remained stable, beta diversity analysis indicated subtle yet statistically significant differences in microbial community structure (PERMANOVA p = 0.001, R2 = 2.14%). At the phylum level, the dominant taxa Firmicutes and Bacteroidota, exhibited significant shifts, with a non-linear ratio of Bacteroidota to Firmicutes observed across FII quartiles. Genus-level analysis revealed significant variations in Bacteroides, Alistipes, and Prevotella_9, with pairwise comparisons highlighting marked differences between the lowest and highest FII quartiles.
These compositional changes suggest that increased dietary inflammation is linked to a shift toward a dysbiotic gut microbiota, which may exacerbate metabolic dysregulation in diabetes. These findings pave the way for future studies to investigate whether targeted, FII-guided dietary interventions can modulate gut microbial communities and enhance metabolic health in diabetic populations.
Food Inflammatory Index, Diet, Gut Microbiota, Diabetes, diet-microbiota-diabetes axis.
Diet plays a pivotal role in shaping gut microbiota composition, influencing metabolic pathways, immune responses, and host gene expression. As research advances, these interactions are increasingly recognized for their impact on molecular and translational medicine, bridging nutritional science, microbiome research, and clinical applications.1 Dietary components such as fiber, polyphenols, and probiotics promote beneficial bacteria, leading to enhanced short-chain fatty acid (SCFA) production, reduced inflammation, and improved insulin sensitivity, key mechanisms in metabolic and autoimmune diseases.1 In molecular medicine, microbiota-derived metabolites interact with host receptors, affecting pathways related to inflammation, epigenetics, and metabolic homeostasis.2 Advances in metagenomics and metabolomics have revealed the profound role of microbiota-derived bioactive compounds in regulating host physiology and disease susceptibility.2 By leveraging insights from microbiome research, personalized nutrition, probiotics, and fecal microbiota transplantation (FMT) have emerged as promising therapeutic strategies for managing conditions such as Type 2 Diabetes (T2D), obesity, and inflammatory diseases. Translational medicine plays a crucial role in applying these findings to develop targeted, microbiome-based interventions for improved clinical outcomes.2 By understanding the molecular underpinnings of diet-microbiota interactions, researchers can advance precision medicine approaches to optimize disease prevention and treatment through targeted dietary interventions.1
The FII is a tool designed to assess the inflammatory potential of foods based on their bioactive components and their effects on inflammatory biomarkers. It builds upon the Dietary Inflammatory Index (DII), which was initially developed to quantify the inflammatory potential of an individual’s diet by analyzing its relationship with inflammatory cytokines such as IL-6, CRP, and TNF-α.3 The FII provides a more detailed evaluation by identifying the key inflammatory components within individual food items rather than broad dietary patterns.4
Diet plays a critical role in modulating systemic inflammation, which is closely linked to metabolic disorders, including diabetes. Recent studies suggest that dietary patterns rich in anti-inflammatory foods, such as fiber-rich plant-based diets, are associated with beneficial gut microbiota composition, while pro-inflammatory diets can alter microbial diversity and promote dysbiosis.5 Moreover, targeted dietary interventions have been shown to directly modulate gut microbiota composition, thereby influencing immune responses and inflammatory pathways.6
Al-Muhanna et al. (2022)7 analyzed gut microbiota in Saudi Arabian T2D patients, revealing an altered Firmicutes/Bacteroidetes ratio and enrichment of Akkermansia, Acidaminococcus, and Dialister when compared to non-T2D controls. Microbial composition correlated with glucose levels, suggesting a role in diabetes progression. Similarly, Alali et al. (2024)8 linked plant-based diets to better glycemic control, lower triglycerides, and improved lipid profiles, while diets high in refined grains and processed foods had adverse effects.
This study examines how dietary inflammatory potential, measured by the Food Inflammatory Index, affects gut microbiota at the phylum and genus levels in Saudi T2D patients, clarifying diet-microbiota interactions and metabolic health links. Given the high risk of chronic diseases like diabetes, understanding this relationship is crucial. By analyzing FII and gut microbiota composition, this study provides insights into the impact of dietary inflammation on microbial shifts in diabetic patients.
In a previous study (2015-2019) conducted on Saudi Arabian patients attending diabetic clinics at King Fahd Hospital of the University (KFHU), 16S rRNA was extracted from stool samples to analyze the microbiota communities and assess the differences based on diabetic status and glucose levels.7 The results indicated that there were noteworthy differences on a community level between patients with T2D compared to normal in the general population, which highlighted the diversity of the Saudi Arabian population compared to Western cohorts. Consequently, it can be hypothesized that either genetic, environmental or dietary habits play a role in the formation of gut microbiota in various populations.
We also subsequently conducted a dietary screening study (2017-2019) to further the research by recruiting a cohort of 577 T2D patients from the same diabetic clinics at KFHU. Nurses collected data on dietary intake using a pretested 7-day semi-quantitative food frequency questionnaire (7-d SQFFQ) designed to cover the week before the administration of the questionnaire.8 Consequently, this validation guaranteed the accuracy and reliability of the dietary data to permit an inclusive analysis to be conducted and assess the possible impact in the management of the disease.
In this study, we focused on analyzing the data of the patients who were included in both the 2015-2019 and 2017-2019 studies. As a result, a total of 234 T2D patients were included in the current analysis. We focused on this specific subcategory to discover if there were any significant associations between dietary habits and microbial communities in T2D Saudi patients to increase our knowledge of the possible connections and implications in order to manage the disease more effectively. This enabled a more detailed assessment of how dietary habits may affect gut microbiota in T2D patients.
The FII was computed to assess the inflammatory potential of participants’ diets using a validated 7-d SQFFQ as previously described.8 Reported food consumption frequencies were log-transformed to mitigate the influence of extreme consumption values and better reflect the diminishing returns in inflammatory effect observed at high intake levels.9,10 Each food item was assigned an FII score (Table S1) based on established literature linking nutrients to inflammatory markers.4 The FII score was calculated by multiplying log-transformed intake frequencies by their respective FII scores and summing across all items. Initially, participants were grouped into tertiles, but this obscured microbiota associations. Therefore, a quartile-based grouping (Q1 - Q4) was adopted which divided FII scores by percentiles (Q1 ≤ 25th, Q2: 25th - 50th, Q3: 50th - 75th, Q4 ≥ 75th), providing a stronger resolution of microbiota-FII relationships. Refining FII calculation and grouping improved the understanding of the impact of dietary inflammation on gut microbiota in Saudi T2D patients.
The study included 234 patients with a mean age of 54.03 ± 9.69 years. Among them, 136 were female, and 98 were male. When categorized by FII quartiles, the mean age across quartiles showed minimal variation, ranging from 54.86 ± 10.46 years in Q1 to 53.22 ± 10.21 years in Q4. Sex distribution per quartile showed a slight variation, with females being the majority in Q2 (36 vs. 22) and Q3 (40 vs. 19), while males were slightly more prevalent in Q1 (30 vs. 29) and Q4 (27 vs. 31), Table S2.
The distribution of the final FII score for the patients across the four FII quartiles is shown in Figure 1. The FII score increased progressively and significantly (P < 0.0005) from Q1 to Q4, confirming that quartile-based grouping effectively stratified participants based on FII. Figures 2A and 2B show the histogram and Q-Q plot, respectively, and indicate that the Final FII Scores exhibit a roughly symmetrical distribution but with mild skewness and deviations at the tails. The Shapiro–Wilk test (p < 0.05) confirms that the data significantly deviates from normality, indicating a non-normal distribution. The Q-Q plot further highlights this deviation, particularly at the lower and upper extremes, where the data points diverge from the theoretical normal line.
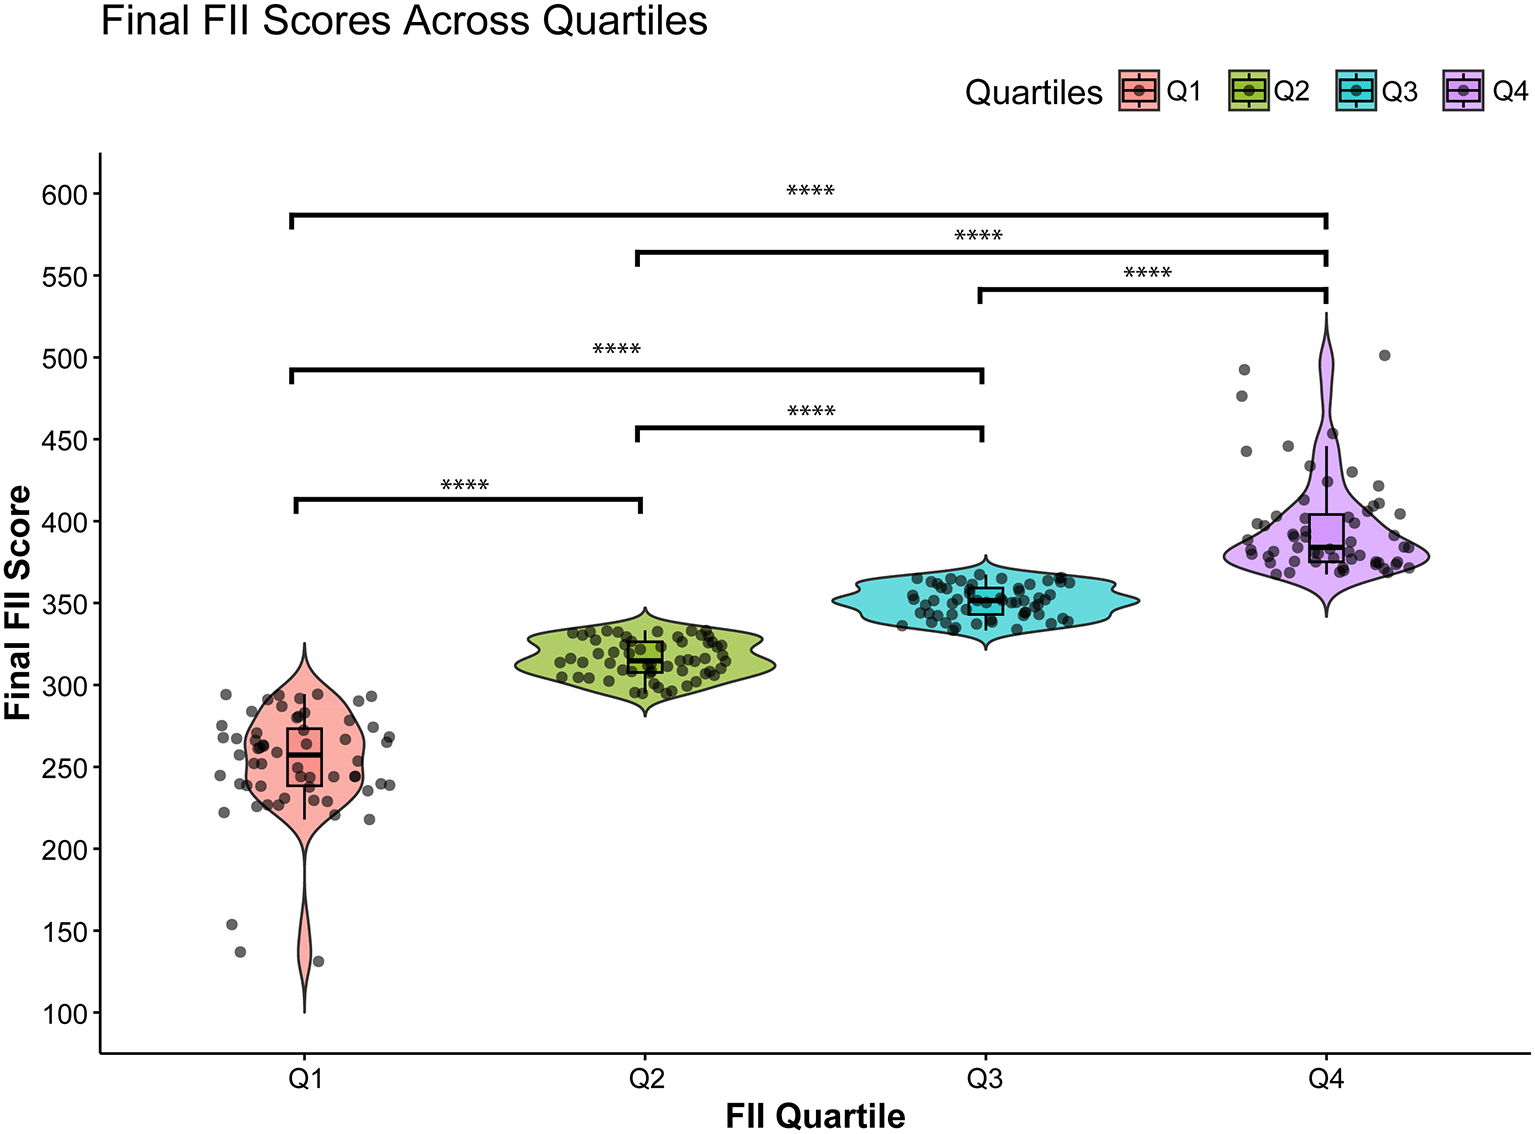
Each violin depicts the spread and density of scores, with black boxplots inside indicating the median and interquartile range. Individual samples are plotted as points. Horizontal brackets with asterisks denote statistically significant pairwise comparisons; the number of asterisks corresponds to the significance level (**** p < 0.0001).
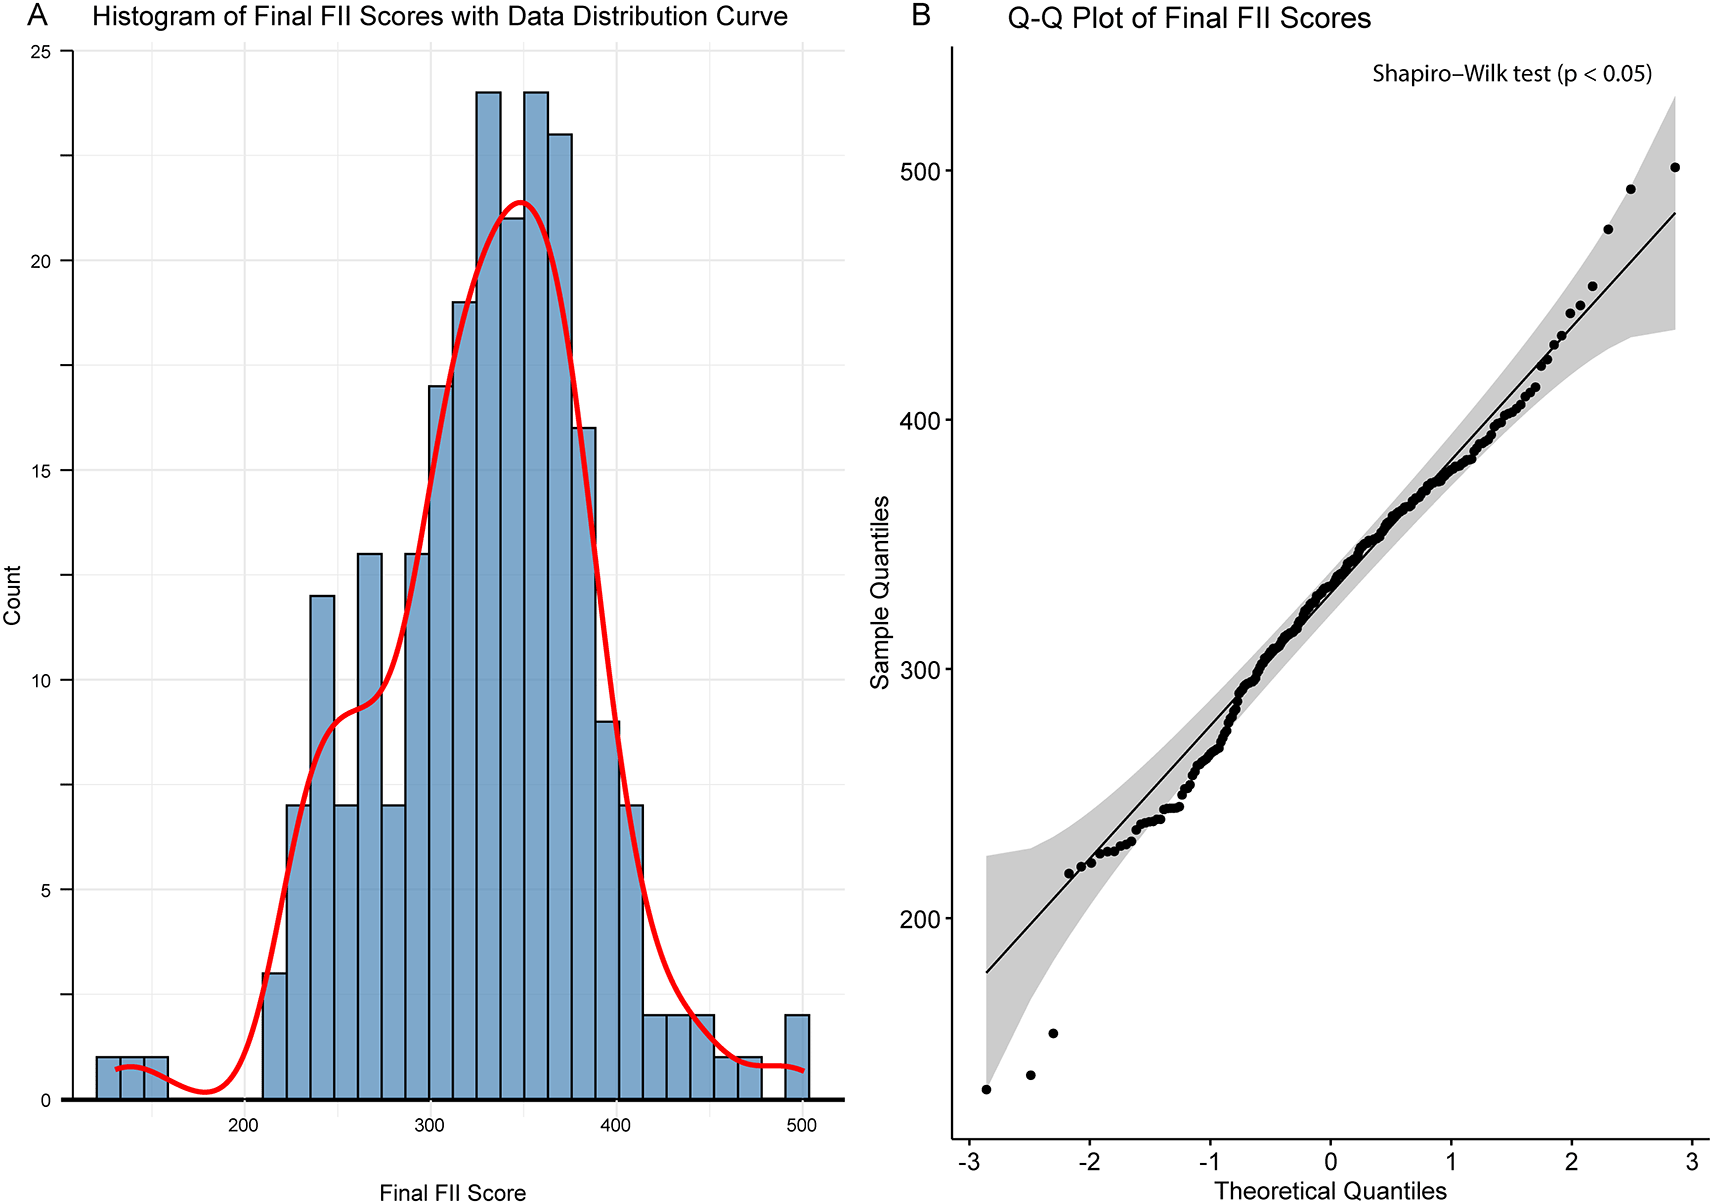
A) Displays a histogram (blue bars) with an overlaid density curve (red line) that depicts the data distribution. B) Shows a Q–Q plot comparing the sample quantiles to the theoretical quantiles from a normal distribution. Although points near the diagonal suggest normality, systematic deviations are evident, and the Shapiro–Wilk test (p < 0.05) confirms that the data significantly deviate from a normal distribution.
The Principal Coordinates Analysis (PCoA) plot visualizes the beta diversity of microbial communities across FII quartiles (Q1 - Q4), using Bray-Curtis distance ( Figure 3) as the dissimilarity metric. PCoA1 and PCoA2 explain 8.23% and 7.14%, respectively, of the microbial composition across the FII quartiles. The relatively low percentages suggest that microbial differences between FII quartiles are subtle but present. PERMANOVA analysis (adonis P = 0.001, R2 = 0.0214) confirms a significant effect of FII quartiles on microbiota composition. However, the low R2 value (2.14% variance explained) indicates that the effect size is minor, as reflected by the overlapping clusters in the PCoA plot.
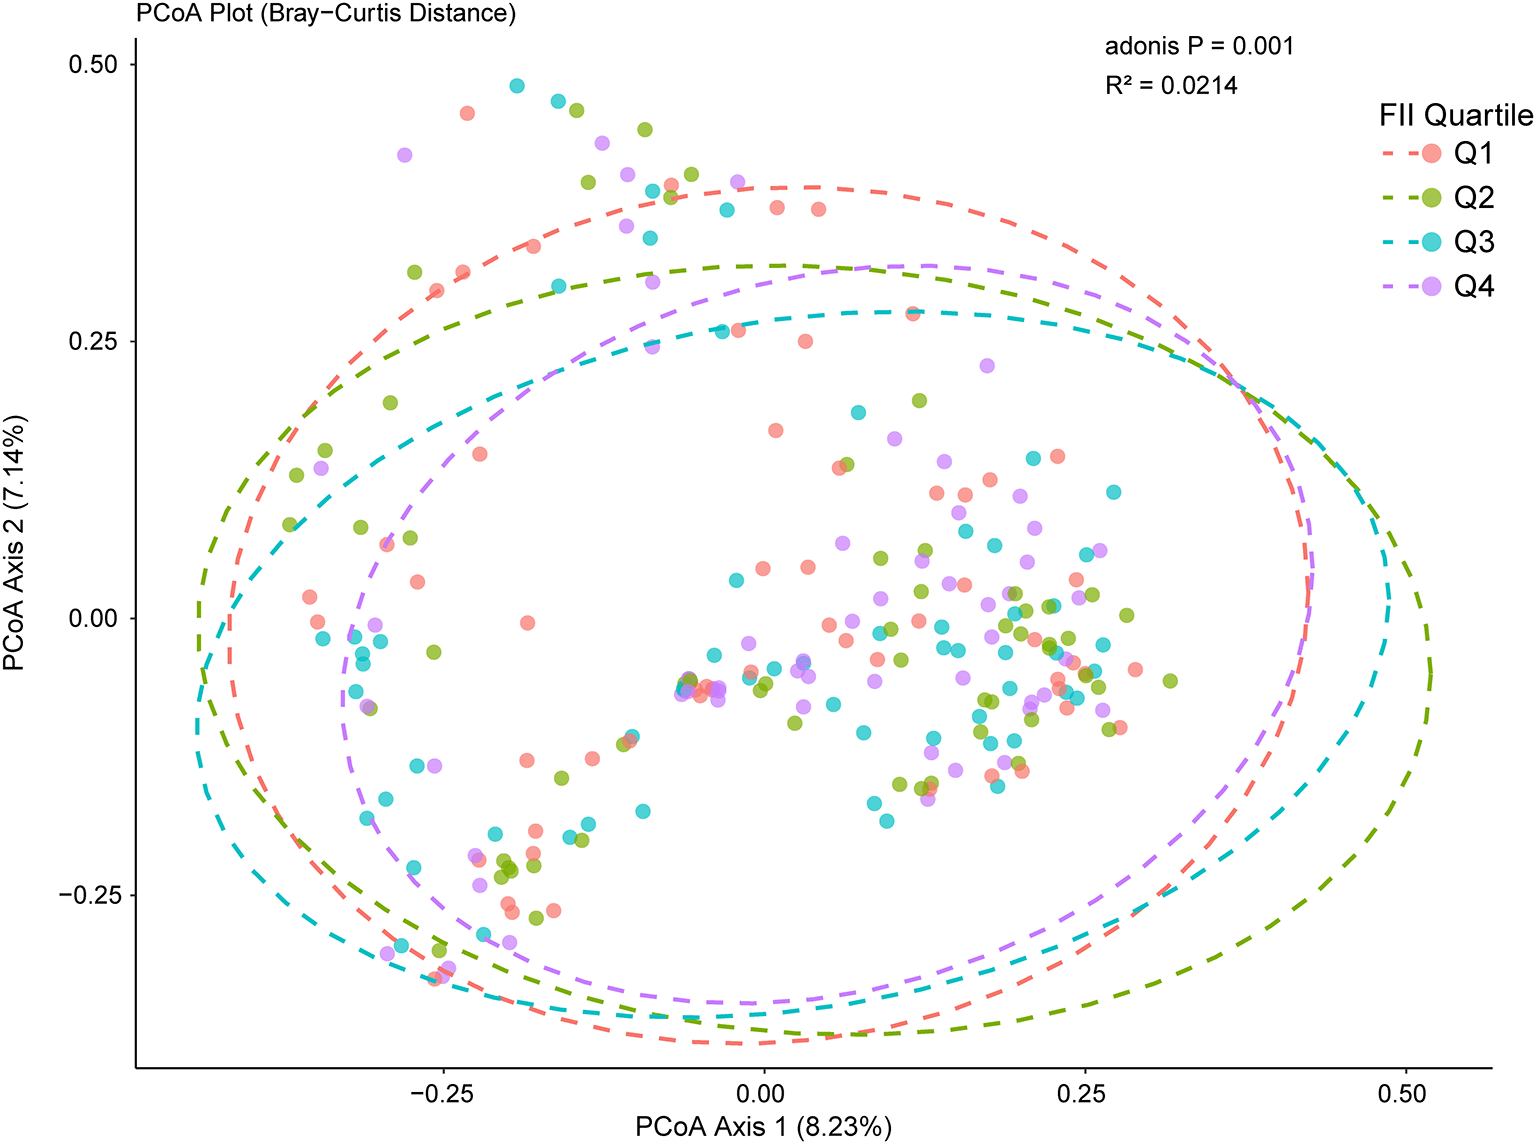
Principal Coordinates Analysis (PCoA) of microbiota composition based on Bray–Curtis distances. Each point represents an individual sample, colored by FII Quartile (Q1, Q2, Q3, Q4). The first two axes (PCoA Axis 1 and Axis 2) explain 8.23% and 7.14% of the total variation, respectively. Dashed ellipses indicate the approximate 95% confidence regions for each quartile group.
Figure S1 A and B show the Shannon and Simpson alpha diversity, respectively, across FII quartiles (Q1 - Q4), with no clear trend or significant differences observed. Alpha diversity represents the richness and evenness of microbial communities within individual samples, and these results suggest that FII has a minimal impact on microbial alpha diversity in this dataset.
Figure 4A shows the top 5 relative abundance of microbial taxa at the phylum level across different FII quartiles. Firmicutes and Bacteroidota dominate the distribution. Kruskal-Wallis tests revealed significant differences in the relative abundance of Firmicutes (p < 0.001) and Bacteroidota (p < 0.001) across FII quartiles, while other phyla showed no significant variation (p > 0.05). The pairwise Wilcoxon test showed significant differences in Bacteroidota and Firmicutes across FII quartiles. Bacteroidota abundance differed significantly between Q1 and Q4 (p-adjusted < 0.001), Q2 and Q4 (p-adjusted = 0.032), and Q3 and Q4 (p-adjusted < 0.001). Similarly, Firmicutes showed significant differences between Q1 and Q4 (p-adjusted < 0.001), Q2 and Q4 (p-adjusted = 0.037), and Q3 and Q4 (p-adjusted < 0.001). These findings suggest that microbial composition shifts mainly occur between the extreme FII quartiles, linking dietary inflammatory potential to microbiota differences. The Bacteroidota-to-Firmicutes (B/F) ratio showed a non-linear relationship with dietary inflammation, starting high in Q1 (2.04), decreasing in Q2 (1.28), and gradually increasing in Q3 (1.55) and Q4 (1.77) as FII increased. In Q1 (lowest FII, least inflammatory diet), the high B/F ratio suggests a microbiome composition associated with a healthier metabolic state, where Bacteroidota are more abundant than Firmicutes. Table 1 summarizes the statistics for the phylum level.
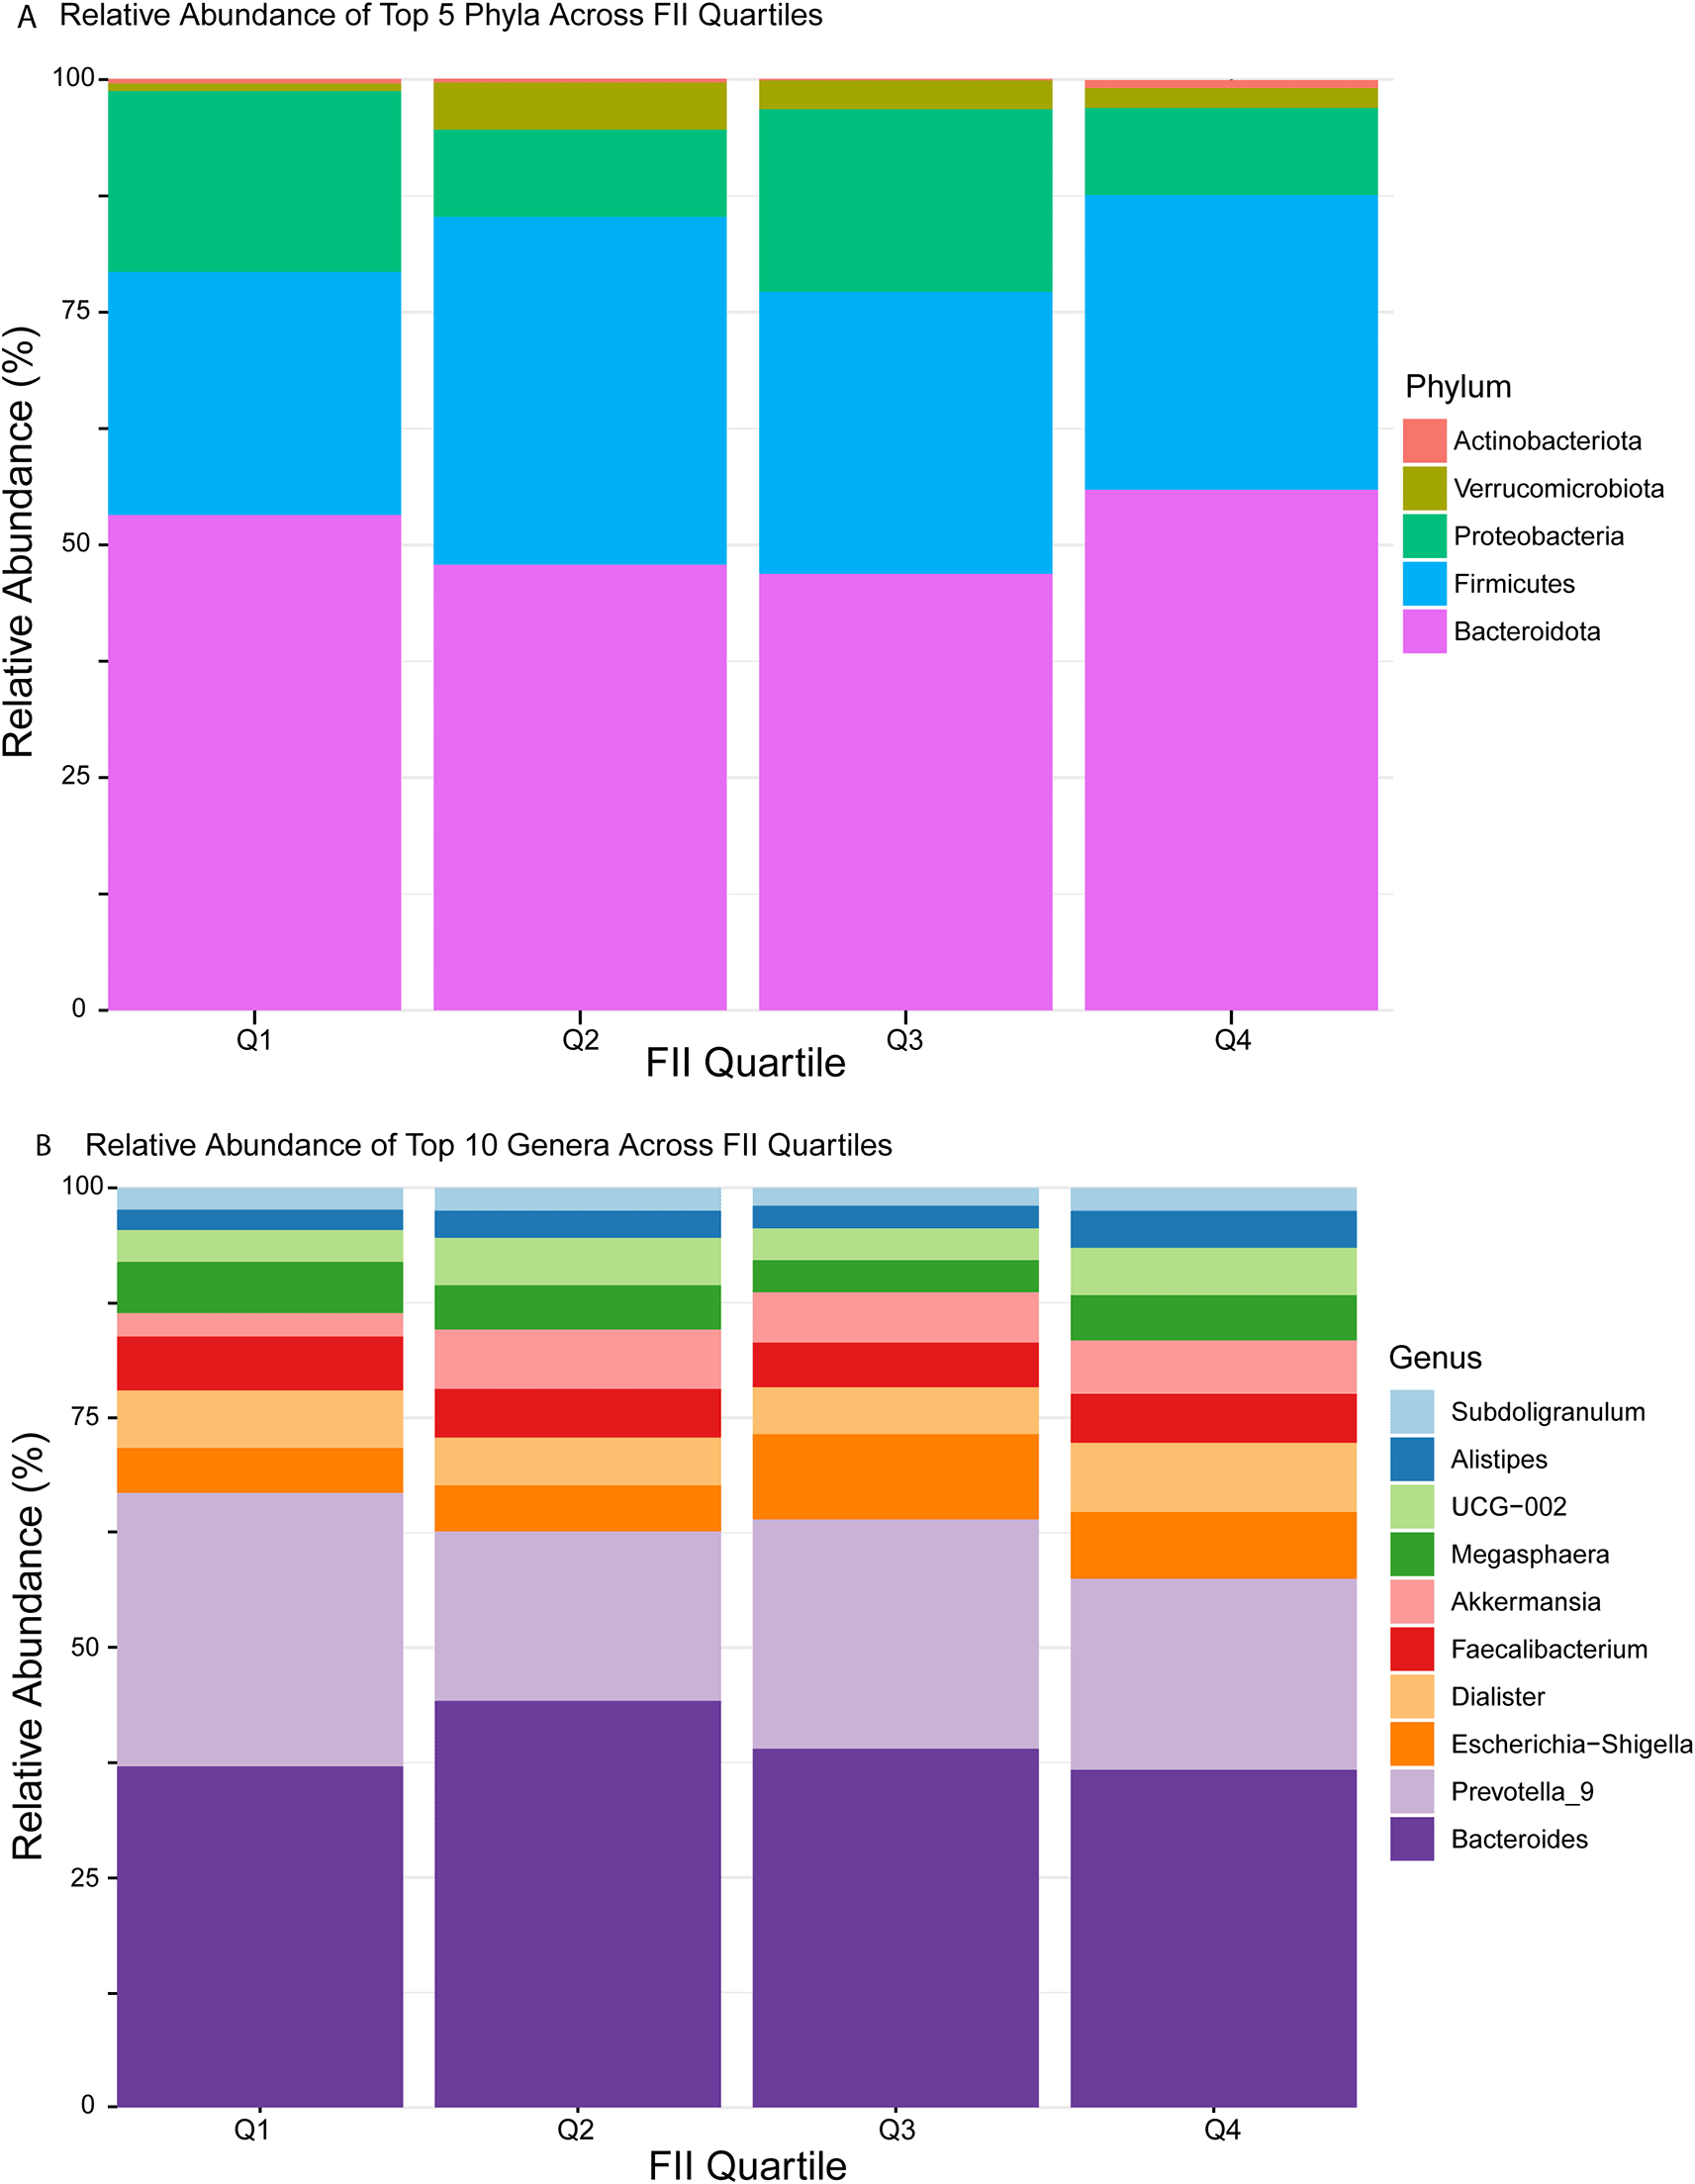
A) A stacked bar chart shows the percentage of relative abundance for the top 5 phyla. Each bar represents the cumulative percentage of the five most prevalent phyla within that quartile, color-coded by phylum. B) A stacked bar chart illustrates the percentage of the top 10 genera in relative abundance. Each colored segment's height reflects the proportion of that genus relative to the total microbial community.
Figure 4B illustrates the top 10 relative abundance of microbiota taxa at the genus level across different FII quartiles. Bacteroides and Prevotella_9 dominated the microbial communities, constituting the majority of microbiota composition. Significant differences were observed in the abundance of Bacteroides (p < 0.001, Kruskal-Wallis), Prevotella_9 (p = 0.04), and Alistipes (p = 0.002). Figure 5 shows the log10 relative abundance of the three significant genera across FII quartiles. Pairwise Wilcoxon tests revealed distinct patterns: Alistipes abundance notably increased from Q1 (lowest inflammation, 2.23%) to Q4 (highest inflammation, 4.03%), with significant differences specifically between Q1 and Q4 (p-adjusted = 0.002), Q2 and Q4 (p-adjusted = 0.01), and Q3 and Q4 (p-adjusted = 0.04). Bacteroides showed a nonlinear response, lowest in Q1 (37.11%) and highest in Q2 (44.22%), with significant differences observed primarily between Q1 and Q2 (p-adjusted < 0.001), Q1 and Q4 (p-adjusted = 0.001), Q2 and Q3 (p-adjusted = 0.014), and Q3 and Q4 (p-adjusted = 0.036). Prevotella_9 displayed the highest abundance in Q1 (29.71%), with a significant decrease by Q2 (18.39%, p-adjusted = 0.05). These genus-level changes highlight complex and genus-specific responses of the gut microbiota to dietary inflammatory potential (FII), underscoring notable microbial shifts associated particularly with higher dietary inflammation (Q4). Further details and complete statistics are summarized in Table 2.
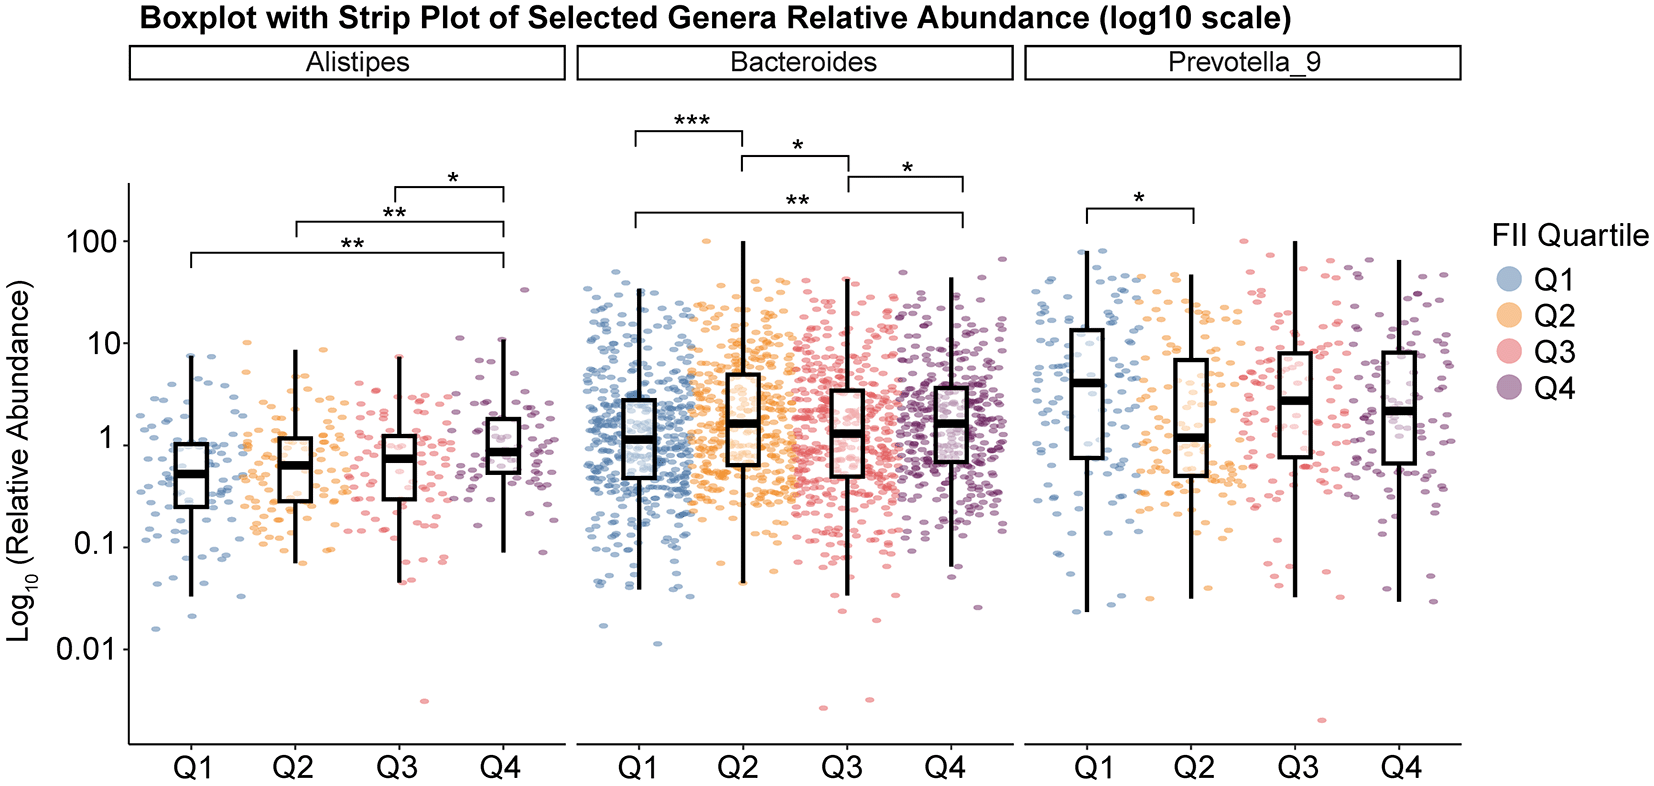
This figure shows boxplots overlaid with jittered data points (strip plots) for three selected genera, Alistipes, Bacteroides, and Prevotella_9, across four FII Quartiles (Q1, Q2, Q3, Q4). Each panel corresponds to one genus, and the y-axis (on a log10 scale) indicates the relative abundance of that genus in each sample. The boxplots summarize the distribution for each quartile (showing median, interquartile range, and whiskers), while the color-coded points represent individual samples. The horizontal brackets and asterisks above the boxplots denote the statistical significance of pairwise comparisons among the quartiles (*p < 0.05, **p < 0.01, ***p < 0.001).
Intestinal microbiota plays a crucial role in metabolic inflammation, which is a key driver of T2D. This disease is often linked to gut dysbiosis characterized by a decline in beneficial, short-chain fatty acid (SCFA) producing Firmicutes and also an increased abundance of pro-inflammatory genera such as Bacteroides.11,12 Diets high in fats, refined sugars, and other pro-inflammatory components, hallmarks of a Western dietary pattern, can further promote a state of chronic, low-grade inflammation.12 This occurs, in part, via compromised gut barrier integrity, which allows lipopolysaccharides (LPS) and other microbial products to translocate into the circulation, triggering systemic inflammation that exacerbates insulin resistance, a defining feature of T2D.11 Therefore, dietary interventions that limit pro-inflammatory components and foster the growth of SCFA-producing bacteria while enhancing gut barrier function may help reduce inflammation and improve glucose metabolism.11,12
This study explored the relationship between dietary inflammatory potential, measured by the FII, and gut microbiota composition in T2D patients.
Beta diversity analysis using Principal Coordinates Analysis (PCoA) revealed significant but subtle differences in microbiota composition across FII quartiles. PCoA1 and PCoA2 explained 8.23% and 7.14% of the microbial variation, respectively, while the PERMANOVA result (adonis P = 0.001, R2 = 0.0214) indicated a statistically significant effect of dietary inflammation on gut microbiota. This suggests that while FII plays a role, other diabetes-associated factors (e.g., medication use, metabolic dysregulation, insulin resistance) likely contribute more substantially to microbiota alterations.
Interestingly, alpha diversity indices (Shannon and Simpson) showed no significant differences across FII quartiles, suggesting that while microbial composition shifts occur, overall microbial richness and evenness remain stable. This finding aligns with prior research indicating that diabetes-driven microbial dysbiosis is characterized more by taxonomic composition changes rather than overall diversity loss.13–15
At the phylum level, significant differences were observed in the relative abundance of Firmicutes (p = 0.00003) and Bacteroidota (p = 0.000032), with the most pronounced differences occurring between extreme quartiles (Q1 vs. Q4). The Bacteroidota-to-Firmicutes (B/F) ratio showed a non-linear relationship with dietary inflammation, starting high in Q1 (2.04), decreasing in Q2 (1.28), and gradually increasing in Q3 (1.55) and Q4 (1.77) as FII increased. In Q1 (lowest FII, least inflammatory diet), the high B/F ratio suggests a microbiome composition associated with a healthier metabolic state, where Bacteroidota are more abundant than Firmicutes. This aligns with our previous study7 and other studies showing that diets with lower inflammatory potential are linked to an increased Bacteroidota proportion, which contributes to improved gut barrier function, enhanced fiber fermentation, and the production of anti-inflammatory metabolites.16–18 The lower Firmicutes levels in Q1 could reflect a microbiome environment less influenced by inflammatory dietary components, favoring a more balanced gut microbial ecosystem that may be beneficial for metabolic health.
As dietary inflammation increases (Q2 - Q4), microbiome shifts occur, with Firmicutes becoming more dominant in Q2, followed by a rebound in Bacteroidota at higher FII levels (Q3 - Q4). This pattern suggests that moderate inflammation (Q2) supports Firmicutes proliferation, potentially due to their capacity to utilize host-derived energy sources (e.g., mucin degradation) under inflammatory stress.19,20 However, at higher inflammation levels (Q3 - Q4), Bacteroidota increase again, possibly due to a shift towards inflammation-associated taxa within this phylum. This non-linear microbial adaptation may reflect gut microbiota resilience or dysbiotic shifts in response to increasing inflammatory burden. Given the role of gut microbiome composition in metabolic health, these findings suggest that dietary inflammation plays a complex role in shaping gut microbial communities in diabetes.
At the genus level, significant variations were identified in Bacteroides, Prevotella_9, and Alistipes, all of which belong to the phylum Bacteroidota. Specifically, Alistipes, a genus associated with anti-inflammatory properties primarily through the production of short-chain fatty acids (SCFAs), was significantly reduced in individuals consuming diets with high inflammatory potential (Q4) compared to the least inflammatory quartile (Q1). This decline in Alistipes aligns with prior studies indicating its protective role in gut barrier integrity and glucose metabolism regulation, suggesting that dietary inflammation may selectively diminish beneficial anti-inflammatory taxa.21–23 Bacteroides, recognized for its metabolic flexibility and previously linked to western dietary patterns and metabolic disturbances, exhibited a nonlinear pattern across quartiles.21,23 Such fluctuations may reflect adaptive microbial dynamics in response to dietary inflammatory stressors, indicating selective pressures influencing its abundance based on dietary context. Additionally, Prevotella_9, a subgroup of the Prevotella genus, is prominently involved in dietary fiber fermentation, SCFA production, and maintaining gut homeostasis, displayed significantly reduced abundance in higher dietary inflammation quartiles. The decreased abundance of Prevotella_9 suggests a disruption of anti-inflammatory microbial processes, potentially facilitating pro-inflammatory states commonly observed in metabolic disorders such as diabetes. Collectively, these genus-specific shifts, contextualized within their phylogenetic and functional backgrounds, highlight the intricate relationship between dietary inflammatory potential and microbial community structure, underscoring the potential clinical significance of microbiota-directed dietary interventions in managing inflammation and metabolic dysregulation in diabetic populations.
Overall, these findings suggest that dietary inflammatory potential contributes to gut microbiota alterations in diabetes, primarily at the phylum and genus levels, rather than affecting overall diversity. However, the small effect size (R2 = 2.14%) suggests that while the food inflammation index influences gut microbiota, other diabetes-related factors, such as hyperglycemia, insulin resistance and medication use, play a more dominant role. Chronic hyperglycemia alters microbial diversity and gut permeability, while insulin resistance and metabolic inflammation contribute to dysbiosis. Additionally, diabetic medications, such as metformin and SGLT2 inhibitors, significantly modulate the microbiome, potentially overshadowing dietary effects.
Despite the valuable insights provided by this study, several limitations should be acknowledged. First, the cross-sectional design prevents establishing causal relationships between dietary inflammation, gut microbiota composition, and diabetes progression. Longitudinal studies are needed to determine the temporal effects of dietary inflammatory potential on microbiome shifts. Second, while the FII provides a useful measure of diet-induced inflammation, dietary data was self-reported, which may introduce recall bias and affect the accuracy of dietary assessments. The small R2 may also indicate the need for a larger sample size to capture more subtle associations, highlighting the importance of further research with longitudinal data and controlled dietary interventions. Additionally, this study utilized 16S rRNA gene sequencing for microbial analysis, which, while effective for taxonomic classification at the phylum and genus levels, lacks the resolution to differentiate species and strain-level variations. Future studies should consider using shotgun metagenomic sequencing, which provides higher taxonomic resolution and functional insights into the microbial community. Incorporating metagenomics would allow a deeper understanding of how specific microbial genes and pathways interact with dietary inflammation and metabolic health.
Ethical approval of the study was obtained from the Imam Abdulrahman Bin Faisal University Institutional Review Board committee, Dammam (IRB#2019-01-112), and the study was conducted according to the ethical principles of the Declaration of Helsinki and Good Clinical Practice guidelines. All patients included in the study signed a written informed consent form.
AFA, RAA, AHA, WIA, FAA, JMA, CV, CC, BL, RMS, and AH were involved in the design of the work, critically revising of protocol, patient recruitment, data acquisition, interpretation of data, and drafting of the manuscript. AA, FAA, CV, BL, AKA, BK, and AH were involved in the design of the work, analysis, interpretation of data, and drafting of the manuscript.
The raw 16S rRNA datasets generated during the current study are available in the European Nucleotide Archive (ENA) repository, https://www.ebi.ac.uk/ena/browser/view/PRJEB57370, under the title “Diabetes microbiota study from a representative Saudi Population” with accession number PRJEB57370. All requests for data can be sent to the corresponding author, and verified academic investigators will be granted full access.
All the values behind the means, standard deviations and other measures are reported in Supplementary tables 1, 2, 3 and 4, https://doi.org/10.5281/zenodo.15694848.
Data are available under the terms of the Creative Commons Attribution 4.0 International license (CC-BY 4.0).
Questionnaire, Questionnaire Protocol and example consent forms, are reported in Supplementary documents 1,2 and 3, https://doi.org/10.5281/zenodo.15694848.
| Views | Downloads | |
|---|---|---|
| F1000Research | - | - |
|
PubMed Central
Data from PMC are received and updated monthly.
|
- | - |
Provide sufficient details of any financial or non-financial competing interests to enable users to assess whether your comments might lead a reasonable person to question your impartiality. Consider the following examples, but note that this is not an exhaustive list:
Sign up for content alerts and receive a weekly or monthly email with all newly published articles
Already registered? Sign in
The email address should be the one you originally registered with F1000.
You registered with F1000 via Google, so we cannot reset your password.
To sign in, please click here.
If you still need help with your Google account password, please click here.
You registered with F1000 via Facebook, so we cannot reset your password.
To sign in, please click here.
If you still need help with your Facebook account password, please click here.
If your email address is registered with us, we will email you instructions to reset your password.
If you think you should have received this email but it has not arrived, please check your spam filters and/or contact for further assistance.
Comments on this article Comments (0)