Keywords
Climate Change, Environmental Responsibility, Green Innovation, PLS-SEM, Sustainable Banking
This article is included in the Climate gateway.
Climate Change, Environmental Responsibility, Green Innovation, PLS-SEM, Sustainable Banking
Green banking (GB) has increasingly captured the focus of global banking and financial sectors, motivated by the pressing demand for environmental protection and sustainable growth (Rai et al., 2019; Trehan, 2015). Defined by Bangladesh Bank as banking practices aimed at environmental preservation while addressing social, economic, and environmental concerns, GB was first introduced by Bangladesh Bank and later adopted by Laxmi Bank in Nepal (Masukujjaman & Aktar, 2013; Mehta & Sharma, 2016). The growing global environmental concerns have led to initiatives that evaluate and reward sustainable financial institutions, such as the ‘Golden Peacock Climate Management Award’ (Chen et al., 2022). Furthermore, as banks adapt to environmental pressures, individuals are also increasingly seeking to enhance their effectiveness in various fields, such as job searching (Dahal et al., 2023). Although banks are not the primary sources of pollution, they indirectly impact the environment by financing polluting industries and through operational practices that contribute to their carbon footprint (Upadhyay, 2020). Consequently, adopting green banking practices (GBP) and green financing (GF) is crucial for mitigating environmental degradation (Meena, 2013).
Green banking involves incorporating eco-friendly measures into banking operations and considering environmental factors in investments (Shaumya & Arulrajah, 2017). This approach includes reducing greenhouse gas emissions and promoting sustainable activities through strategic alignment, policy implementation, and operational efficiency within the banking sector (Khan et al., 2023; Shrestha et al., 2022). GF supports environmentally friendly initiatives and provides economic benefits. However, a significant portion of Nepalese bankers remain unaware of GB despite its presence in their institutions (Tandukar et al., 2021).
Nepal faces an urgent need to implement a green financing system, as it is ranked the ninth most climate-vulnerable country by Germanwatch (2020). Despite aiming for carbon neutrality by 2045, Nepal’s financial sector has primarily allocated loans to mostly medium-to-high risk, defined by the environmental and social (E&S) risk category, without adequate environmental risk assessments (UNDP, 2022). Moreover, financial institutions (FIs) are not mandated to report climate risk exposure at the portfolio level, nor are their E&S policies, practices, and outcomes subject to external verification through independent reviews or assurances (UNDP, 2022). The limited promotion of GF, along with existing climate challenges, underscores the necessity for more robust environmental practices in Nepal (Pant, 2017). Noteworthy initiatives by the NMB and Laxmi Bank demonstrate some progress, but the overall participation in GBP and GF remains below the global average (UNDP, 2022).
Implementing GB requires an integrated approach involving all stakeholders, with regulatory bodies providing necessary support (UNDP, 2022). Nepal has committed to some international agreements and has introduced new guidelines and policies to encourage green investments; however, harmonizing these rules remains a challenge (NEF, 2021). Environmental degradation poses a significant issue in Nepal, with considerable economic losses from climate-induced disasters and severe air pollution in Kathmandu (UNDP, 2022). While some banks have initiated measures to manage environmental impacts, these efforts seem limited and insufficient. The relatively new concept of green banking in Nepal has not been widely explored, and the active promotion of green initiatives by banks is lacking (Upadhyay, 2020). Even with the Nepal Rastra Bank (NRB)’s introduction of the ESRM guidelines, full market adoption remains incomplete (UNDP, 2022).
This study investigates the effects of green financing and green banking initiatives on the environmental performance (EP) of banks in Nepal. It aims to provide insights that could help Nepalese banks adopt practices aligned with environmental concerns, contributing to both local and global sustainability efforts.
The research outcomes have important implications for academics, financial institutions, policymakers, investors, and environmental organizations. For academics, this study provides deeper insights into how green banking influences environmental performance. Banks offer strategies to become greener and achieve their environmental goals. Policymakers can adjust regulations to support green investments, and environmental organizations can advocate sustainable financial practices. This study seeks to encourage Nepalese banks to use green practices, promoting a sustainable future for the banking sector and beyond.
Triodos Bank, founded in the Netherlands in 1980, is credited with introducing the idea of “Green banking,” which has since influenced the banking industry in Western countries to adopt environmentally sustainable practices. Banking systems in other countries have embraced this concept (Shaumya & Arulrajah, 2017). In the context of Green Banking Practices (GBP), “green” signifies a commitment to environmental accountability and performance in banking operations (Bai, 2011; Dahal et al., 2020). Green banking practices aim to foster an eco-friendlier environment by optimizing policies, strategies, and guidelines related to banking services, business, and internal operations (Khan et al., 2023). Green Finance (GF) encompasses financial activities designed to achieve positive environmental outcomes and bolster future resilience. As defined by the World Economic Forum, this includes investments and loans that support the growth of green ventures, reduce the climate impact of existing initiatives, and both. Environmental performance extends beyond mere corporate environmental protection; it encompasses a proactive, transparent, and long-term approach to achieving specific goals in corporate planning that safeguard natural resources and enhance firm competitiveness (Shaumya & Arulrajah, 2017). It represents an output in environmental management, reflecting a company’s products and activities’ impact on the natural environment and illustrates the extent of a firm’s commitment to environmental stewardship (Klassen & Whybark, 1999).
Malsha et al. (2020) analyzed the mediating role of employee green behavior (EGB) on the sustainable performance of banks (SPB). Their research crucially analyzed the interplay between EGB, GBP, and SPB in Sri Lanka. This study focuses on how EGB mediates the link between SPB and GBP. The findings reveal a significantly positive linear association between SPB and GBP, SPB and EGB, and EGB and GBP for the banks examined. Extended analyses highlight that EGB significantly mediates the relationship between SPB and GBP, suggesting that banks enhance their sustainability performance by supporting employees in adopting green practices. Despite this, the study noted that while EGB’s mediating effect was statistically significant, it appeared somewhat modest in strength. Thevanes and Arulrajah (2020) investigated the connections among environmental training (ET), employee environmental behavior (EEB), and organizational environmental orientation (OEO), specifically examining how EEB mediates the relationship between ET and OEO. Their empirical findings indicate a significantly positive relationship between ET and OEO. Furthermore, there is a positive and significant link between ET and EEB. This study emphasizes that effective environmental training is vital for enhancing organizational initiatives in shaping environmental orientation. Without adequate training, achieving robust environmental orientation is an impractical goal. The implementation of environmental training activities is a constructive and cost-effective strategy for overcoming organizations’ environmental concerns.
Rehman et al. (2021) examine the link between green banking practices and their effects on environmental performance, both directly and indirectly, within the context of Pakistan. Their findings underscore the pivotal role of green initiatives in fostering a sustainable environment, particularly in shaping policies and green investment. They also emphasized the significant influence of policy frameworks, day-to-day operations, and investment strategies on the adoption and success of green banking practices. Chen et al. (2022) focused on the impact of green banking practices on the environmental performance of private commercial banks in Bangladesh and explored green finance as a key driver. Analyzing primary data from 322 banking employees, this study demonstrated that financing green projects substantially enhances banks’ environmental outcomes. Moreover, the operational and policy aspects of green banking were found to have a significant impact on environmental performance. Similarly, Zhang et al. (2022) investigate how green banking activities contribute to green financing and environmental performance in Bangladeshi private commercial banks. Their research also assesses the mediating role of green financing in this dynamic. The study finds that green banking practices positively influence banks’ environmental performance, with green financing providing a significant boost. These findings highlight the crucial role of green banking in advancing green financing efforts, reducing pollution, and promoting sustainable development. Descriptive statistics further revealed key benefits, such as greater competitiveness, cost reductions, better online banking facilities, and diminished carbon footprints. Green banking supports energy conservation and eco-friendly projects.
Guang-Wen and Siddik (2022) explore the effects of Corporate Social Responsibility (CSR) and green finance on the environmental performance of banking institutions in Bangladesh. Their analysis of data from 388 employees using structural equation Modelling (SEM) revealed that CSR initiatives positively influence environmental outcomes. The study also identifies significant links between the environmental, economic, and social dimensions of green finance and improved environmental performance. This research underscores the importance of CSR and green finance in enhancing banks’ sustainability efforts, offering valuable insights for managers in emerging economies. Risal and Joshi (2018) assess the effect of GBP on the EP of Nepalese banks. Surveying 189 bankers from five major Nepalese banks, the research found that GBP significantly contributed to EP, accounting for 6.8% of the observed variation. The study identified strong connections between environmental training, green policies, and energy-efficient technologies, although it noted no significant effect of customer-related initiatives. The research concludes that green banking practices positively influence the environmental performance of Nepalese banks. Upadhyay (2020) highlighted the importance of raising awareness and encouraging the adoption of green banking practices in Nepal as technological advancements continue to reshape the banking landscape. Their study discussed the “Go Green” initiative, which aims to promote sustainable practices among banks, their systems, and clients by offering cost-effective digital banking solutions. While green banking presents a significant opportunity for environmental conservation by reducing paper usage, the research pointed out that Nepalese banks still lag in their adoption, stressing the need for a more robust commitment to sustainable development.
Devkota et al. (2021) explored the level of awareness regarding green banking practices in Nepal. Their research indicates that both clients and bankers tend to prioritize brand loyalty over an understanding of green banking, as noted by Ghimire and Karki (2022). To address this gap, this study recommends that banks and government entities collaborate to raise public awareness through strategic policy initiatives aimed at promoting green banking practices.
Tandukar et al. (2021) investigate the adoption of green banking practices among commercial banks in Nepal, focusing on the perspectives of bankers. This study aims to assess bankers’ perceptions and the factors shaping their views on the effectiveness of green banking. Data were gathered from banks in Kathmandu Valley between November 2024 and March 2025 using purposive sampling, with 326 participating financial representatives. Utilizing an explanatory research design, this study combined both primary and secondary data to analyze the causal relationships between key variables. Descriptive and inferential statistical methods, including the creation of an awareness index, were used to evaluate the data. The findings revealed a general lack of concern among bankers regarding green banking practices, with only 5% of respondents demonstrating awareness of these practices within their institutions. Mishra and Aithal (2022) explored green financing in Nepal, emphasizing its societal role in securing a sustainable future. Their review highlighted that green financing is now essential for industries worldwide to achieve climate-resilient growth and to blend environmentalism with capitalism. This concept, although still niche, has proven useful across multiple sectors to promote sustainable growth and mitigate workplace incivility (Bhattarai et al., 2024). These studies underscore the importance of adopting proactive strategies through green financing to foster long-term resilience.
This study examines the influence of green banking practices on the environmental performance of commercial banks (CBs) in Kathmandu by focusing on the mediating role of green finance. In this framework, green banking practices function as an independent variable, green finance as a mediating variable, and environmental performance as a dependent variable. The conceptual model illustrated in Figure 1 draws on prior research, particularly the work of Zhang et al. (2022), which provides a theoretical foundation for exploring these interrelationships.
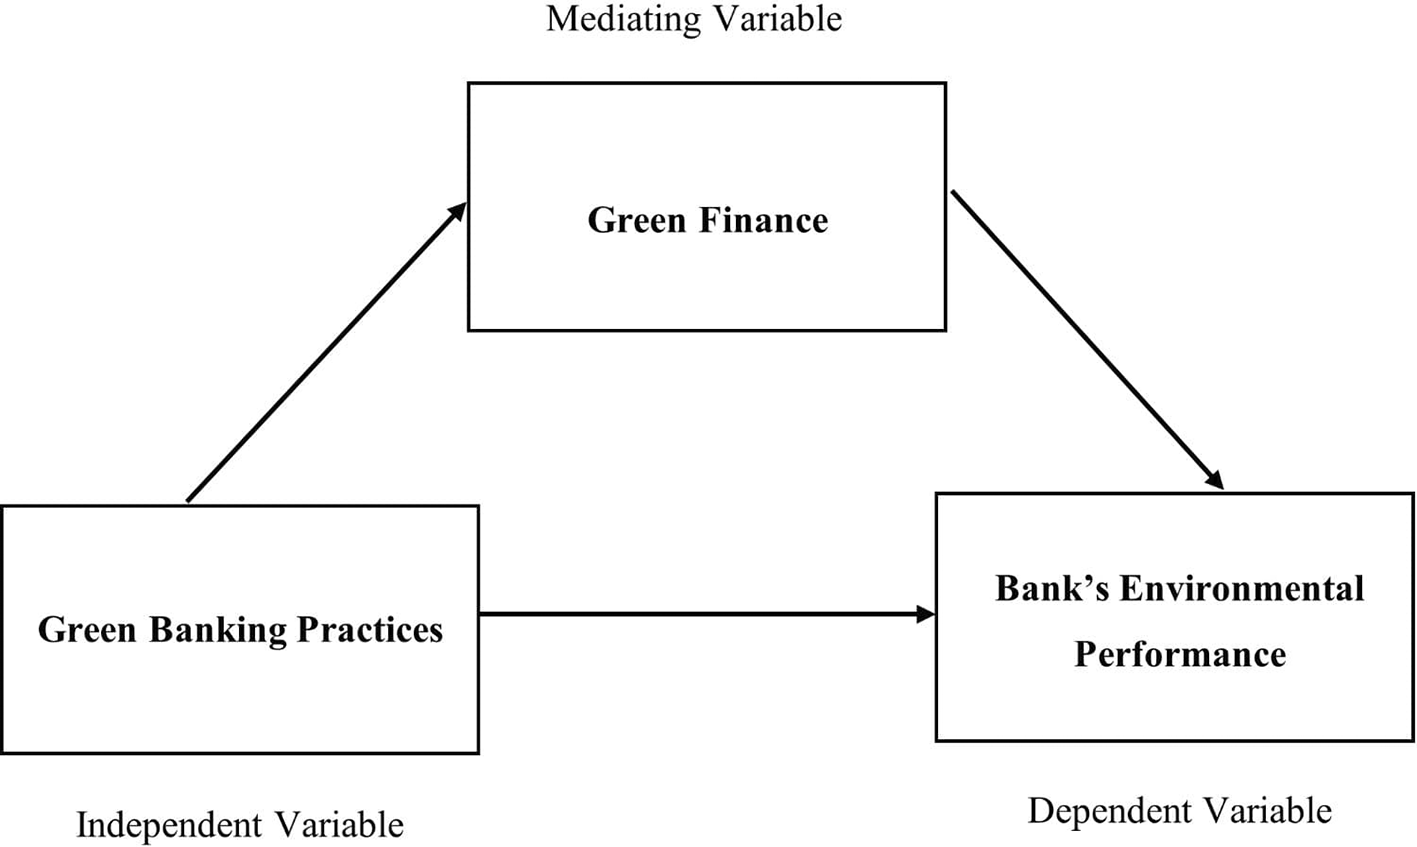
Conceptual framework illustrating the hypothesized relationships among Green Banking Practices (GBP), Green Finance (GF), and Banks’ Environmental Performance (BEP). The framework positions GBP as the independent variable, GF as the mediating variable, and BEP as the dependent variable, based on prior studies such as Zhang et al. (2022).
Source: Zhang et al. (2022).
Green Banking Practices (GBP) and Bank Environmental Performance (EP): GBP involves banks actively engaging in environmental sustainability efforts both within their operations and externally. Research indicates a strong link between GBP and improved EP in banks. For instance, Risal and Joshi (2018) found that green policies, environmental training, and energy-efficient technologies significantly enhance banks’ EP. Vidyakala (2020) also finds that adopting green banking practices positively influences environmental outcomes. These practices contribute to reducing environmental impacts by minimizing paper usage, fuel consumption, and carbon emissions, while fostering environmental benefits such as enhanced employee training, green infrastructure, and renewable energy utilization (Akter et al., 2017). Additional studies, including those by Shaumya and Arulrajah (2017) and Chen et al. (2022), further support the beneficial effects of GBP on EP.
Green banking practices significantly influence banks’ environmental performance.
Green Banking Practices (GBP) and Green Finance (GF): GF is a prime driver of sustainable development, emphasizing environmental stewardship and social responsibility (Liu et al., 2021). Green financing can effectively reduce both the internal and external carbon footprints of banks (Zheng et al., 2021). Chen et al. (2022) observe that various green banking activities, including those involving employees, daily operations, and institutional policies, positively influence green financing in Bangladeshi private commercial banks (PCBs). Rehman et al. (2021) further emphasized the significant influence of GBP on investments in green projects. Malsha et al. (2020) explored the connections between employee green behavior, GBP, and overall sustainability performance.
GBP significantly impacts green finance.
Green Finance and Bank Environmental Performance: Banks are pivotal in financing businesses and industries, which makes them responsible for environmental impact. Zhang et al. (2022) showed that GF positively influences the EP. Siddik and Zheng (2021) found that green financing helps reduce banks’ carbon footprint. Zhou et al. (2020) also reported that GF foster EP. Additionally, Bihari and Pradhan (2011) emphasized that GBP involves assessing the environmental consequences of projects before financing them, thereby promoting social and environmental accountability.
Green finance significantly influences banks’ environmental performance.
Green Banking Practices, Green Finance, and Banks’ Environmental Performance: The mediating role of GF in the link between GBP and EP is relatively under-explored. Zhang et al. (2022) document that GF serves as a mediator in this relationship within Bangladeshi commercial banks, amplifying the effect of GBP on EP. This suggests that GF acts as a catalyst, thereby enhancing the effects of GBP on environmental sustainability.
GF mediates the relationship between GBP and banks’ EP.
This study employed a quantitative causal research design to examine the effect of green banking practices (GBP) on banks’ environmental performance (BEP), with green finance (GF) as a mediating variable. Researchers have used a cross-sectional approach to collect data through structured questionnaires distributed both online and in the field. The design aimed to identify the direct and indirect relationships between GBP, GF, and BEP. Partial Least Squares Structural Equation Modelling (PLS-SEM) was used for data analysis, given its suitability for complex models and small sample sizes. This approach provides clear insight into how sustainable banking practices influence environmental outcomes.
The research is centred on the Kathmandu Valley because of its concentration of corporate offices and headquarters for all 20 commercial banks in Nepal. As of mid-July 2024, these banks represented the full population of commercial banks operating in the country. Therefore, this study focuses on employees working within commercial banks in the Kathmandu Valley. This study collected data using self-administered questionnaires distributed during a field survey conducted between November 2024 and March 2025, ensuring timely and relevant responses from the target population.
Judgmental sampling was used in the first stage of this study. Employees working at the top ten profitable commercial banks in Nepal were taken as the sample frames. As per NRB in 2022, the banks that fall under the top ten profitable commercial banks of Nepal (in terms of net profit) include Global IME Bank Ltd. (GBIME), Rastriya Banijya Bank Ltd. (RBB), Nabil Bank Ltd. (NABIL), NIC Asia Bank Ltd. (NICA), Nepal Investment Mega Bank Ltd. (NIMBL), NMB Bank Ltd. (NMB), Nepal Bank Ltd. (NBL), Siddhartha Bank Ltd. (SBL), Prime Commercial Bank Ltd. (PCBL), and Kumari Bank Ltd. (KBL) respectively. Therefore, in the first stage, a judgmental sampling technique was used to select the top ten profitable commercial banks in Nepal.
In the second stage, a quota-sampling approach was applied. Quota sampling was employed to obtain data from commercial bankers in the Kathmandu Valley. A quota of 25 respondents from each of the selected top ten banks (based on net profit) was used, which adds up to 250 respondents as a sample size. Furthermore, to select 25 respondents from each of the selected top ten commercial banks, a convenience sampling approach was utilized. Although the study focused on a target sample of 250 respondents, with 25 respondents selected from each of the participating banks, an additional 29 samples were received, which were also used in data analysis as valuable information; 279 sample sizes were recorded.
Consent statement
Written informed consent was obtained from all participants after clearly explaining the study’s purpose, procedures, and right to withdraw at any time. No minor participants participated in this study. The Ethics Committee of Tribhuvan University, Faculty of Management, Nepal Commerce Campus, granted ethical approval for this study (Ref. No. 469/081–82) on 28 November 2024, before data collection began.
The study used a five-point Likert scale to measure participants’ responses. On this scale, a rating of one represented strong disagreement, whereas a rating of five signified strong agreement with the statements associated with each variable. Tables 1 and 2 present the latent variables with their measurements, and the observed variables with their definitions, respectively.
| Constructs | Number of observed items and adopted from |
|---|---|
| Green Banking Practices (GBP) | 10 items were adopted and updated from the previous studies (Shaumya & Arulrajah, 2017; Risal & Joshi, 2018; Malsha et al., 2020; Chen et al., 2022; Zhang et al., 2022) |
| Green Finance (GF) | 6 items have been adopted and modified from the study of Chen et al. (2022) |
| Bank’s environmental performance (BEP) | 6 items have been adopted and modified from the study of Malsha et al. (2020) |
The SEM is a sophisticated statistical method. This tool demonstrates the capacity to portray connections between diverse types of variables, encompassing both observable and latent variables, along with an increasing number of generated variables (Tarka, 2018). The SEM process involves a confirmatory method for analyzing data and is best utilized to confirm the validity of a particular model.
For an acceptable implementation, a higher level of advancement necessitates a more thorough understanding of facts and presumptions. Structural equation models extend traditional regression models by including many independent and dependent variables, which can be represented by collections of observable variables. The structural equation model encompasses two primary constituents: the dimension concept and SEM.
The measuring models specified in Muthén and Asparouhov (2012) are:
The SEM specified in the same is:
Where,
y = outcome variables
x = input variables
Λy = Observed response variables (latent variables)
Λx = Observed response variables (latent variables)
ε and δ = error
η = Latent variables (observed response variables)
ξ = Latent variables (observed response variables)
α = vector of intercepts
β = matrix of coefficients for endogenous variable regressions (ηi)
Γ = matrix of coefficients in the structural relationship of exogenous latent variables (ξ).
Within this context, the symbol “y” stands for the array of observable variables, while the symbol “x” signifies the array of input variables. Vectors δ and ε indicate the presence of measurement errors in the “x” (independent variable) and the “y” (dependent variable), respectively. Latent variables η and ξ were not directly observed in this study. Instead, the observed variables “y” and “x” were employed to assess the factor loadings Λy and Λx, respectively. These factor loadings illustrate the relationship between the observed and latent variables. Parameter α in the structural model represents a collection of intercepts. Matrix β comprises the coefficients governing the relationships between the endogenous variables (ηi), with zeros positioned on the diagonal. Matrix (I –β) remains nonsingular. The matrix Γ captures the coefficients governing the impact of the structural linkage of exogenous latent variables (ξ). Finally, ζ constitutes a random vector of the residuals.
However, the reduced form of the structural model in equations (1) through (3) can be written as follows if the errors are limited to the y-variables:
We analyzed the survey data collected via the KOBO Toolbox using MS Excel for data entry and tabulation, and SPSS and PLS-SEM version 4 for statistical analysis. PLS-SEM served as the primary tool for assessing the validity, reliability, hypothesis testing, mediation, and path analysis. The results are presented in the Tables and graphs. The analysis began with descriptive statistics to profile respondents, followed by inferential analysis to examine the impact of Green Banking Practices (GBP) on banks’ Environmental Performance (EP). The analysis was comprised of two main parts: descriptive and inferential.
4.1.1 Socio-demographic characteristics of respondents
Sociodemographic characteristics of the surveyed sample are included in this section. Information was gathered from employees at 10 commercial banks in the Kathmandu Valley. These banks were selected based on their ranking as the top ten most profitable banks in terms of net income, with diversified portfolios (Karki et al., 2023), according to the 2022 annual report of the NRB. Furthermore, this section includes gender, age, bank, designation, education qualification, and working experience, which have been tabulated and presented in one kind of diagram so that a perfect picture of the socio-demographic characteristics can be interpreted.
Gender of respondents
Figure 2 shows that out of 279 respondents, there were 157 males and 122 females, which consisted of 56% and 44%, respectively. The researcher observed that the ratio of male respondents was higher than that of female respondents. The results of this study confirm that the majority of employees of the selected ten commercial banks in Kathmandu Valley are males, which shows that the banking sector seems to attract slightly more males than females.

Distribution of the 279 respondents by gender, showing that 56% were male (157) and 44% were female (122). The data indicate a higher male participation in Nepalese commercial banks, reflecting trends noted in prior research that banking jobs attract slightly more male employees.
Source: Survey Data.
Similarly, a study conducted by Pande and Chalise (2022) stated that women occupy almost 40% of the workforce in the commercial (A-class) banking sector in Nepal. A similar study carried out by Khan et al. (2023) also found that 60% of the survey respondents who were commercial bankers were male and 40% were female.
Age group of respondent
Age is significant because of its linkage with accumulated individual and personal knowledge and behaviors. Figure 3 displays the age distribution of the survey respondents. The age groups were divided into four subcategories: 18 to under 28 years, 28 to under 38 years, 38 to under 48 years, and 48 years and above.
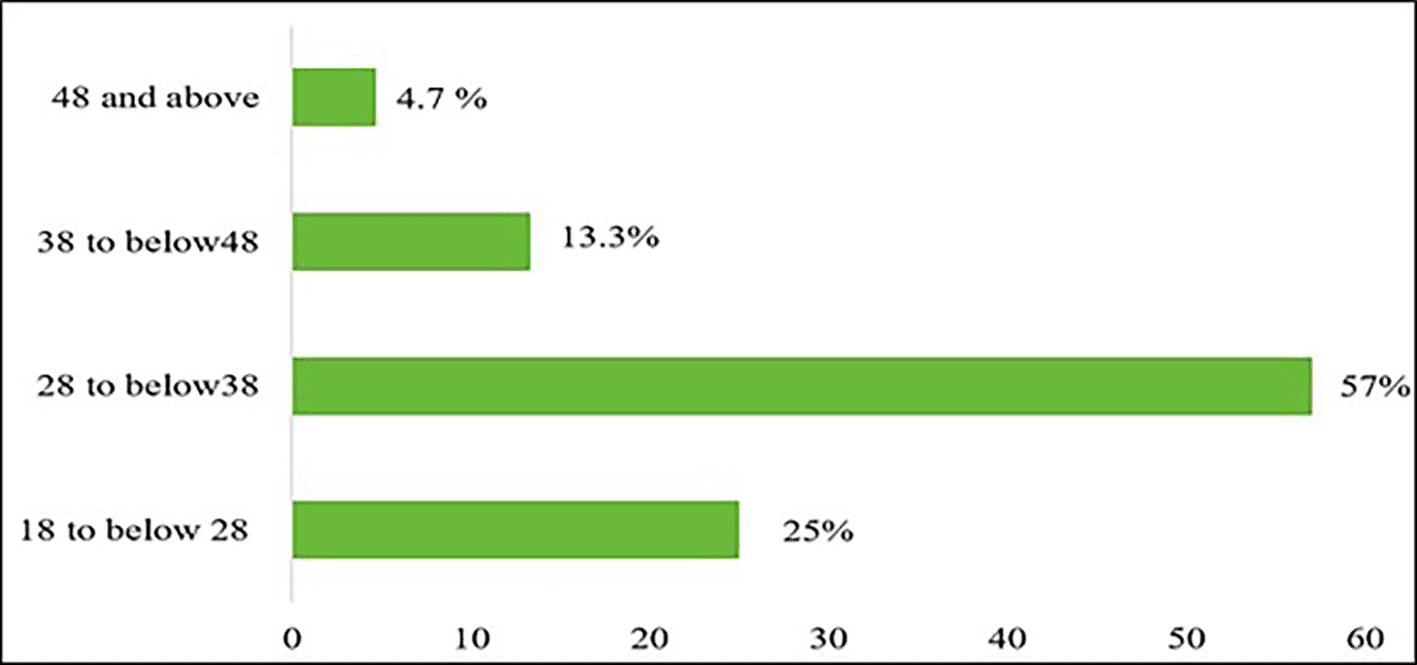
Age distribution of respondents across four groups: 18–28, 28–38, 38–48, and 48 years and above. The majority (57%) belonged to the 28–38 years category, highlighting the predominance of young and mid-career professionals in Kathmandu’s banking sector.
Source: Survey Data.
As shown in Figure 3, out of the 279 total respondents, the majority (57%) fell within the 28 to under-38 age group. The second largest group is those aged 18 to 28 years old, consisting of 25% of respondents. The 38 to 48-year-old group makes up 13.30% of respondents, and the 48-year-old and above group was the smallest at 4.70%. Hence, the data show that the age bracket of 28–38 years comprises the bulk of the responders.
Similarly, Tandukar et al. (2021) observed that most bankers were older than 21. Specifically, 22% of respondents were within the 31-40 age range, 4.9% were between 41 and 50 years, and only 2 percent were over the age of 51 years. Thus, the dominance of the 28 to 38 age group suggests that a significant portion of the banking industry’s workforce is filled with young and young adult workers in commercial banks.
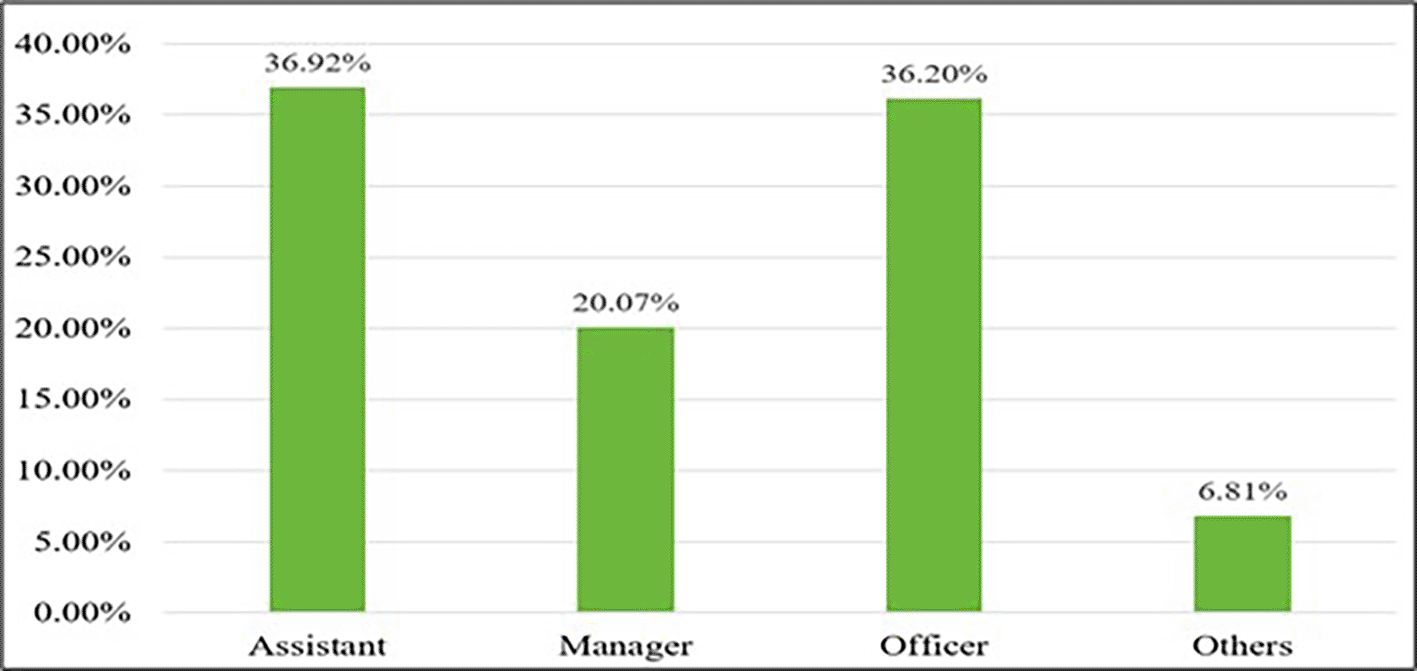
Designation of respondents
The designation refers to the official job title given to employees. An individual’s designation at work can affect their ability to engage in green activities. In this study, the designation was divided into four parts: assistant, manager, officer, and other.
Figure 4 illustrates the distribution of the respondents by designation. The majority were assistants, comprising 36.92% of the sample, followed closely by officers at 36.20%. Managers represented 20.07% of the respondents, whereas other positions accounted for only 6.81%. This distribution indicates that most of the respondents were either assistants or officers.
Distribution of respondents by job designation, showing that assistants (36.92%) and officers (36.20%) make up the majority, followed by managers (20.07%) and other positions (6.81%). The results suggest that survey participants largely represent the operational and mid-level strata of commercial banks.
Source: Survey Data.
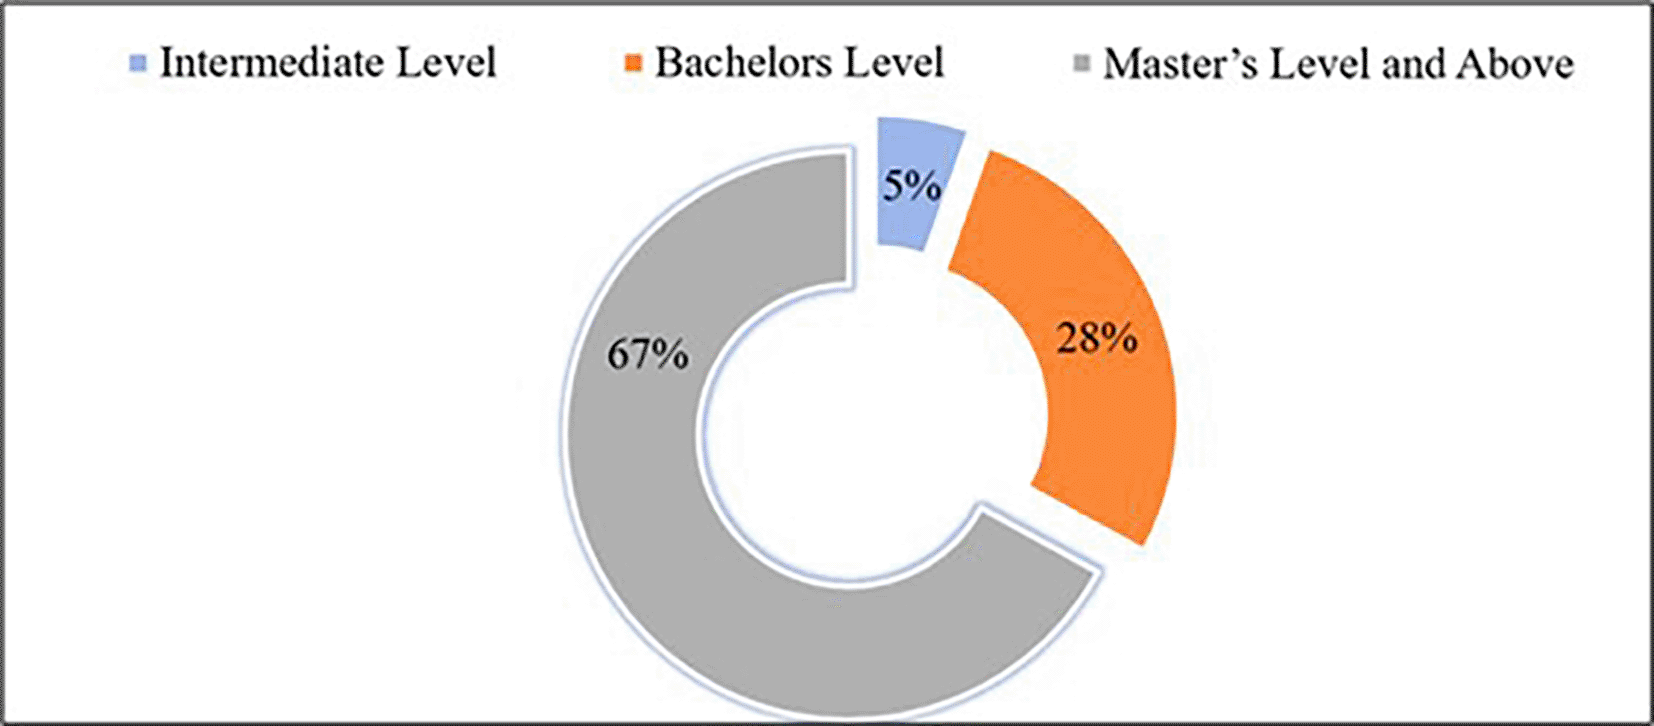
Education qualification
The educational qualifications of employees considerably affect the implementation of GBP within organizations.
Figure 5 depicts the distribution of the respondents according to their level of education. The categories included Intermediate, Bachelor’s, master’s degree, and above. Out of 279 respondents, 67% held a Master’s degree, 28% held a Bachelor’s degree, and 5% had completed only the intermediate level. This indicates that the majority of the respondents possessed advanced degrees. Supporting this, Zhang et al. (2022) found that 5% had a Ph.D., 68.18% of respondents held a Master’s degree, and 27% had a Bachelor’s degree. This suggests that employees with master’s degrees and higher are predominantly engaged in commercial banks in Kathmandu Valley.
Respondents’ educational attainment, revealing that 67% held a Master’s degree, 28% a Bachelor’s degree, and 5% an Intermediate degree. The findings indicate that commercial banks employ a workforce with a high level of formal education, with postgraduate qualifications being dominant.
Source: Survey Data.
Working experience
An individual’s work experience demonstrates industry-specific knowledge, skills, and abilities. It provides an overview of their abilities and knowledge gained from their profession. Figure 6 shows the distribution of respondents by work experience, which is divided into four subgroups: below two years, two to four years, four to six years, and six years and above.

Distribution of respondents by years of work experience. Most respondents (40.14%) had six years or more of experience, followed by 27.24% with four to six years, and about 16% each with below two years and two to four years of experience. This reflects a mix of seasoned professionals and relatively newer entrants in the banking workforce.
Source: Survey Data.
Figure 6 illustrates that 40.14% have experience of six years and above, followed by 27.24% of employees who have experience of four to six years. An almost equal percentage is held by employees with work experience of two to four years and below two years, with 16.49% and 16.13%, respectively. Rehman et al. (2021) conducted similar research and found the following distribution of respondents according to their years of experience in the banking sector: In terms of years of experience, 5% of respondents had fewer than three, 35% had four to six, 40% had seven to nine years, 17.5% had 10 to 14 years, and 2% had 15 years or more of experience. In conclusion, it can be noticed that the majority of employees in the selected commercial banks have six or more experience of 6 years and/or above.
Respondent’s bank
Ten commercial banks were selected for this study. The commercial banks were sampled based on their ranking in terms of profitability (net profit) according to the annual report of 2022, as per the NRB. The banks selected according to that criterion are GBIME, RBB, NABIL, NICA, NIMBL, NMB, NBL, SBL, PCBL, and KBL. Although the study involved a target sample of 250 respondents, 25 respondents were selected from each of 10 participating banks, but an additional 29 samples were received. Therefore, 279 sample sizes were recorded.
General understanding of green banking practices
This section deals with the general understanding of GBP among employees of selected commercial banks in the Kathmandu Valley. The level of understanding of green banking practices can vary significantly among the employees. Figures 7 and 8 provide insights into how well employees in these banks understand and interpret green banking initiatives and their importance.

Respondents’ understanding of how Green Banking Practices influence long-term environmental performance. Nearly half (45.52%) perceived GBP as contributing to sustainable growth, while others viewed it as promoting behavioral change, mitigating climate risks, or even reducing workforce needs due to automation.
Source: Survey Data.
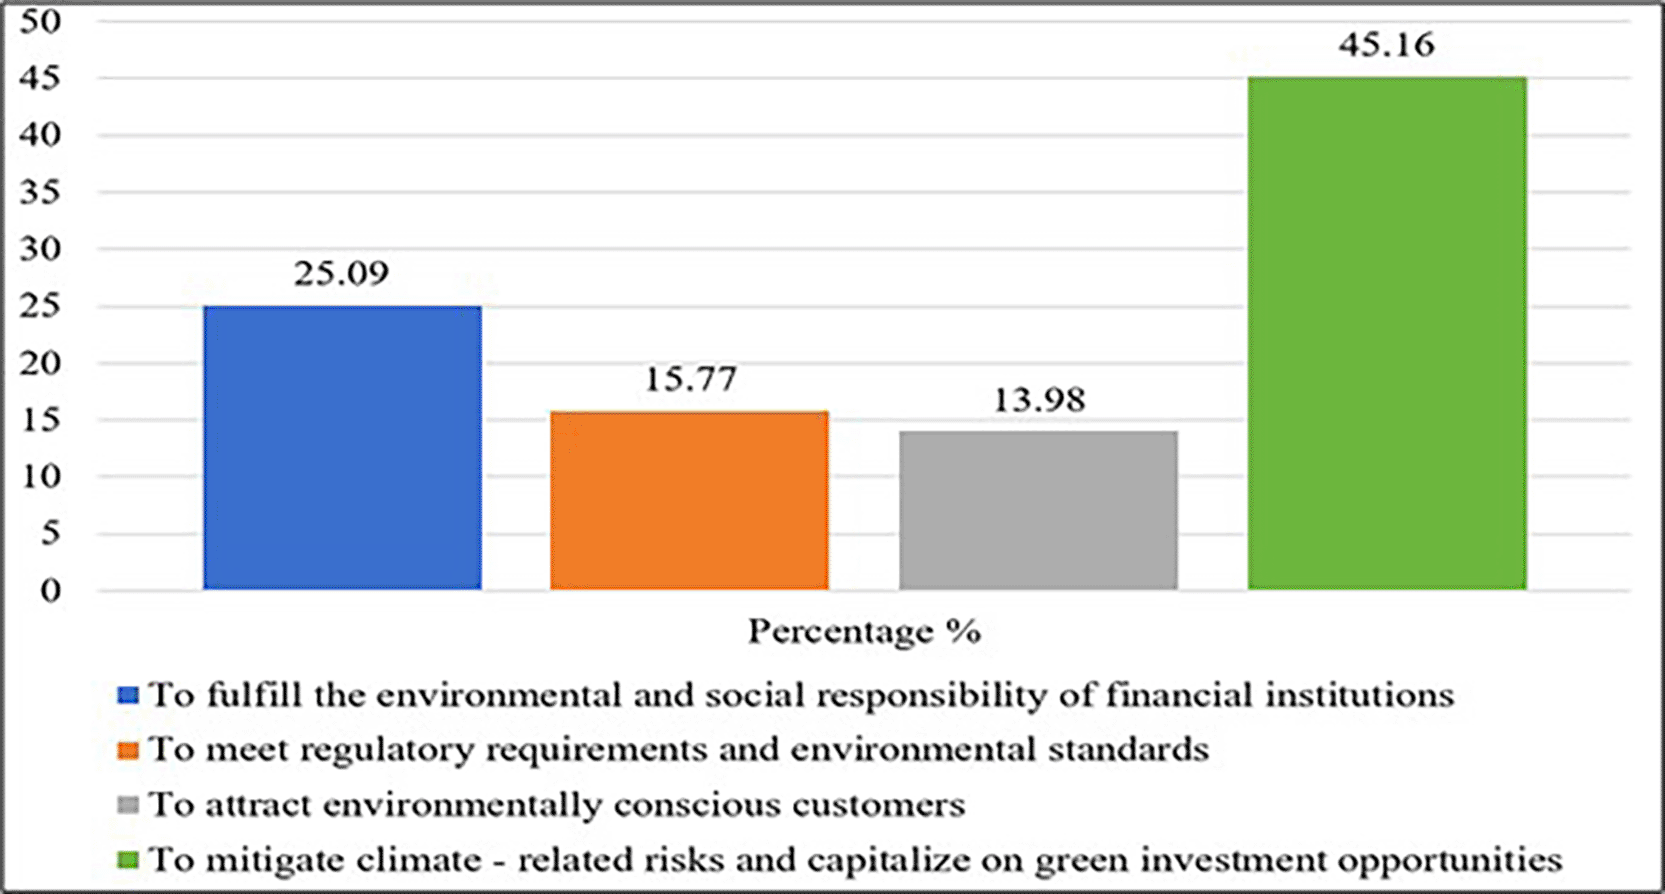
Respondents’ perspectives on why financial institutions should adopt GBP. The largest share (45.16%) emphasized mitigating climate risks and leveraging green investment opportunities, while others cited fulfilling social responsibility (25.09%), meeting regulatory standards (15.77%), and attracting environmentally conscious clients (13.98%).
Source: Survey Data.
Impact of green banking practices on the long-term environmental performance
In this section, the general understanding of the respondents regarding GBP and their influence on long-term EP is measured.
From Figure 7, it is obvious that 45.52% of the respondents have the understanding that GBP leads to sustainable growth. 27.96% of the respondents believed that GBP brings positive behavioral changes among people to protect the environment. Similarly, 14.7% believed that GBP was about mitigating climate-related risks. Lastly, 11.83% have the understanding that GBP will contribute to workforce reduction due to the automation of work.
Thus, it can be concluded that the majority of employees of commercial banks have recognized green banking’s role in fostering sustainable growth and positive behavioral shifts toward environmental protection. Additionally, respondents recognizing green banking’s potential to mitigate climate-related risks showcase an emerging awareness of the financial sector’s contribution to addressing environmental challenges.
Importance of financial institutions to adopt green banking practices
This section assesses respondents’ overall perceptions of the importance of financial firms adopting GBP.
The results are shown in Figure 8. It was found that almost half of the total respondents (45.16%) recognized the importance of financial institutions in adopting green banking practices to mitigate climate-related risks and capitalize on green investment opportunities. Followed by over a quarter of participants (25.09%) who agreed that the reason for accepting green banking initiatives was to fulfill the environmental and social responsibility of financial institutions. Furthermore, 15.77% and 13.98% think GBP is important to meet regulatory requirements and environmental standards, and to attract environmentally conscious customers, respectively.
The survey results demonstrated a moderate understanding among respondents regarding the importance of GBP for a variety of reasons. This understanding is highly driven by the desire to mitigate climate-related risks, capitalize on green investment opportunities, and fulfill the environmental and social responsibilities of banks.
This signifies a significant shift in the modern banking ethos. This indicates that these institutions are increasingly being viewed not just as economic entities but as stakeholders accountable for their environmental impact and societal contributions. The respondents’ identification of green banking as a strategic avenue for capitalizing on green investment opportunities underscores the alignment between environmental sustainability and financial profitability.
4.1.2 Research variables
Green Banking Practices (GBP)
Green banking practices (GBP), commonly referred to as green banking, involve environmentally conscious initiatives undertaken by banks to reduce their carbon footprints in daily operations. These practices also aim to minimize external carbon emissions (Sudhalakshmi & Chinnadorai, 2014). Table 3 illustrates the frequency and percentage of the total responses to statements related to GBP.
From Table 3 mentioned above, it can be seen that most of the people, i.e., 38.4% agree that their bank offers staff training on energy-saving equipment, environmental protection, and so forth. Following this, 41% of the respondents agreed that their bank organized seminars and meetings to promote eco-friendly practices. Likewise, 51.6% of respondents agreed that in the workplace, given the availability of alternatives, they prioritize environmentally friendly tasks whenever feasible, providing more advantages to their bank.
Similarly, almost half of the respondents (50.2%) show agreement that their bank attempted to reduce paper usage as much as possible. Additionally, 50.2% of respondents show agreement that their bank adopted energy-saving equipment such as eco-friendly ATMs, LED lighting, and eco-friendly printers. Furthermore, 36.9% of the respondents agreed that their bank used electronic waste management practices like recycling unused computers, monitors, old phones, etc. Likewise, 45.5% of respondents show agreement that their bank made investments in internet and mobile banking services. In addition to that, 45.2% of respondents agreed that their bank introduced innovative green products and services like green savings deposit accounts, green credit cards, and green OTP systems. Additionally, 47.3% of the respondents agreed that their banks had implemented green policies and pollution control plans. Finally, 41.2% agreed that their bank had green partnerships and agreements among suppliers and investors.
Most banks focus their investments on Internet and mobile banking services, with limited diversification in the equity market (Karki, 2018). Their priorities include adopting environmentally friendly alternatives and introducing innovative green products as part of their Green Banking Practices (GBP) to enhance environmental performance. Overall, the data show that the majority of employees of commercial banks have noticed the presence of GBP and perceive the banks as being moderately committed to adopting environmentally friendly initiatives. However, it is important to note that some responses were moderate or low in training and waste management, indicating a lack of priority in the GBP.
Green financing (GF)
Green finance (GF) focuses on renewable and alternative energy, waste management, green industry development, energy efficiency, recycling programs, and other green projects. The goal of GF is to promote organizational sustainability by incorporating environmental concerns into lending and investment decision-making, post-monitoring processes, and risk management, ultimately delivering environmental benefits (Siddik & Zheng, 2021).
From Table 4, it is evident that slightly more than half (51.61%) of the respondents agreed that their bank invested in renewable energy sectors like solar energy, hydropower, electric vehicles, and biomass energy. Likewise, 53.1% of the respondents agreed that banks offer financial products, such as loans, to companies that are seeking to make their operations more energy efficient.
Additionally, 43% of the respondents agreed that their bank invested (direct lending or own investment) in waste management projects. Moreover, 49.5% of respondents show agreement with the statement that their bank evaluates environmental risk for various projects and financing activities. On a similar note, 42.7% of the respondents agreed that their bank evaluated the environmental records of the clients while lending. Finally, 44.1% of the respondents agreed that their bank provided loans to eco-friendly projects with low interest rates and special grants (Bhandari et al., 2021).
Overall, the survey findings reveal that the respondents mostly expressed a moderate level of response when it came to GF in Commercial Banks. It can be noticed that banks are comparatively more actively adopting GF by investing in renewable energy, supporting energy-efficient projects, and assessing the client’s environmental records before lending. However, as per the respondents, it can be noticed that the banks have not been adopting GF to their full potential.
Banks’ Environmental Performance (BEP)
In this study, environmental performance denotes the effect of banking activities on the natural environment, focusing on reducing negative effects such as carbon emissions and waste, while enhancing positive outcomes through green banking practices for long-term conservation and business productivity (Shaumya & Arulrajah, 2017).
Table 5 reveals that the majority of respondents (61.3%) agree that their bank’s green banking practices enhance compliance with environmental standards. Additionally, 57.7% believed these practices help reduce energy consumption, while 48.8% agreed the bank promotes eco-friendly technologies. Half of the respondents (50.2%) recognized efforts to lower carbon footprints, and 53.7% agreed to reduce paper and material usage. Overall, 50.9% feel the bank evaluates the ecological impact of its activities. These findings suggest that respondents view green banking practices positively, particularly regarding environmental compliance and sustainability.
4.1.3 Descriptive analysis of research variables
Table 6 summarizes the respondents’ views on various Green Banking Practices (GBP), rated from 5 (strongly agree) to 1 (strongly disagree). The strongest agreement was with the assertion that banks focus on GBP through investments in online and mobile banking, with a mean value of 3.95, thus supporting Karki et al. (2021). Respondents also agreed that their banks offer innovative green products such as green deposit accounts and credit cards (mean 3.89). However, the lowest agreement (mean 3.59) was for the adoption of energy-saving equipment such as eco-friendly ATMs. Overall, mean values above 3 indicate general agreement with GBP initiatives, with a low standard deviation, reflecting consistent responses.
Table 7 shows respondents’ views on Green Finance (GF) practices. The majority agreed that their banks engage in GF through investments in renewable energy sectors like solar, hydropower, and electric vehicles (mean 3.63). They also agreed that banks assess environmental risks for projects (mean 3.62). However, there was a lower agreement (mean 3.42) on banks’ involvement in waste management investments. The neutral response to low-interest loans for eco-friendly projects (mean 3.47) reflects mixed opinions. Overall, the mean values above 3 indicate general agreement with GF practices, with low standard deviations, signifying consistent responses.
Table 8 summarizes respondents’ views on banks’ environmental performance (BEP). The highest agreement was with the statement that green banking practices enhance bank compliance with environmental standards (mean 3.86). The lowest agreement was regarding banks’ efforts to reduce their carbon footprint (mean 3.63). Overall, with mean values above three, most respondents agreed that their banks contributed positively to environmental performance. The standard deviations, ranging from 0.722 to 0.816, indicate steady responses with minimal variation from the mean.
In Table 9, it is evident that the overall mean value of green banking practices is 3.74, which surpasses the neutral point slightly. This suggests that among all ten statements related to GBP, respondents tend to agree that their respective banks have incorporated GBP into their operational framework. Furthermore, GF attains the lowest mean value of 3.54, illustrating that respondents opine that their respective banks do not significantly integrate GF through investment and lending practices. In contrast, BEP commands the highest mean value of 3.76, illustrating that the respondents show maximum agreement, with above-neutral mean value, that their respective banks contribute to environmental protection.
| Observed Variables | Minimum | Maximum | Mean | Std. Deviation |
|---|---|---|---|---|
| GBP | 1.00 | 4.90 | 3.7423 | .66851 |
| GF | 1.00 | 5.00 | 3.5400 | .66358 |
| BEP | 1.00 | 5.00 | 3.7616 | .57112 |
Inferential analysis
Inferential analysis seeks to interpret relationships between variables, evaluate differences, and make forecasts based on sample data using various statistical techniques (Kaur et al., 2018). It allows for generalizations about a population from sample data, supporting decision-making based on these insights (Simpson, 2015). This analysis includes the evaluation of the structural model, measurement model, and path analysis.
4.1.4 Measurement model results
The measurement model estimates the validity and reliability of constructs by examining internal consistency, reliability, convergent validity, content validity, and discriminant validity (Hair et al., 2014; Henseler et al., 2015). It is crucial to confirm a construct’s reliability and validity (Henseler et al., 2015). Cronbach’s alpha was used to assess internal consistency, while composite reliability should exceed 0.7, indicating sufficient reliability (Shrestha, 2021).
Table 10 shows the validity and reliability of the instruments employed in this study. Composite reliability (CR), average variance extracted (AVE), and outer factor loading were calculated. Factor loadings greater than 0.7 indicate adequate reliability (Hair et al., 2017). All AVEs exceeded 0.50, confirming strong item-construct relationships (Purwanto & Sudargini, 2021). The CR estimates were above 0.7, reflecting a high internal consistency (Shrestha, 2021). Additionally, the Cronbach’s alpha coefficients varied from 0.846 to 0.92, further demonstrating strong reliability and internal consistency across the variables.
Discriminant validity: Fornell and Larcker’s criterion
The degree to which a latent concept differs from other model constructs is determined by discriminant validity (Sujati et al., 2020). This confirms that the constructs represent separate entities, rather than overlapping concepts. This validity was examined using three criteria: Heterotrait-Monotrait Ratio (HTMT), Fornell-Larcker, and cross loadings. For any construct to meet the Fornell-Larcker criterion, which is frequently applied in PLS-SEM, the square root of its AVE must be greater than the correlations with other constructs (Almansoori et al., 2021). Table 11 shows the Fornell–Larcker criterion results.
| BEP | GBP | GF | |
|---|---|---|---|
| BEP | 0.752 | ||
| GBP | 0.403 | 0.762 | |
| GF | 0.441 | 0.369 | 0.789 |
Table 11 demonstrates that the square root of the AVE for each construct exceeded its correlations with other constructs, thereby satisfying the Fornell-Larcker criterion for discriminant validity. This confirms that the constructs measuring the impact of GBP on banks’ EP are unique and are not confounded by other variables.
Discriminant validity: Heterotrait-Monotrait Ratio (HTMT)
The HTMT ratio, another method for evaluating discriminant validity, assesses the distinctiveness of constructs. A common threshold is 0.85 (Roemer et al., 2021).
Table 12 reveals that all HTMT values are well below the threshold (0.85), confirming that the constructs related to GBP and banks’ EP are distinct and understood by the respondents.
| BEP | GBP | GF | |
|---|---|---|---|
| BEP | |||
| GBP | 0.446 | ||
| GF | 0.501 | 0.405 |
Discriminant validity-Cross loading
Cross-loadings assess whether an item loads more heavily on its construct than others do. For valid discriminant results, an item should show higher loadings on its parental construct. Significant cross-loading (a difference of less than 0.10) suggests potential issues with discriminant validity (Ronkko & Cho, 2022), indicating that the item may not clearly distinguish between constructs.
Table 13 displays cross-loadings for three latent variables: GBP, GF, and Banks’ EP. As mentioned in Table 13, each item shows higher loadings on its parent construct than on others, indicating effective measurement of distinct constructs.
Structural model analysis
The structural model assesses the overall model fit and tests the research hypotheses (Alzoubi et al., 2020). It examines the complex relationships between observed and latent variables and evaluates measurement properties and structural interactions (Hair et al., 2021). In PLS-SEM, checking for multicollinearity using the Variance Inflation Factor (VIF) is essential because high multicollinearity can obscure the distinct contributions of independent variables.
VIF (Variance Inflation Factor) value
The VIF assesses multicollinearity among the study variables. When multicollinearity is high, it signifies a strong correlation between variables, which complicates the process of distinguishing between their individual effects on the latent constructs.
For this study, a VIF threshold of 3.3 is used to identify problematic multicollinearity. Values below 3.3 indicate no significant bias from multicollinearity. Table 14 shows that all the variables assessing the effect of GBP on banks’ EP fall below this threshold, suggesting no multicollinearity issues.
Path analysis
Path analysis, as shown in Figure 9, was used to evaluate the structural model by analyzing the direct and indirect relationships between variables (Fan et al., 2016). This technique visualizes hypothesized cause-and-effect relationships with arrows connecting variables, helping identify both direct and indirect effects. Figure 9 shows the path analysis of this study.
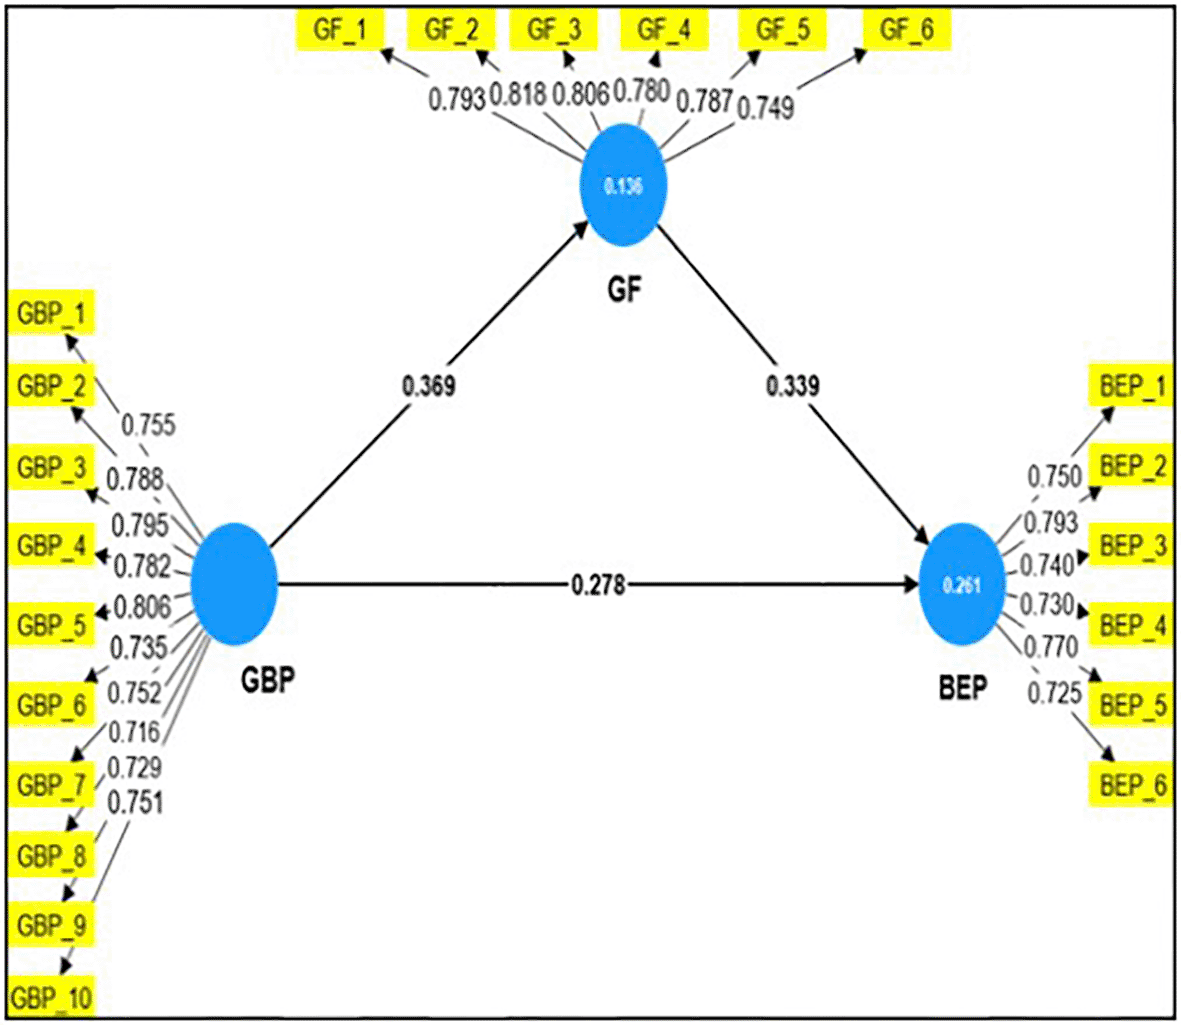
Structural model results from Partial Least Squares Structural Equation Modeling (PLS-SEM), showing the direct and indirect effects among GBP, GF, and BEP. Path coefficients, R2 values, and factor loadings demonstrate significant positive relationships, with Green Finance partially mediating the link between GBP and BEP.
Source: Survey Data.
To examine the structural relationships between the constructs, three constructs were used: Green Banking Practices (GBP) with 10 items, bank environmental performance (BEP) with 6 items, and Green Financing (GF) with 6 items, totalling 22 items from 279 responses. Figure 9 shows the path coefficients, R2 values, and factor loadings.
The path coefficients were 0.278, 0.369, and 0.339, indicating moderate positive correlations among GBP, GF, and BEP, with GBP and GF showing the strongest relationship. The R2 values show that GBP explains 26.1% and GF explains 13.6% of the variance in BEP, demonstrating satisfactory model performance. All factor loadings exceeded 0.7, meeting the required threshold.
A path is statistically significant if its confidence interval does not include zero (Hair et al., 2021). From Table 15, the first hypothesis (H1) is accepted, with a beta coefficient of 0.278 and a confidence interval ranging from 0.151 to 0.383, indicating that GBP significantly impacts banks’ EP. The second hypothesis (H2) is also supported by a beta coefficient of 0.369 and a confidence interval from 0.247 to 0.473, confirming that GBP significantly affects Green Financing (GF). Additionally, the third hypothesis (H3) is supported by a beta coefficient of 0.339 and a confidence interval between 0.219 and 0.44, demonstrating that GF significantly affects BEP. Overall, all hypotheses are supported, as their confidence intervals do not include zero, indicating that all relationships are positive and statistically significant.
Mediation analysis
Mackinnon et al. (2007) stated that mediation analysis seeks to understand the impact of a third variable on the relationship between two other variables. It assesses whether a mediator variable partially or fully explains the relationship between observed variables (Nitzl et al., 2016).
To examine mediation analysis, both direct and indirect effects must be considered. Tables 15 and 16 show that both the direct impact of GBP on banks’ EP and the indirect effect (GBP → GF → BEP) are significant because their confidence intervals do not include zero. This finding indicates that Green Financing (GF) partially mediates the relationship between GBP and BEP.
This study assesses the effect of Green Banking Practices (GBP) on bank environmental performance (BEP) in Nepal, supported by four hypotheses. The findings confirm that GBP significantly enhances BEP, with a higher implementation of GBP leading to better environmental performance, which is consistent with Zhang et al. (2022). The study also validates that GBP positively influences Green Finance (GF), which in turn positively affects BEP, aligning with research by Dai et al. (2022) and Chen et al. (2022). Notably, GF partially mediated the relationship between GBP and BEP, amplifying the impact of GBP, as described by Zhang et al. (2022). This study incorporates Slack Resource Theory and Socially Responsible Investment (SRI) theory to contextualize these findings, showing that banks with surplus resources and a focus on both financial and environmental benefits can significantly enhance their environmental performance. Descriptive statistics reveal growing awareness among bank employees regarding the role of GBP in fostering sustainable growth and mitigating climate-related risks. Recommendations include enhancing staff training, investing in green technology, prioritizing waste management, expanding green product offerings, and increasing green financing services. Regulatory bodies should establish clear standards and incentives to support green banking. Future research should broaden the geographic scope, include qualitative methods, and consider additional variables to deepen our understanding of GBP’s influence of GBP on environmental performance. This study emphasizes the potential for further advancement in GBP and GF within Nepalese commercial banks, contributing to sustainable development and environmental preservation.
The authors declare no relevant financial or nonfinancial conflicting interests among the authors.
The study follows standard research ethics.
The Ethics Committee of Tribhuvan University, Faculty of Management, Nepal Commerce Campus granted ethical approval for this study (Ref. No: 469/081-82) before we began data collection. The collected data aims to protect the respondents’ confidentiality.
| Views | Downloads | |
|---|---|---|
| F1000Research | - | - |
|
PubMed Central
Data from PMC are received and updated monthly.
|
- | - |
Provide sufficient details of any financial or non-financial competing interests to enable users to assess whether your comments might lead a reasonable person to question your impartiality. Consider the following examples, but note that this is not an exhaustive list:
Sign up for content alerts and receive a weekly or monthly email with all newly published articles
Already registered? Sign in
The email address should be the one you originally registered with F1000.
You registered with F1000 via Google, so we cannot reset your password.
To sign in, please click here.
If you still need help with your Google account password, please click here.
You registered with F1000 via Facebook, so we cannot reset your password.
To sign in, please click here.
If you still need help with your Facebook account password, please click here.
If your email address is registered with us, we will email you instructions to reset your password.
If you think you should have received this email but it has not arrived, please check your spam filters and/or contact for further assistance.
Comments on this article Comments (0)