Keywords
Health Inequalities, Health Disparities, Maternal and Child Health, Indonesia
Health Inequalities, Health Disparities, Maternal and Child Health, Indonesia
Health equity is a key component of fundamental healthcare and is embedded in the health policies of most countries.1 However, despite global governmental commitments to pro-poor health policies and programs, disparities in health status and access to basic healthcare services remain significant across Southeast Asia.2–4 Research indicates that healthcare utilization in the region is influenced not primarily by medical need but by factors such as socioeconomic status, geographical location, education, and financial capacity.3 This pattern aligns with the ‘inverse care law,’ which suggests that those with lower healthcare needs—typically the wealthy—have more access to high-quality services, whereas the poor and disadvantaged, who require healthcare the most, face significant barriers.5 Similarly, in Indonesia, lower-income populations experience a higher burden of illness while having more limited access to government financed health services compared to wealthier groups6 Household welfare status has been consistently identified as a key determinant of this health inequality in the country.7
These inequalities and disparities denote variations in healthcare access or use that are avoidable, unjust, and unfair8,9; however, they each refer to differences in access to and utilization of healthcare services among various groups. Healthcare equity, on the other hand, ensures that all individuals receive a minimal level of care determined by need rather than factors such as financial status, geographic location, or ability to pay.10 A structural theory of health inequalities posits that disparities in health outcomes are largely driven by differences in socioeconomic factors such as resources, income, wealth, power, and the environment.11,12 Evidence supports this perspective, showing that health inequalities tend to diminish when structural inequalities are reduced.13,14 Additionally, community health improves when more resources are allocated, and most compellingly, individuals with the greatest resources consistently experience the best health outcomes, regardless of their behaviors.15 Even in cases where a medical problem is clearly based on genetic abnormalities, there are substantial gaps in mortality across social and economic classes.16
To combat health issues, especially in Maternal and Child Health (MCH), various initiatives were launched. A prominent measure was the issuance of National Strategy for Accelerating Stunting Prevention (Stranas Stunting), expanded from 100 districts in 2018 to 514 by 2022.26 Furthermore, the issuance of Presidential Regulation 72/2021 established Stunting Reduction Acceleration Team which intensifies Family Centered approach to ensure that mostly targeted intervention areas can effectively reach vulnerable target group.27 These initiatives aimed to improve health services and reduce the socio-economic inequities that hinder low-income populations from accessing nutrition, sanitation and quality health care with a view to improving MCH outcomes.
Monitoring health disparities and utilization of health services is therefore important to inform intervention programs that allocate scarce public resources to better meet the needs of disadvantaged populations. The findings in this study could be a valuable resource for future studies, guiding other researchers while planning health equity studies. Such knowledge may guide clinicians and lawmakers to implement specific programs/legislations that promote equitable access to health care for vulnerable populations. To be more attentive to regional needs, future policy would likely benefit Indonesian communities by enabling better maternal and child health (MCH) outcomes.17 Evidence on whether these gains have been equitably distributed across socioeconomic groups in Indonesia remains limited, and the trends in health inequalities over time have not been thoroughly examined. Research on health disparities in Indonesia is limited, with most studies focusing on individual health indicators rather than providing a comprehensive analysis of inequality trends. Previous studies have primarily explored disparities in maternal and child healthcare and dental care.18–22 Additionally, data from the Basic Health Survey (Riskesdas) have been used to analyze factors influencing child nutrition status in Indonesia.23,24 Analyzing such patterns over time is needed to quantify disparities over time between various social groups and geographic areas and to determine if national policies are effectively reaching disadvantaged populations.25 The 10-year inequality trend highlighted the intersection of public health and sustainable development in addressing socio-economic challenges, particularly intergenerational poverty.
This study addresses this gap by estimating the magnitude and trends in disparities in MCH and healthcare indicators using data from three rounds of national population-based surveys carried out in 2013, 2018 and 2023. It also looks at variations between those living in urban and rural areas as well as differences by socioeconomic group which provides insight into the development of health equity in Indonesia by exploring various MCH variables and patterns of healthcare utilization over the last decade.
We used the data from Indonesian Health Survey (SKI) 2023 and basic health survey (Riskesdas) in 2013 as well as in 2018 — those regularly conducted by Ministry of the Health through the agency of health development policy. All three surveys are comparable across years due to the common methods of data collection, measurement, analysis and indicator evaluation used for each. At each stage of the two-stage stratified cluster sampling procedure used in the survey, two sampling frames were employed. In the 2013 Riskesdas, data were collected from 294,959 households and 1,027,763 individuals across 11,986 census blocks in 497 districts and cities within 33 provinces.28 The 2018 Riskesdas expanded its scope, covering all 34 provinces and 514 districts and cities, with a total of 282,654 households and 1,017,290 individuals sampled from 29,821 census blocks.29 For SKI 2023, data were successfully recorded from 315,646 general households and 284,178 households with children under-five. At the individual level, interviews were conducted with 1,191,692 individuals, while blood sampling and dental and oral examinations were performed on 37,443 participants. This study encompassed 38 provinces and 514 districts and cities across Indonesia.30 The inclusion criteria consisted of all women aged 15–49 who were eligible for interviews. Testing on anemia was done on eligible pregnant women who provided informed consent. Rapid Diagnostic Test (RDT) kits were used to test for malaria on children between the ages of 6 and 59 months. Height and weight measurements were recorded for children aged 0–59 months and women aged 15–49 years.
The data encompasses various aspects, including and demographic and socioeconomic traits of women and children, household conditions, MCH status indicators, and healthcare service utilization, collected through structured questionnaires. Additionally, physical assessments such as measurements of women’s and children’s height and weight, as well as anemia and malaria testing, were conducted. The other category encompasses healthcare service utilization variables, including antenatal care (ANC), skilled birth attendance (SBA), delivery in healthcare facilities, complete postpartum care visits, complete vaccination coverage, medical care for childhood diarrhea, and the prevalence of contraceptive, as well as the use of Long-Lasting Insecticide Nets (LLINs) for children.
The study analyzed indicators in two main categories: MCH outcome indicators, includes under-five mortality rate (U5MR), infant mortality rate, stunting, underweight children, prevalence of postpartum complication among women, prevalence of ARIs, and diarrhea in children under-five. Additionally, maternal health was assessed using low Body Mass Index (BMI) in women. Children were classified as stunted or underweight based on WHO reference standards. A height-for-age Z-score that was less than −2 standard deviations (SD) from the median was considered stunting, while underweight was determined using a weight-for-age Z-score below −2 SD.31,32 Measurements were taken using a digital weighing scale (accuracy: 0.1 kg) and a height/length measuring instrument (accuracy: 1 mm). Children’s nutritional status was evaluated using the 2006 WHO growth criteria. Women aged 15 to 49 years had their height and weight recorded. BMI was calculated as weight (kg) divided by height squared (m2). A BMI below 18.5 kg/m2 was used to determine whether this group is thin or suffering from acute malnutrition.33 Diagnosis of childhood diarrhea by health workers within the previous 1 month. Malaria testing was conducted only on children between the ages of 6 and 59 months using a RDT and thick blood smear examination, with diagnoses confirmed by a doctor within the previous 12 months. Testing was performed on children who had experienced fever within two days prior to data collection for the SKI 2023.
Indicators were harmonized across survey years to ensure conceptual and operational comparability, despite minor differences in wording and definitions. Differences in wording and indicator structure across surveys were aligned based on core concepts and consistently available indicators.30,34,35 Variable definitions were also adjusted to reflect the regulations in force during each survey period, such as the completeness of ANC visits defined as ≥4 visits in Riskesdas 2013 and 2018 and ≥ 6 visits in SKI 2023.36,37 Despite variations in the categorization of variables among surveys, this approach allows for accurate trend analysis.
Quintile ratios and concentration indices were used to measure the dependent variable, which was inequality levels. The quintile ratio assesses health outcomes and access to health services across economic classes by measuring the disparity in health outcomes for the richest and the poorest.38 The 2013 Riskesdas and 2023 SKI considered household asset ownership data for this purpose. Household economy status was assessed based on ownership of durable assets such as houses, vehicles, motorcycles, bicycles, refrigerators, and others. Using Principal Component Analysis (PCA), several durable asset indicators were combined to create a single index that classified households into five wealth quintiles (from poorest to richest).30,34 The data indicate that the publicly available dataset for the 2018 Riskesdas did not include a wealth index at the individual level, unlike the 2013 and 2023 datasets. The concentration index, in contrast, provides a relative measure of health inequity and captures the level of socioeconomic stratification by health indicators across the five wealth quintiles.38 This study focused on the absolute percentage difference in the average population between the richest and poorest, and also between rural and urban populations. For the purpose of understanding the patterns of inequalities in detail, the study also focused on measuring the concentration index and the quintile ratio of the variable to identify the positive or negative changes in the variable over time.
The concentration index and quintile ratio both measure inequality; however, these techniques serve distinct, yet complementing purposes. For example, analyzing health status and health care utilization between the wealthiest quintile and the poorest quintile employs the quintile ratio. This measure describes the difference between the richest and the poorest. However, it, fails to describe the health inequalities that may exist among the three middle quintiles and takes the other three middle quintiles into consideration. This creates a limited perspective on the inequality of the entire population.39 By contrast, the concentration index provides a better measure of the magnitude of socioeconomic inequality across the five quintiles. This index reflects the extent to which a health indicator is concentrated among the better or worse off.38,39 A lower socioeconomic status health is lagging behind the other groups and is considered an unbalanced advantage while higher economic status health is better off. The index is between −1 & +1. The higher the inequality, the wider the gap. A concentration index of 0 is a sign of no socioeconomic inequality. The concentration index (C) of grouped data is given an equation as follows:
Ethical review board approval was obtained from the Research and Community Engagement Ethical Committee, Faculty of Public Health, Universitas Indonesia, with reference number 562/UN2.F10.D11/PPM.00.02/2025. Written informed consent was obtained from all participants prior to their participation in the study.
Table 1 presented the total number of respondents included in this analysis. A total of 44,174 children between ages 12 to 23 months, 242,768 children under-five years old, 393,907 women, and 464,253 men aged 15 to 49 were interviewed. Additionally, data from 104,714 live births that occurred in the five years preceding the survey were considered, based on paired data from mothers and their children.
| Participants | Gender | Residence | Wealth quintile* | ||||||
|---|---|---|---|---|---|---|---|---|---|
| Male | Female | Urban | Rural | Lowest | 2nd | Middle | 4th | Highest | |
| Children 12–23 months | 22690 | 21484 | 19730 | 24444 | 4265 | 5118 | 5506 | 5847 | 5273 |
| Children under-five years | 123629 | 119139 | 115988 | 126780 | 25676 | 29169 | 30231 | 32613 | 31639 |
| Women aged 15–49 years of age | 393907 | 180010 | 213897 | 23596 | 25509 | 26388 | 27460 | 26366 | |
| Men aged 15–49 years | 464253 | 245101 | 292042 | 50491 | 59061 | 60120 | 64454 | 61601 | |
| Live births in the five years preceding the survey | 44733 | 59981 | 4733 | 5333 | 5431 | 5446 | 5168 | ||
Table 2 summarizes rural-urban ratios, wealth quintile ratios, and concentration indices for MCH outcomes, revealing overall improvement alongside persistent socioeconomic gradients. In general, nearly all measured indicators showed a marked improvement over the ten-year period. However, one notable exception is the increase in the proportion of mothers experiencing postpartum complications, which rose from 6.2% to 12% in rural areas and from 5.4% to 19.7% in urban areas. By contrast, other indicators seem to follow a similar pattern of decrease in proportion between 2013 and 2023. The infant mortality rate in the lowest quintile decreased by 5 deaths per 1,000 live births, compared with a reduction of 1 deaths per 1,000 live births in the richest quintile. Similarly, stunting declined by 14.5 percentage points in the lowest quintile, whereas the richest quintile experienced a 11.6 percentage point reduction. However, both the lowest and richest quintile groups showed an increase in the proportion of mothers with postpartum complications. In the richest quintile, the percentage of mothers with postpartum complications rose sharply from 5.3% in 2013 to 19.3% in 2023. There were inequalities that favored the rich over the poor, as seen by the quintile ratios of almost all variables being more than one. Additionally, for the majority of indices, the quintile ratios increased with time, indicating a widening wealth disparity. The greatest ratios, and therefore the largest disparities, were observed in underweight among children, the prevalence of malaria among children under-five, and mothers with low BMI. The underweight prevalence among children in the lowest quintile, for instance, was 2.20 times greater in 2023 and 2.07 times higher in 2013 compared to the wealthiest. Additionally, indicators for the prevalence of ARI and diarrhea in children under-five showed a similar pattern. The largest increases in ratios were observed for stunting among children under-five and mothers with low BMI, which stayed fairly high, rising from 1.74 to 2.14 and from 2.58 to 3.32, respectively. Almost all the poor were more likely to suffer from sickness, as seen by the negative concentration indices for all health outcome variables. Concentration indices that increased were those for the prevalence of ARI, the prevalence of malaria, and low maternal BMI, whereas concentration indices that decreased were those for the infant mortality rate, under-five mortality rate, prevalence of stunting, prevalence of underweight, maternal postpartum complications, and prevalence of diarrhea among children under-five. The childhood malaria concentration index became more negative, changing from −0.49 in 2013 to −0.57 in 2023. The upward trend in concentration indices indicates that health disparities are expanding, further marginalizing individuals from lower socioeconomic backgrounds.
Table 3 summarizes the rural/urban ratios and quintile ratios and concentration index of various health service indicators. Evidence shows a general increase in the utilization of health services across all wealth quintiles. However, there were exceptions to this positive trend. Specifically, the utilization of services such as full immunization rates among children aged 12–23 months and antenatal visits to trained personnel saw a decline over the ten-year period. Conversely, the rate of full postpartum visits showed stagnation. Similar to health status metrics, health service utilization metrics also indicated that the poorest group made greater progress more than the richest over the ten-year period. For example, the percentage of births assisted by skilled birth attendants in the lowest quintile increased by 19.8 percentage points, compared to an increase of only 2.3 percentage points in the richest quintile. Furthermore, similar patterns were observed in several indicators from 2013 to 2023. Conversely, concentration indices that decreased included those for births assisted by skilled birth attendants, births delivered in health facilities, children under-five years with diarrhea who received medical treatment, contraceptive prevalence rate, and complete postpartum visits. The concentration index for LLINs use in children under-five years became more positive, changing from −0.12 in 2013 to 0.11 in 2023. These rising concentration indices suggested that inequality gaps widened, to the disadvantage of individuals with low socioeconomic status.
Figure 1 plotted concentration curves for the change in each health indicator between 2013 and 2023, with the 45° dashed line representing an equal distribution of improvements across wealth quintiles. Overall, most indicators showed curves that lay below the line of equality for the lower quintiles, indicating that much of the improvement in health status was captured by the better-off. This pattern was especially marked for under-five mortality (U5MR), infant mortality, prevalence of underweight, prevalence of malaria, and low maternal BMI. Conversely, the curves for stunting and, to a lesser extent, prevalance of ARI and maternal postpartum complications lay closer to or slightly above the equality line, suggesting relatively more pro-poor or more evenly shared improvements for these outcomes.
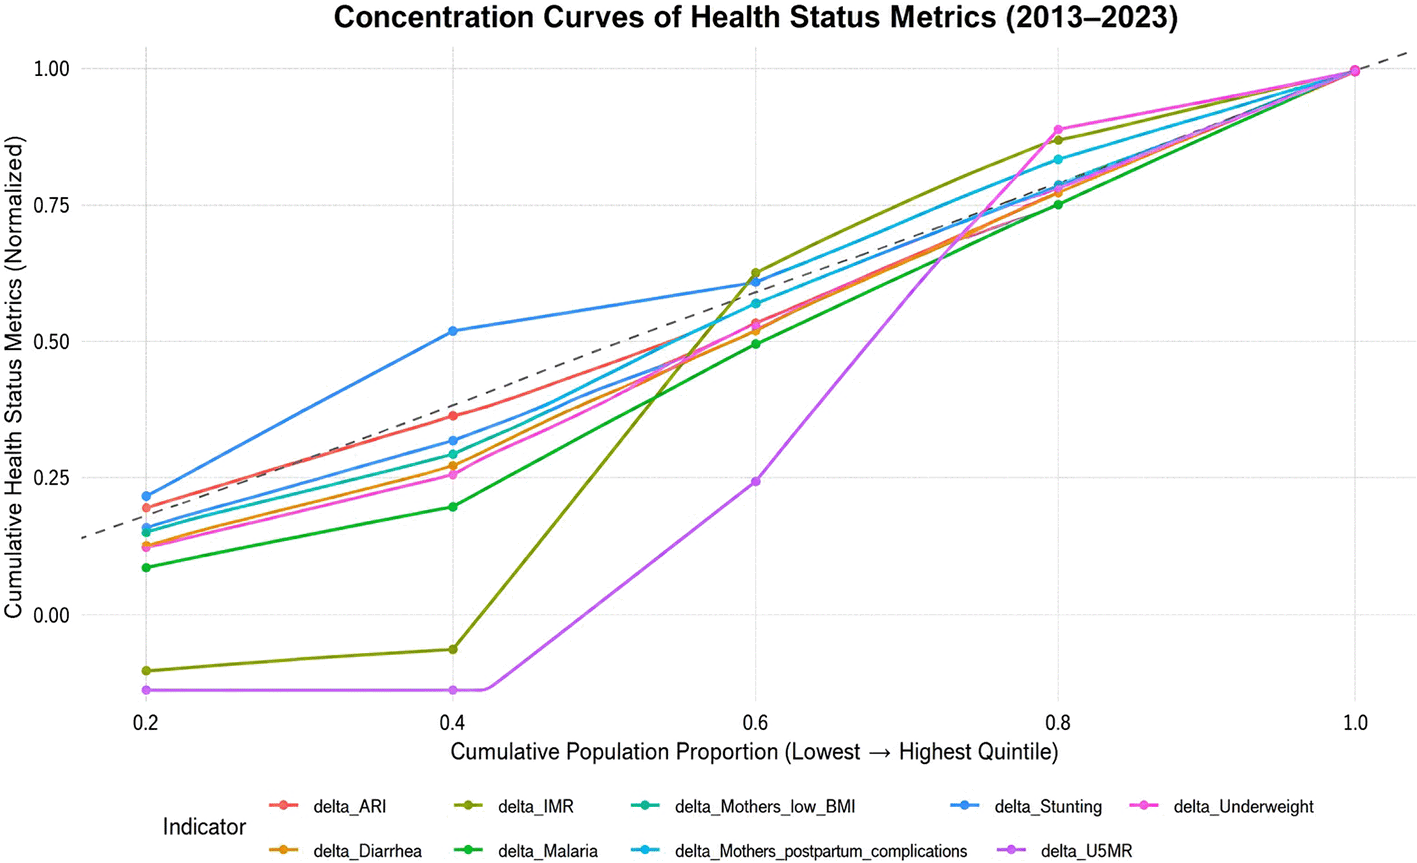
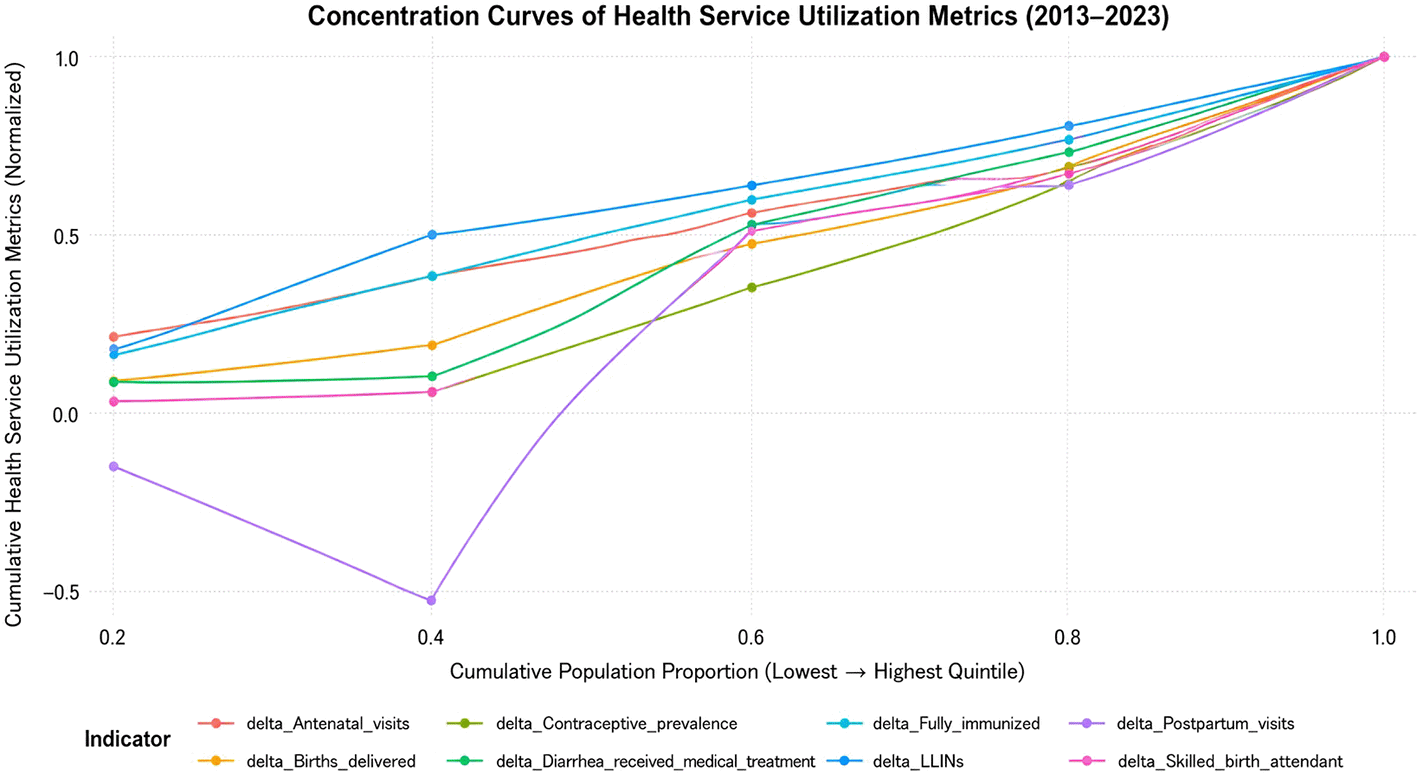
Figure 2 presents data from 2013 to 2023, showing overall improvements in health service utilization. However, these gains were more pronounced among wealthier populations. The concentration curves indicate that services such as antenatal visits, skilled birth attendance, and immunization became more concentrated in the higher quintiles, widening the gap between the rich and poor. In contrast, services such as births delivered in health facilities and children receiving treatment for diarrhea showed a more equitable distribution. Despite progress in expanding access to basic services, the data highlights increasing inequality in healthcare, with wealthier groups benefiting more from the improvements.
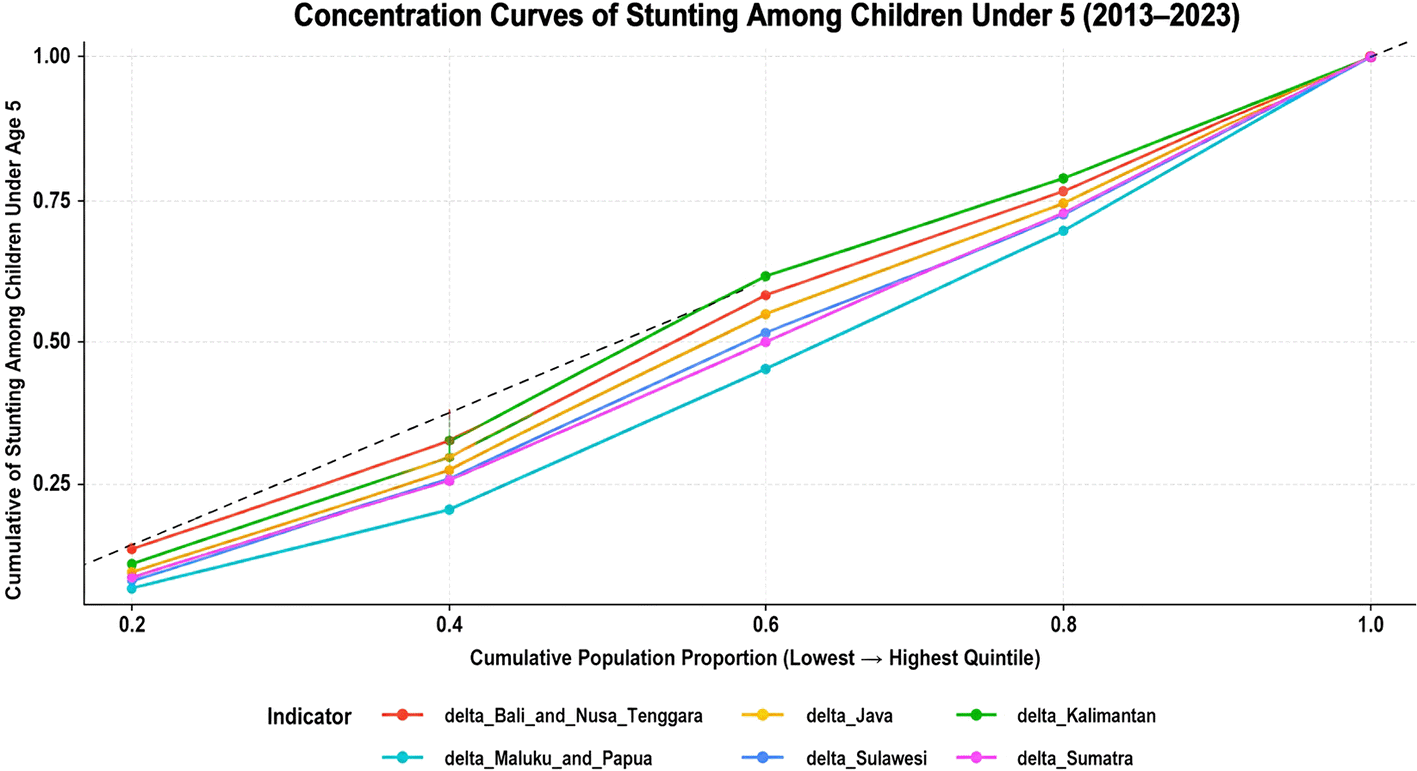
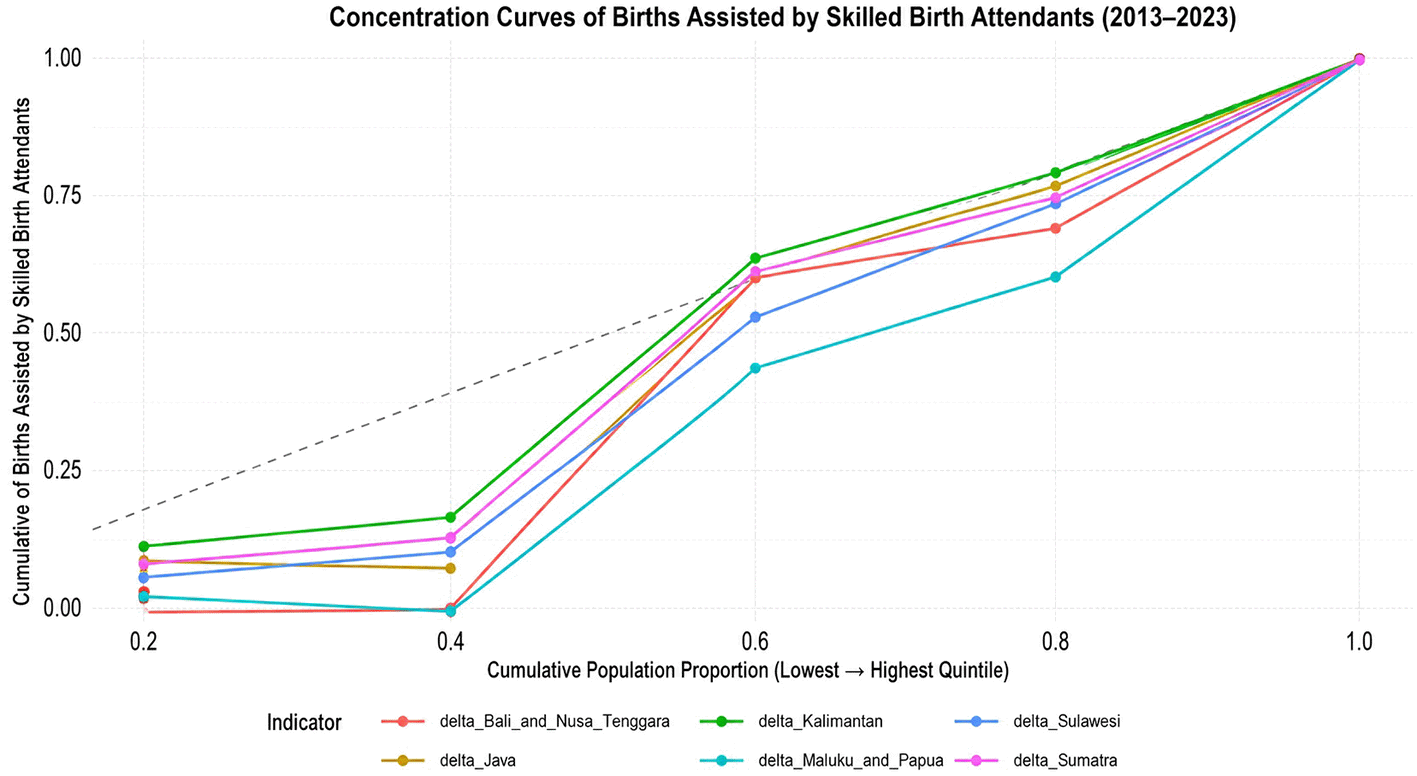
Regional health inequalities in Indonesia: Figure 3 and Figure 4 illustrated concentration curve that highlighted regional disparities in stunting rates and births assisted by skilled birth attendants in Indonesia from 2013 to 2023. Regions such as Java show lower stunting rates, while others, such as Papua and Maluku, exhibit higher rates, particularly among the lower population quintiles. Additionally, the poorest quintiles contribute very little to total SBA coverage, while access increases sharply in the middle quintiles and becomes almost universal among the richest groups. Maluku and Papua show the greatest inequality, with the curve far below the equality line in the lower quintiles.
This study highlights inequalities in the utilization of MCH services in Indonesia by examining two essential dimensions: health status indicators and health service utilization indicators. We also assessed equity trends across a range of MCH outcomes and healthcare utilization patterns. The results show that nearly all concentration indices for health status indicators were negative, while those for health service utilization were positive, indicating higher utilization among individuals in the highest socioeconomic quintile. Furthermore, the increasing concentration indices over time suggest that inequality gaps have widened, disproportionately disadvantaging individuals with lower socioeconomic status. The ‘rising tide’ of health improvements has not lifted all socioeconomic groups equally, with the wealthiest quintiles continuing to receive a disproportionate share of the benefits, suggesting that national-level development is not intrinsically equitable.
According to our analysis, childhood stunting is still a “pro-rich” problem, which means that the burden is still firmly established in the poorest quintiles while the health benefit is concentrated among wealthier quintiles. This disparity represents a multifaceted poverty trap rather than just being a result of calorie intake. Because wealthier households have greater access to “nutrition-sensitive” measures, such as better floor materials, clean indoor air, and reliable treated water sources, which are frequently inaccessible to the lowest quintile, the “pro-rich” bias endures even as national stunting rates drop.40,41 Maternal time-poverty may also contribute to the concentration of stunting among Indonesia’s poor. Moms in the lowest quintile frequently balance informal labor with caregiving, which might affect breastfeeding practices and the quality of supplemental feeding, whereas moms with higher incomes may have access to childcare or household assistance.41,42 This implies that the socioeconomic gap in stunting will probably stay unchanged unless structural obstacles—such as water, sanitation, and hygiene (WASH) infrastructure—are addressed in addition to direct nutrition supplements.
Malaria among children shows a wide gap between poor and rich households. Previous studies indicate that parental occupation reduces the prevalence of childhood infection of malaria, not only as a marker of socioeconomic status but also as a determinant of exposure patterns that shape the distribution of malaria burden. Furthemore, area with relatively better infrastructure, such as well-constructed housing and improved sanitation.43 Government decision-making can be influenced by a more accurate understanding of malaria demand patterns, which can also assist external funders in allocating funds to those in need areas.44 Food insecurity, poverty, unhealthy lifestyles, and socioeconomic inequality all work together to reduce the capacity of a country to sustain metabolic balance.45 Underweight is affecting specific groups of very poor women in very poor countries.46 The wide poor–rich gap in low maternal BMI reflects persistent socioeconomic inequalities in nutrition and health. These structural advantages widen the nutritional gap, indicating that national improvements in maternal nutrition may conceal entrenched pro-poor burdens.
Consistent with evidence from Southeast Asia, a family’s wealth and maternal education levels continue to be strong predictors of SBA uptake in 2010–2022.47 A common path has been followed by the countries that have increased maternal health care coverage by SBA from a relatively low baseline over the past few decades. Urban wealthy people have had the greatest rise in coverage, followed by rural wealthy people, urban poor people, and rural poor people.48,49 Although SBA coverage appears improvement in rural and urban area, the persistence of a pro-poor burden suggests that poorer women remain disproportionately disadvantaged, indicating that overall progress masks underlying socioeconomic inequalities.
The Health Research and Development Agency (BKPK) (2020) reported that 27.5% of community health centers (Puskesmas) reduced service hours and 83.6% of facilities experienced declines in visits.50,51 UNICEF (2020) survey found that 76% of integrated health posts (Posyandu) suspended activities, and 46% stopped ANC services.52 Fear of COVID-19 and negative perceptions of health facilities reduced care-seeking behavior, leading to declines in ANC and immunization coverage, which were further exacerbated by structural barriers such as limited health workforce distribution, distance, geography, and transportation costs.51
Southeast Asia continues to be a global hotspot for stunting and wasting, with significant regional differences in child health outcomes driven by socioeconomic and cultural variables.53,54 Though development has been uneven, MCH equity has improved throughout the ASEAN area. Significant internal regional disparities are concealed by comparatively high national service coverage in nations such as Indonesia and Cambodia. In Indonesia, gaps in facility readiness and specialist availability, combined with a decentralized health system, continue to limit equitable access to quality MCH care.55 There is still a pro-rich disparity in service consumption, even though the expansion of National Health Insurance (JKN) has supposedly lowered financial barriers to MCH treatments. This implies that the “inverse care law” is motivated by substantial indirect burdens that disproportionately impact the lowest quintile in addition to the direct expense of treatment. Poorer households in remote or rural areas still have to deal with high transportation expenses, lost opportunity costs (wages), and spatial disparities in facility readiness even when they have insurance. The lack of an obstetrician in about 40% of district hospitals suggests that the 24-hour continuum of care required to handle emergency circumstances is not adequately provided. In order to provide women with high-quality care, regulatory frameworks, infrastructure, health professional training, employee retention and motivation, and support networks are all important.56,57 Additionally, a “supply-side” imbalance frequently hinders JKN’s efficacy; although the impoverished are now covered by insurance, the distribution of specialists and top-notch facilities is still concentrated in urban, wealthier areas, leaving the most vulnerable with access to care that is of lower quality or has fewer resources.
The policy environment and decentralized administration of Indonesia must be taken into consideration when analyzing the inconsistent progress made in reducing stunting and maternal mortality. Although the National Strategy for Accelerating Stunting Prevention (Stranas Stunting) has effectively made nutrition a national priority, its effects are still not uniform across the country. Presidential Regulation 72/2021 increased family-centered interventions, however the success of these initiatives frequently depends on local governments’ ability. To ensure sustainable improvements in MCH, policymakers should prioritize the monitoring of equity focused interventions and adopt approaches that strategies are context-specific, evidence-based, and inclusive of vulnerable and marginalized groups, particularly in Papua and Maluku. Effective cross-sectoral collaboration, strengthened institutional capacity, and active community engagement are essential to improving the accessibility and quality of MCH services. In order to improve service delivery mechanisms, determine what works in a variety of situations, and bridge the ongoing gap between policy goals and actual results, it is also necessary to boost the role of Puskesmas and expand outreach through implementation research.
The utilization of substantial, nationally representative datasets with large sample sizes, which guarantee excellent precision of the findings across multiple survey years in Indonesia, is this study’s primary strength. This study confirms the attainment of Sustainable Development Goal (SDG) targets pertaining to MCH in Indonesia as well as universal coverage of MCH services. There are limitations, however, with the data presented. Variables have no clear definitions, some of which have changed over the years, and some have varying dimensions due to the availability of data, which can introduce inaccuracies. The absence of wealth index data in 2018 resulted in missing estimates, which negatively impacts the timeliness of the findings. Reliance on self-reported data introduces the possibility of recall bias.
The wealthiest quintiles continue to have better health outcomes and more service consumption, according to our analysis of data from 2013 to 2023. This is known as the “inverse care law.” Importantly, the increasing concentration indices for a number of indicators point to the entrenchment of socioeconomic differences, especially in preventive care and nutrition. Using national averages could conceal serious vulnerabilities among the impoverished and those living in distant areas. These growing disparities jeopardize Indonesia’s capacity to meet its SDG targets and guarantee the long-term viability of its healthcare system if they are not addressed. There is an indication that the available policies have not adequately met the needs of the most vulnerable groups. The sharp rises in maternal and postpartum complications in all quintiles, especially in the urban quintiles, point to the urgent need for improving the quality of clinical health services and the emergency obstetric care systems. While universal MCH coverage has expanded, these findings suggest that universalist approaches alone are insufficient. Indonesian health policy has to shift from emphasizing universal coverage to equitable quality. Future policies should incorporate explicit equity targets, prioritize underserved regions such as Papua and Maluku, and strengthen the quality of primary and emergency obstetric care, particularly through improved specialist distribution and the reduction of non-financial barriers.
Ethical review board approval was obtained from the Research and Community Engagement Ethical Committee, Faculty of Public Health, Universitas Indonesia, with reference number 562/UN2.F10.D11/PPM.00.02/2025.
During the preparation of this work the author(s) used ChatGPT in order to improve language and readability. After using this tool/service, the author(s) reviewed and edited the content as needed and take(s) full responsibility for the content of the publication.
| Views | Downloads | |
|---|---|---|
| F1000Research | - | - |
|
PubMed Central
Data from PMC are received and updated monthly.
|
- | - |
Provide sufficient details of any financial or non-financial competing interests to enable users to assess whether your comments might lead a reasonable person to question your impartiality. Consider the following examples, but note that this is not an exhaustive list:
Sign up for content alerts and receive a weekly or monthly email with all newly published articles
Already registered? Sign in
The email address should be the one you originally registered with F1000.
You registered with F1000 via Google, so we cannot reset your password.
To sign in, please click here.
If you still need help with your Google account password, please click here.
You registered with F1000 via Facebook, so we cannot reset your password.
To sign in, please click here.
If you still need help with your Facebook account password, please click here.
If your email address is registered with us, we will email you instructions to reset your password.
If you think you should have received this email but it has not arrived, please check your spam filters and/or contact for further assistance.
Comments on this article Comments (0)