Keywords
Maisotsenko Cycle (M-Cycle), Indirect Evaporative Cooling, Energy Efficiency, HVAC, Sustainable Cooling, Vapor-Compression Alternative

Maisotsenko Cycle (M-Cycle), Indirect Evaporative Cooling, Energy Efficiency, HVAC, Sustainable Cooling, Vapor-Compression Alternative
In 2022, global electricity demand for air-conditioning surpassed 2,000 TWh, with projections indicating a doubling by 2050. As urban populations grow and climate extremes intensify, buildings have become the frontlines of energy consumption and thermal regulation challenges.1 Space cooling alone accounts for a substantial portion of electricity use and has emerged as a key contributor to greenhouse gas emissions due to its reliance on conventional vapor compression systems.2 These systems not only require significant electrical input but also depend on synthetic refrigerants with high global warming potential (GWP), raising serious environmental concerns.3 Developing sustainable and energy-efficient alternatives for cooling is thus a top priority in the context of global decarbonization goals.4
Evaporative cooling offers a promising low-energy alternative by exploiting the sensible heat absorbed during water evaporation to reduce air temperature toward its wet-bulb value.5 While direct evaporative cooling (DEC) systems are simple and cost-effective, they often elevate indoor humidity, limiting their applicability in certain climates and building types.6 Indirect evaporative cooling (IEC) systems address this limitation by separating the product air stream from the working air stream, allowing heat transfer across wetted surfaces without adding moisture to the air supplied to occupants.7 This enables the benefits of evaporative cooling while maintaining indoor comfort condition.8
A notable advancement in IEC technology is the Maisotsenko Cycle (M-Cycle), which has gained increasing attention over the last decade for its ability to cool air below the wet-bulb temperature and toward the dew point.9–11 In this configuration, a portion of the intake air—designated as the working stream—is directed through wetted channels where evaporation drives heat and mass transfer. This process indirectly cools the product air flowing through adjacent dry channels. As a result, M-Cycle systems achieve higher thermodynamic efficiency than traditional IEC or DEC systems, without relying on high-GWP refrigerants or considerable mechanical energy inputs.12 These features make M-Cycle an attractive option for sustainable air-conditioning, particularly in hot and arid regions.13
Recent studies on M-Cycle and indirect evaporative cooling systems have expanded through advanced modeling, experimental testing, and comparative analysis. Pokorný et al. (2025) developed a validated one-dimensional heat and mass transfer model for the M-Cycle, demonstrating the system’s capacity to cool air below the wet-bulb temperature and toward the dew point with strong agreement to experimental data.9 Sulaiman et al. (2024) introduced a novel shell-and-tube dew point cooler and showed that counter-flow air–water configurations significantly enhance energy efficiency and reduce outlet air temperature compared to conventional IEC setups.14 Güzelel et al. (2024) conducted CFD simulations across multiple IEC geometries and found that multi-aperture designs improved water-use efficiency and achieved higher COPs under elevated working-air ratios.15 Ferraro et al. (2023) provided a comprehensive review of analytical and CFD approaches for modeling indirect evaporative cooling systems, highlighting the importance of geometric configurations, wetted area assumptions, and boundary conditions in performance predictions.16 Finally, Zhou and Li (2024) experimentally evaluated a vertical shell-tube cooler with grooved inner tubes and demonstrated how optimized velocity ratios and structural enhancements improve water-film distribution, cooling capacity, and thermal efficiency.17 Collectively, these studies underscore recent advances in understanding and optimizing M-Cycle performance across diverse configurations, flow regimes, and environmental conditions.
Despite these advances, one critical operational factor—air velocity—remains underexplored in a rigorous and systematic manner. Most previous studies have treated airflow rate as a fixed or secondary parameter, often under simplifying assumptions, thereby overlooking its pivotal role in controlling convective heat transfer, evaporation rate, and system pressure drop. In reality, air velocity significantly influences thermohydraulic variables such as the Nusselt number, surface heat and mass exchange rates, flow regime behavior, fan energy demand, and pressure losses.18 In compact M-Cycle heat exchangers, which typically feature narrow and elongated channels, increasing air velocity beyond 6–8 m/s can induce a transition from laminar to turbulent flow. While this shift enhances convective performance, it also exacerbates pressure losses and mechanical energy consumption—creating a fundamental trade-off that must be carefully balanced. Identifying an optimal air velocity is therefore crucial for maximizing system performance and energy efficiency.
To address this research gap, the present study conducts a comprehensive parametric analysis of the influence of air velocity on the thermodynamic performance of an M-Cycle-based indirect evaporative cooling system, employing a robust numerical approach as a powerful analytical tool.19–21 A two-dimensional steady-state analytical model is developed, accounting for convective heat transfer, surface evaporation, moist air property variations, and pressure losses in flow channels. The model is validated against existing data and evaluated over a broad range of air velocities (2–10 m/s). Key output parameters—including outlet air temperature, relative humidity, evaporation rate, effective heat transfer coefficient, pressure drop, coefficient of performance (COP), and energy efficiency ratio (EER)—are systematically investigated. The findings provide practical insights for airflow optimization, energy reduction, and the climate-resilient design of next-generation M-Cycle cooling systems.
To develop the analytical model, several simplifying assumptions were adopted as follows:
• Heat exchange between the system and the external environment is considered negligible.
• Both air and water streams are treated under steady-state flow conditions.
• Air is modeled as an ideal, incompressible mixture of dry air and water vapor.
• Channel walls are assumed to be impermeable to both air and moisture.
• Thermal conduction along the airflow direction, both through the solid walls and within the water film, as well as molecular diffusion of vapor in air, are neglected.
• Given the minimal thickness of the water film, temperature gradients across its depth are ignored.
• Due to the relatively high convective heat transfer coefficient of the water film, the wall temperature is assumed to be locally equal to that of the water film.
• Evaporative mass transfer is assumed to occur solely at the air–water interface.
• Owing to the large heat capacity of water, the water film is considered to maintain a constant temperature along the flow direction.
• At the wet outlet, the relative humidity is assumed to reach saturation (i.e., 100% relative humidity), consistent with M-Cycle theory.
• Airflow profiles are considered fully developed from the inlet.
• The air velocity is uniform across all wet channels.
Mathematical Formulation
Temperature distribution
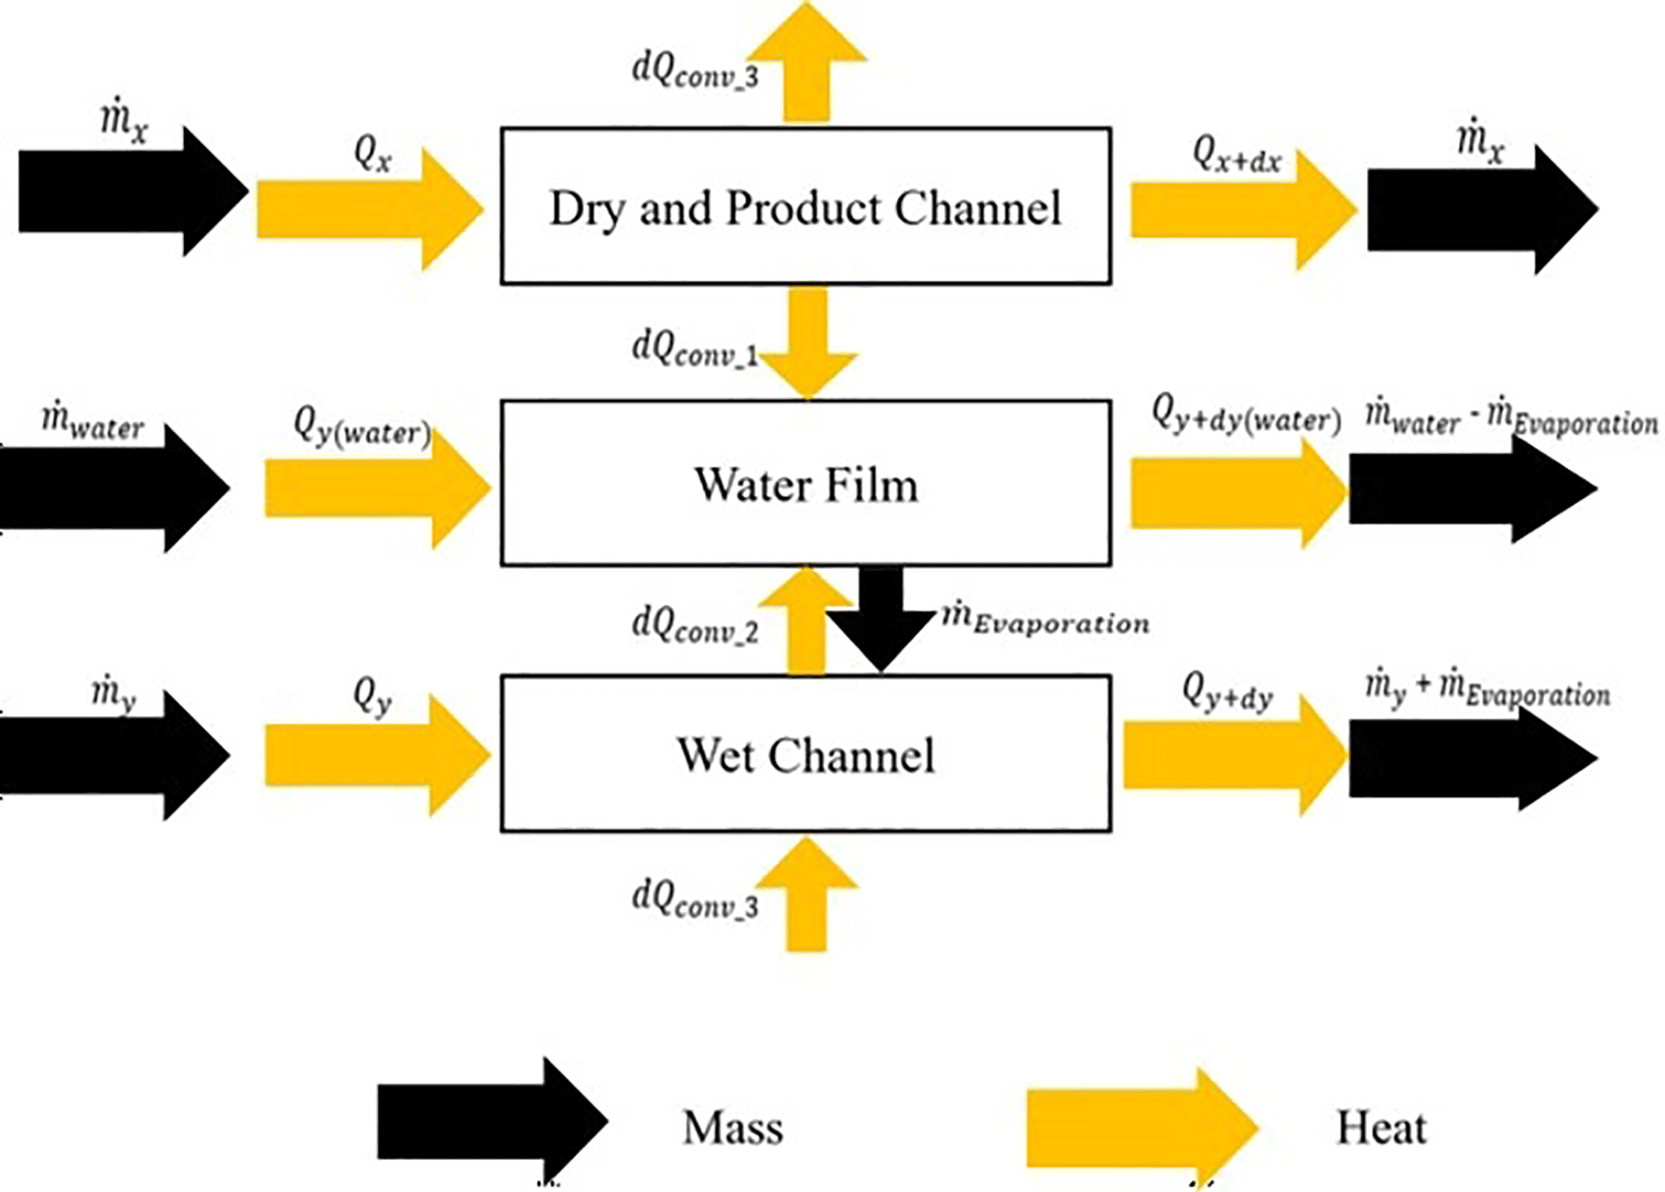
For the dry floor, an energy balance was conducted under the assumption of steady-state airflow. Considering the control volume illustrated in Fig. 1, the differential form of the energy balance along the dry air stream is formulated as follows:
The variables of Eq. 1 are calculated as follow:
By substitution in Eq. 1:
Here is the convective heat transfer coefficient, is the height of the product channel, is air velocity in the product channel and is the width of the product and dry channels. and are the film and product air temperatures, respectively.
In the wet channels, both energy and mass balances are required to determine the air and water temperature distributions. According to Fig. 1, the energy balance for the wet airflow is given by:
The variables in Eq. 8 are determined as follows:
is the rate of water evaporation and is the latent heat of evaporation. is the width of wet channel and is the heat transfer coefficient in the wet channel.
By substitution, the distribution function of air temperature has been calculated as Eq. 12:
To find this function for the water, the same approach is employed:
Each of the variables Eq. 13 relation is calculated as follows:
With helping the Eq. 4 and Eq. 11 and substitution, the water film’s temperature distribution has been calculated by Eq. 16:
Considering the operation of the M-Cycle, it can be stated that no humidification occurs during the cooling process,6 therefore:
Using the relation provided in,16 which describes the connection between absolute humidity and relative humidity, the following equation can be derived:
Since the outlet temperature depends on the velocity, the outlet relative humidity will also be velocity-dependent. Given that relative humidity significantly affects thermal comfort conditions,23 it is therefore necessary to investigate the effect of velocity on outlet relative humidity.
Number of Transfer Units (NTU)
Since the outlet air temperature was obtained using the NTU method applied to the control volume, this parameter should also be examined. According to the definition of NTU in,24 the effect can be evaluated as:
One of the important factors in heat exchanger design is the air supply rate, which must be suitable for the intended application. Considering the following relation, CFM can be calculated as:
One of the most critical factors for any cooling device is its cooling capacity, as this parameter determines the selection of the system for a specific application. The cooling capacity depends on the temperature reduction of the airflow and the mass flow rate. For this purpose, the following relation from25 can be used:
Based on the above relations, since the outlet temperature and airflow rate are velocity-dependent, the cooling capacity will also be a function of velocity.
The fan, being a component that typically consumes the most electrical power in a cooler, largely determines the total energy consumption of the device (the other major component is the water pump, which consumes roughly one-tenth of the fan’s electrical energy). Calculating the pressure drop in the device is important to estimate fan power consumption, since the fan must overcome this pressure drop. Using the relation presented in the reference,26 the pressure drop can be expressed as:
Since both volumetric flow and pressure drop depend on velocity, the fan power also depends on velocity.
Another important metric for any device is the energy consumption or energy efficiency ratio. For this, the Energy Efficiency Ratio (EER) is used. According to28:
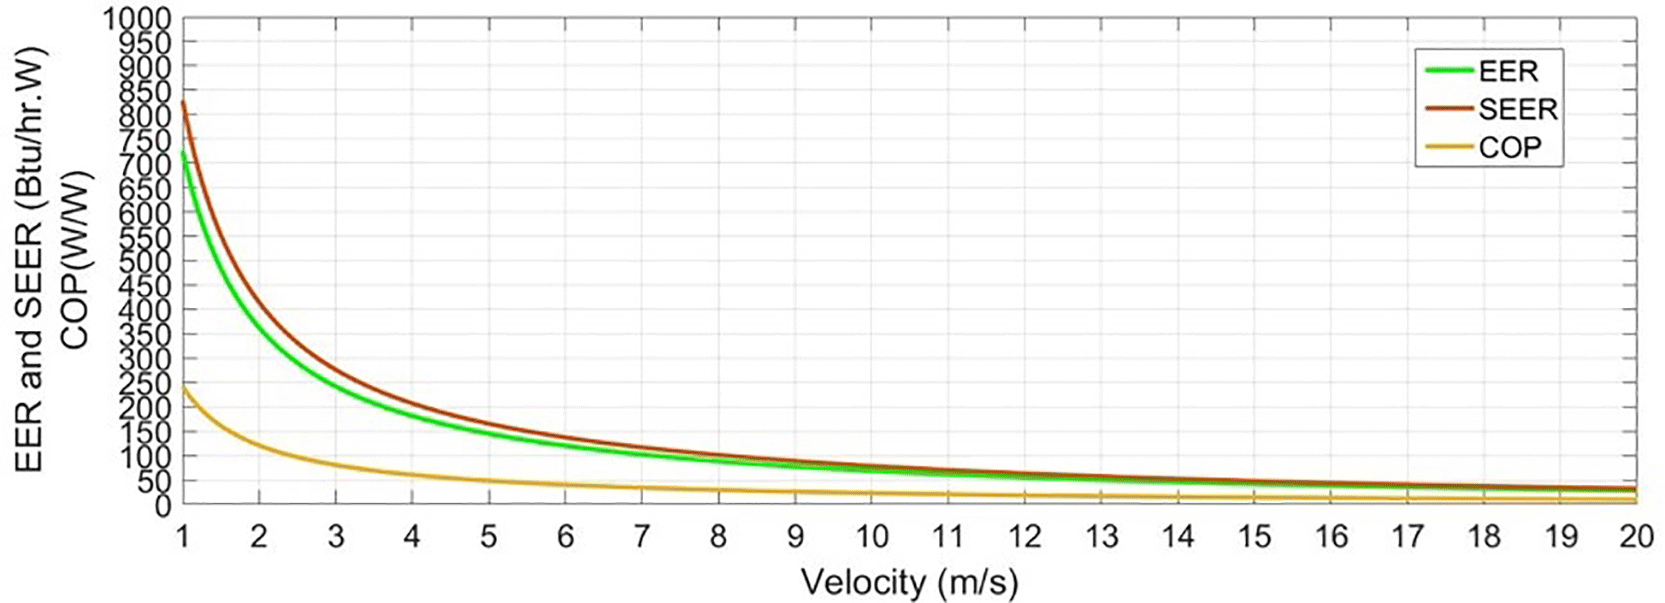
Using the relations provided in,28 the Seasonal Energy Efficiency Ratio (SEER) and the Coefficient of Performance (COP) can also be calculated as follows:
As shown in Eq. 25, both the numerator and denominator depend on velocity; therefore, EER is also velocity-dependent.
One of the key factors influencing cooler performance and the cooling process is the convective heat transfer coefficient. Since this coefficient depends on various factors such as whether the flow is laminar or turbulent, fully developed or not, and these factors themselves depend on velocity, it follows that the convective heat transfer coefficient is velocity-dependent. For example, flow regime (laminar or turbulent) is characterized by the Reynolds number, which itself is velocity-dependent and measurable. For laminar flow, data from29 is used, and the heat transfer coefficient is calculated by the Nusselt relation. For turbulent flows, the Dittus-Boelter equation is applied30:
Due to the presence of Reynolds number in the equation, the convective heat transfer coefficient in turbulent flow is velocity-dependent. Therefore, changes in this coefficient under the influence of velocity were investigated for both wet and dry channels.
a) Meteorological conditions
Environmental boundary conditions for the simulations were defined using meteorological data for Tehran during July, the hottest month of the year. The specified conditions are as follows:
Dry bulb temperature =
Wet bulb temperature =
Dew point temperature =
Relative humidity =
b) Structural specifications
The geometrical dimensions and design specifications used in this study are adopted from previous research31 and are summarized in Table 1. These parameters serve as the basis for solving the governing equations within the CFD framework. The channel configurations for each layer of the system are detailed accordingly.
| Channel Type | Length × Width × Height (mm × mm × mm) | Number of Channels |
|---|---|---|
| Product | 800 × 50 × 3 | 8 |
| Dry | 800 × 50 × 3 | 4 |
| Wet | 300 × 80 × 6 | 20 |
The plates separating adjacent channels are assumed to have a uniform thickness of 1 mm. The inlet air velocity is set to 5 m/s, consistent with values reported by Pandelidis et al.32 Additionally, the water film thickness is taken as 2.5 mm, based on the experimental observations of Dean et al.33 Thermophysical properties required for energy and mass transfer calculations are sourced from the comprehensive dataset provided by Cenjel et al.34
All aforementioned geometrical dimensions and physical parameters were incorporated exclusively into the CFD simulations and numerical solution framework to ensure reliable predictions of the system’s thermal and fluid flow characteristics. The resulting analytical model was subsequently implemented in Python, facilitating a detailed parametric analysis of airflow velocities within the range of 0–20 m/s and their impact on the overall thermodynamic and hydrodynamic performance of the proposed system.
To ensure the accuracy of the present model, a validation process was carried out using the experimental data reported by Anisimov.35 The simulation framework adopted in this study replicates the configuration of the heat and mass exchanger (HMX) used in Anisimov’s work. A comparison between the simulation outcomes and Anisimov’s experimental measurements was conducted.
Table 2 outlines the input parameters derived from Anisimov’s setup, which have been consistently applied in the current numerical model. The corresponding simulation results, aligned with these inputs, are presented in Table 3. As shown, there is a strong agreement between the present simulation and the experimental data across all key performance metrics, indicating the reliability and robustness of the developed model.
| Design parameter | Air inlet temperature | Water inlet temperature | Air velocity inlet | Wet to product airflow ratio | Relative humidity inlet air |
|---|---|---|---|---|---|
| value | 40°C | 18°C | 5 m/s | 0.3 | 25% |
This section presents a detailed and comprehensive analysis of the thermodynamic and hydraulic performance of the M-Cycle-based indirect evaporative cooling system across a wide range of air velocities. Simulations were performed for velocities ranging from 0 to 20 m/s, and a variety of key performance indicators—including outlet air temperature, relative humidity, cooling capacity, heat transfer rates, fan power consumption, pressure drop, and energy efficiency metrics such as Coefficient of Performance (COP), Energy Efficiency Ratio (EER), and Seasonal Energy Efficiency Ratio (SEER)—were systematically assessed. The results reveal a strongly nonlinear system response governed by a complex interplay of airflow dynamics, heat and mass transfer mechanisms, and the thermophysical properties of the moist air streams flowing through both dry and wet channels.
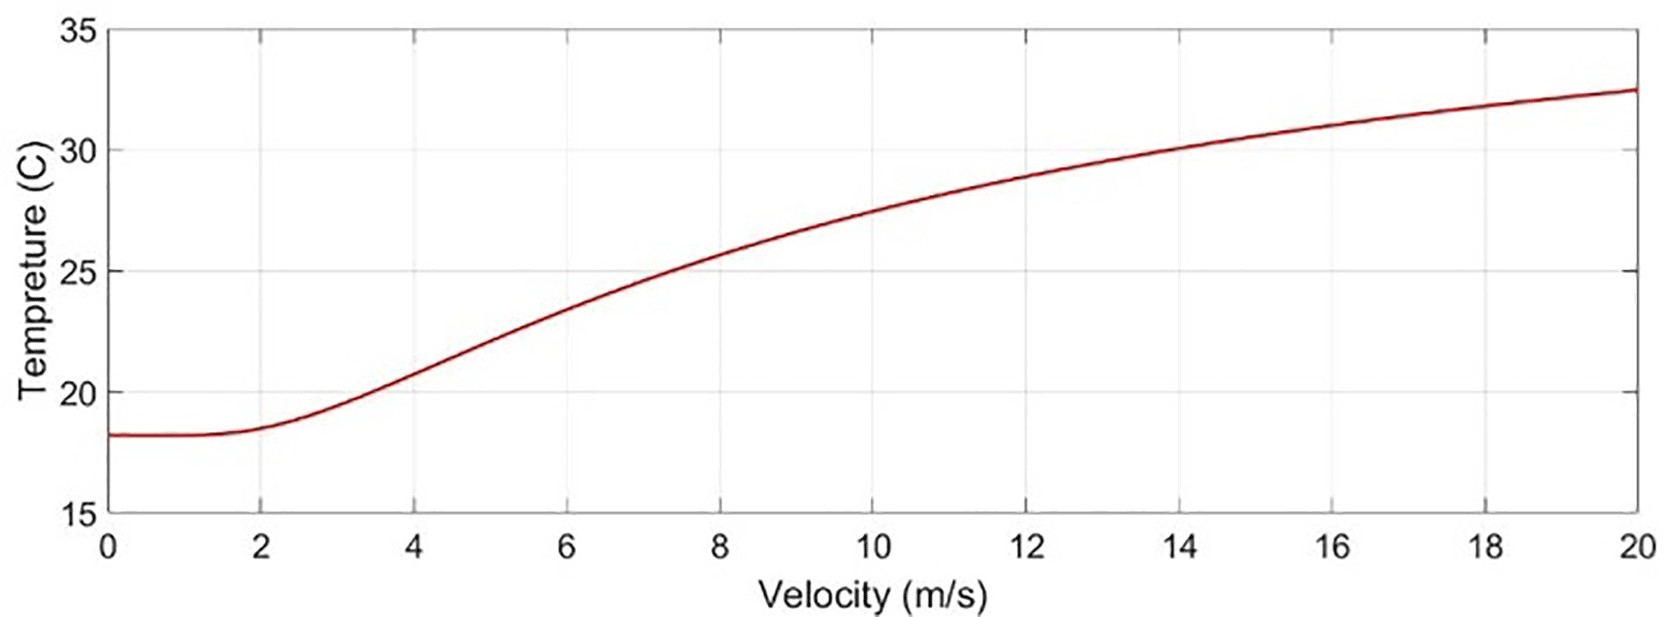
At low air velocities (< 4 m/s), the flow remains firmly in the laminar regime (Reynolds number Re < 2300), which results in prolonged residence time for the process air within the heat exchanger channels. This longer residence time facilitates enhanced heat and mass transfer via evaporation, thereby yielding a significant reduction in outlet air temperature. Specifically, the outlet air temperature approaches approximately 22.3°C, which closely aligns with the ambient wet-bulb temperature, as illustrated in Fig. 2. Under these conditions, the system operates with minimal fan power consumption and low pressure drop, factors which are advantageous from both energy consumption and operational cost perspectives. However, a critical trade-off emerges as the relative humidity of the outlet air increases toward saturation (near 100%), potentially compromising thermal comfort in indoor environments. High relative humidity can contribute to a feeling of stuffiness and reduce occupant comfort, especially in buildings with limited ventilation.
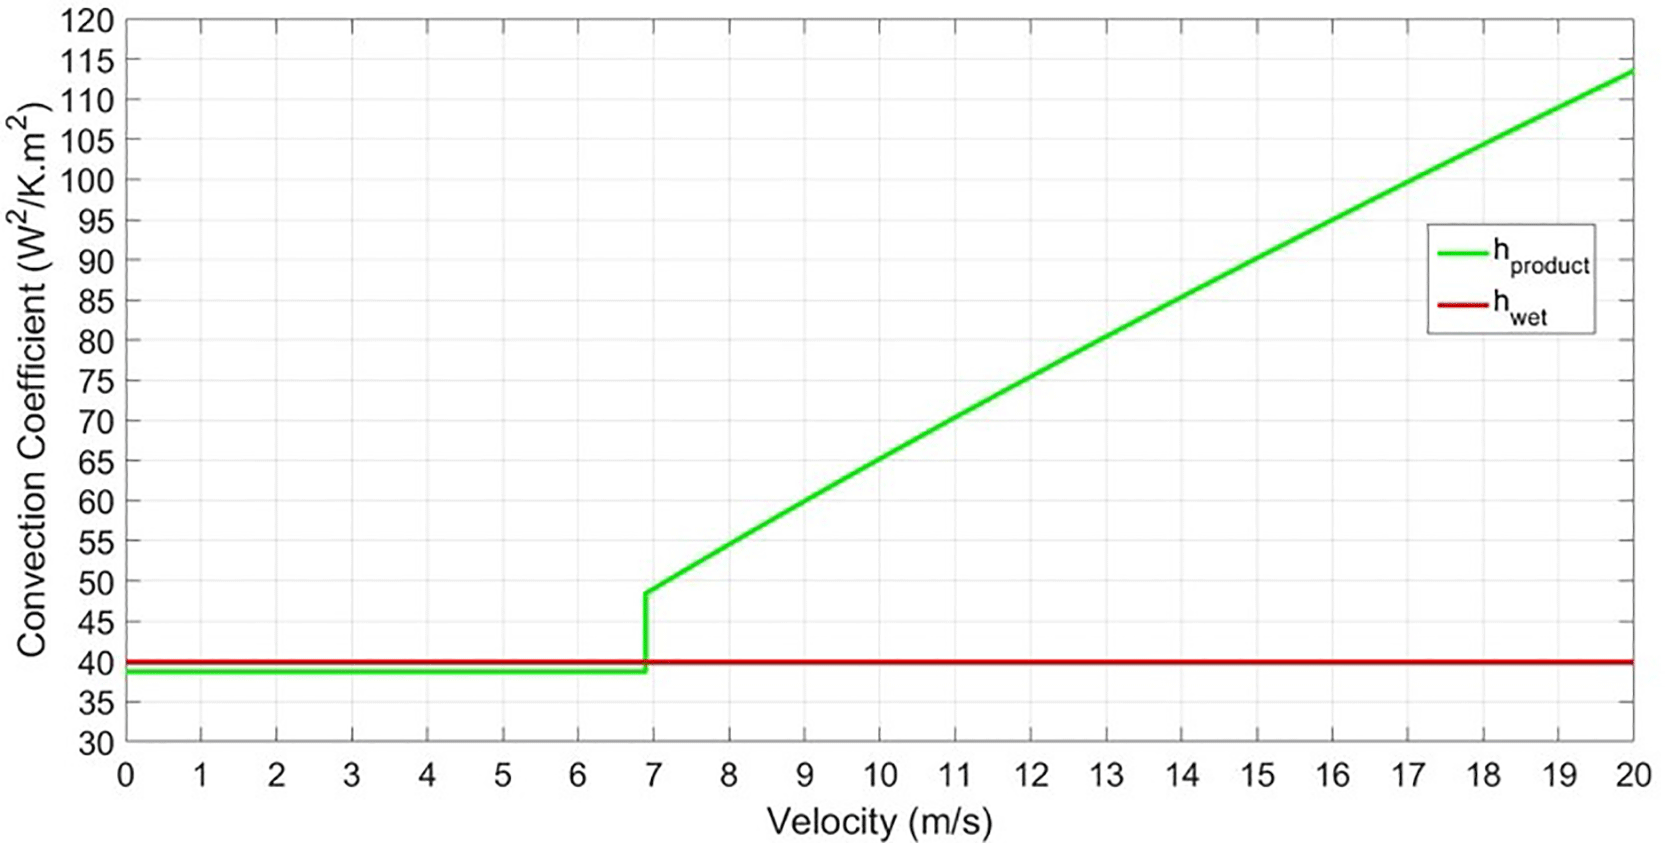
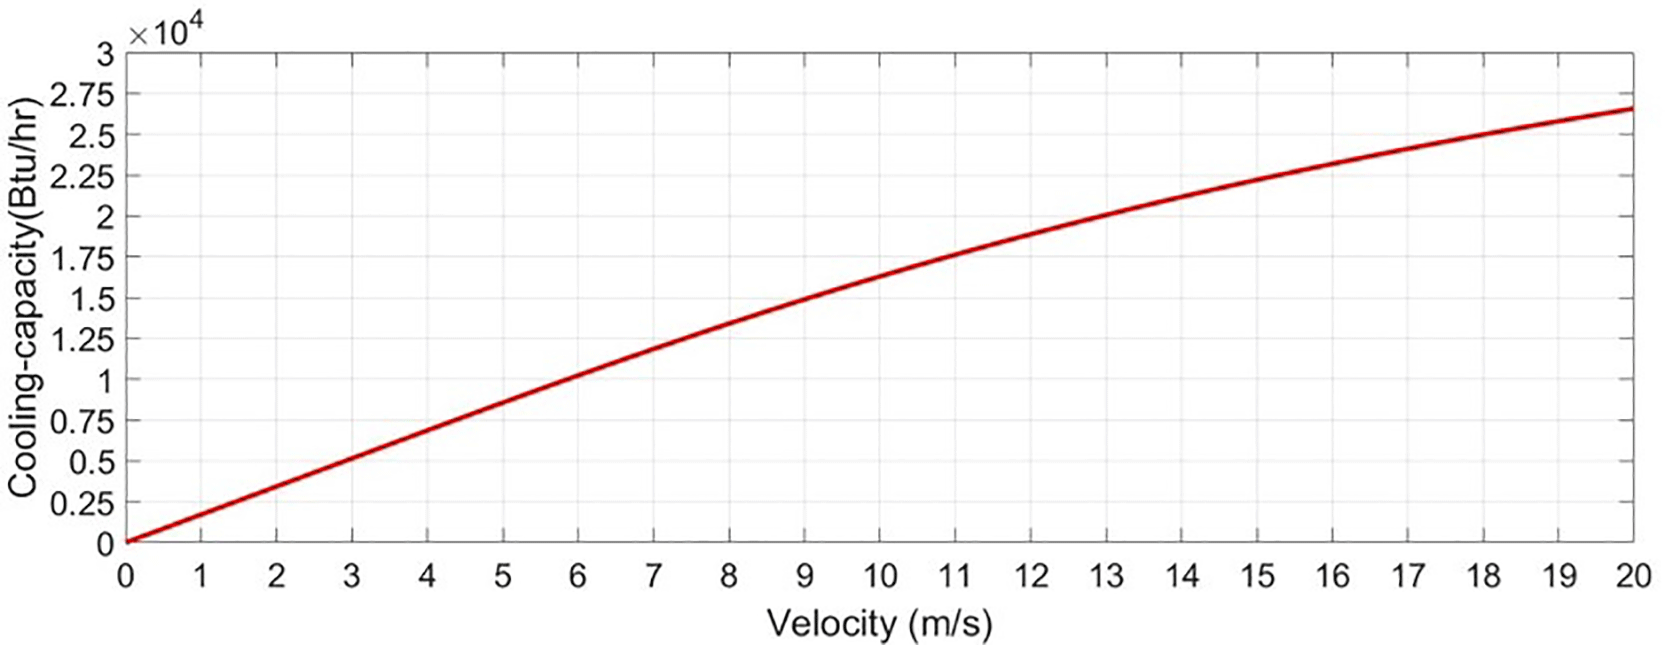
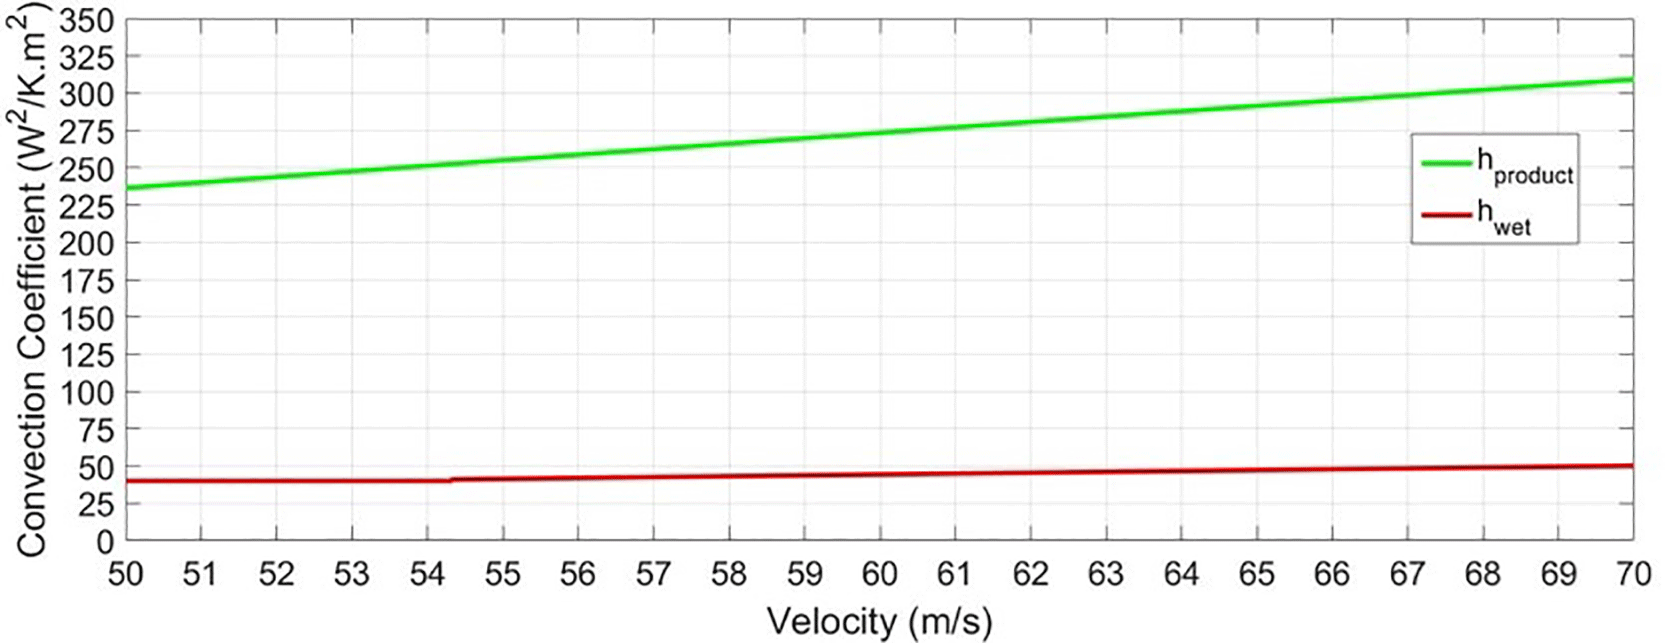
As air velocity increases and enters the transitional flow regime (6–8 m/s), the Reynolds number rises beyond the laminar threshold, promoting the onset of turbulence within the dry channels. Turbulent flow enhances convective heat transfer coefficients due to increased mixing and disruption of thermal boundary layers, despite a corresponding decrease in residence time. This trade-off is clearly observed in Fig. 3, where convective heat transfer coefficients rise substantially with increasing velocity. At an air velocity of 7 m/s, the system achieves its optimal performance, delivering a cooling capacity of 17,642 Btu/hr (equal to 5117 W) and maintaining an outlet air temperature of 22.27°C with a comfortable 71% relative humidity (see Figs. 2, 4–6). This combination indicates efficient heat and mass exchange while preserving indoor comfort. The energy performance metrics also peak at this point, with a COP of 38.21, an EER of 130.42 Btu/hr·W, and a SEER of 144.91 Btu/hr·W (Fig. 7). These values highlight the ability of the M-Cycle system to balance energy input and cooling output effectively, which is critical for sustainable HVAC applications.
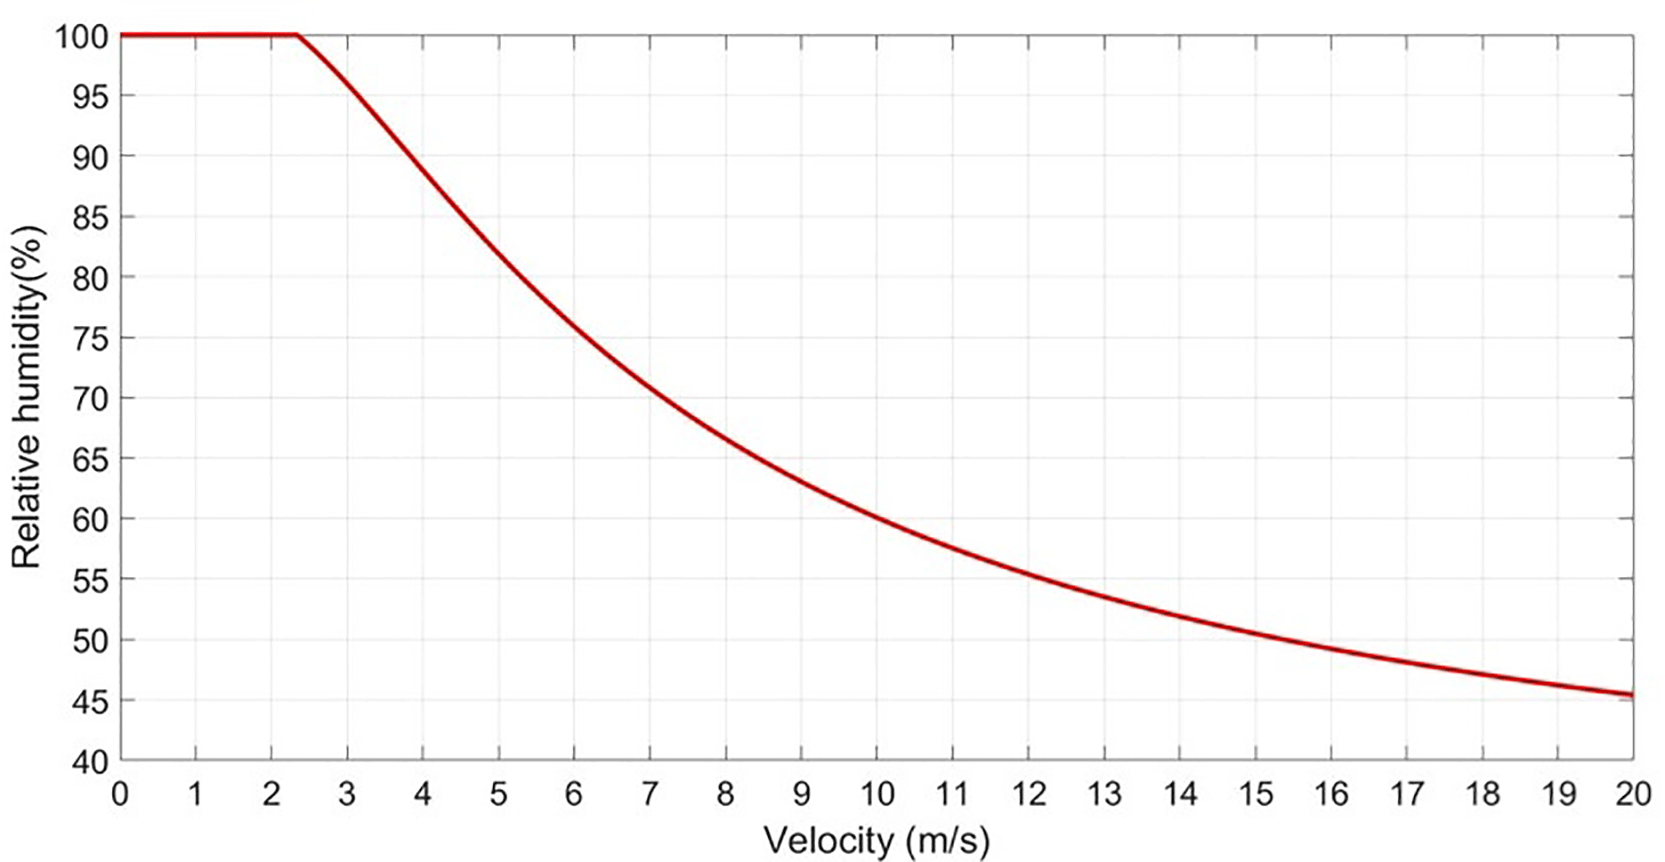
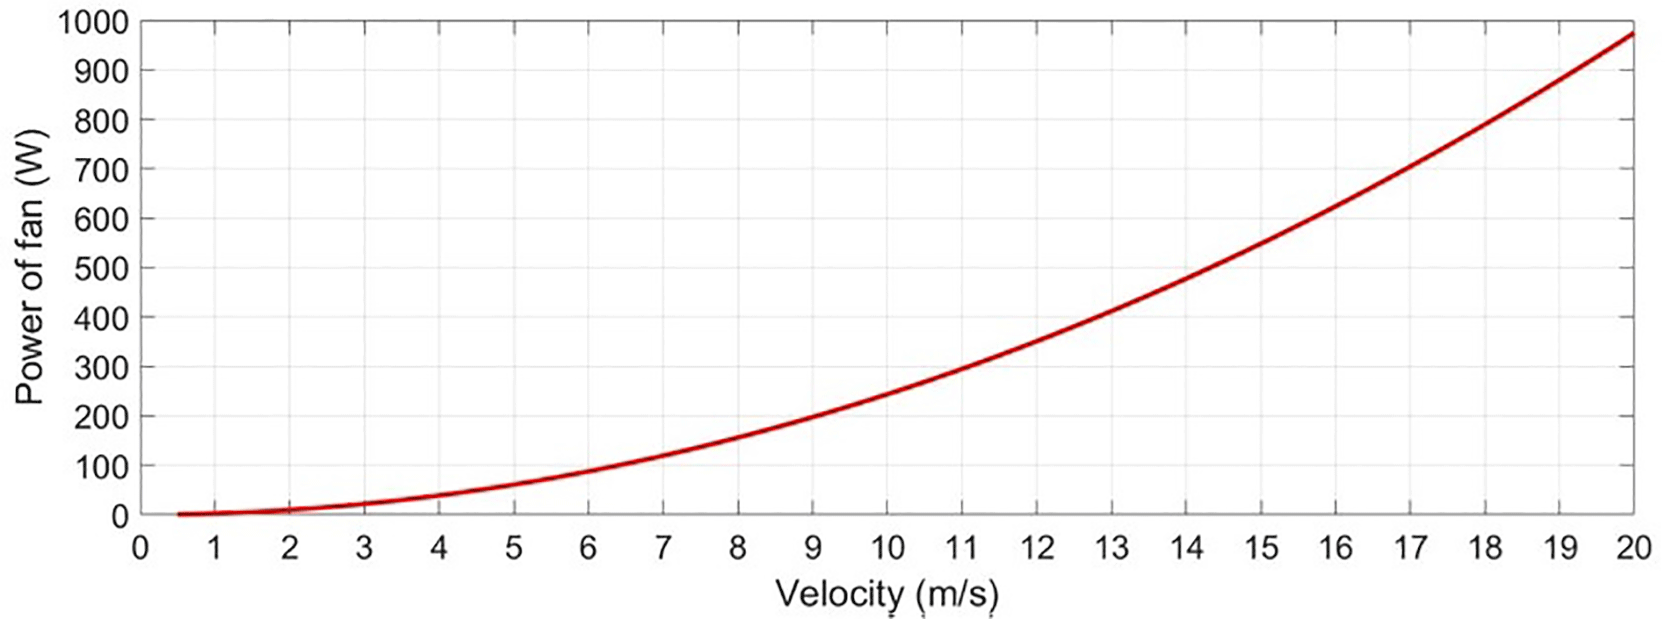
Beyond 7 m/s and particularly at higher velocities exceeding 12 m/s, the airflow fully transitions into turbulent regime, which results in further increases in convective heat transfer coefficients. However, the rapid decrease in residence time means that the air spends less time in contact with the wetted surfaces, diminishing the effectiveness of evaporative cooling. Consequently, the outlet air temperature rises above 26°C (Fig. 2), moving away from the dew point, and thus the system’s ability to cool air below the wet-bulb temperature is compromised. This condition is accompanied by a decrease in outlet relative humidity, which may initially seem beneficial for thermal comfort but is offset by the elevated temperatures. Moreover, fan power consumption surges dramatically, exceeding 300 W at 15 m/s, nearly double the power required at the optimal velocity (Fig. 8). This combination of increasing energy demand and decreasing cooling performance leads to both environmental inefficiency and higher operational costs, making high-velocity operation unattractive.
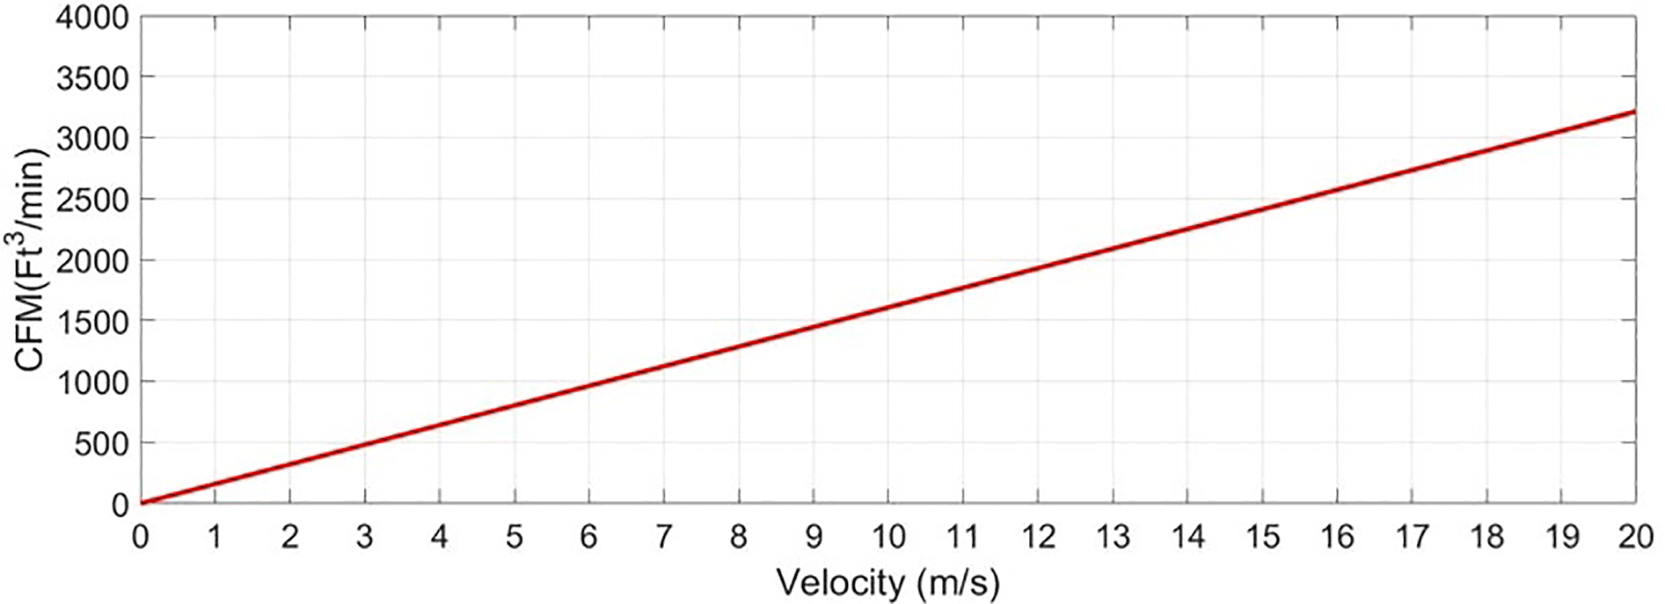
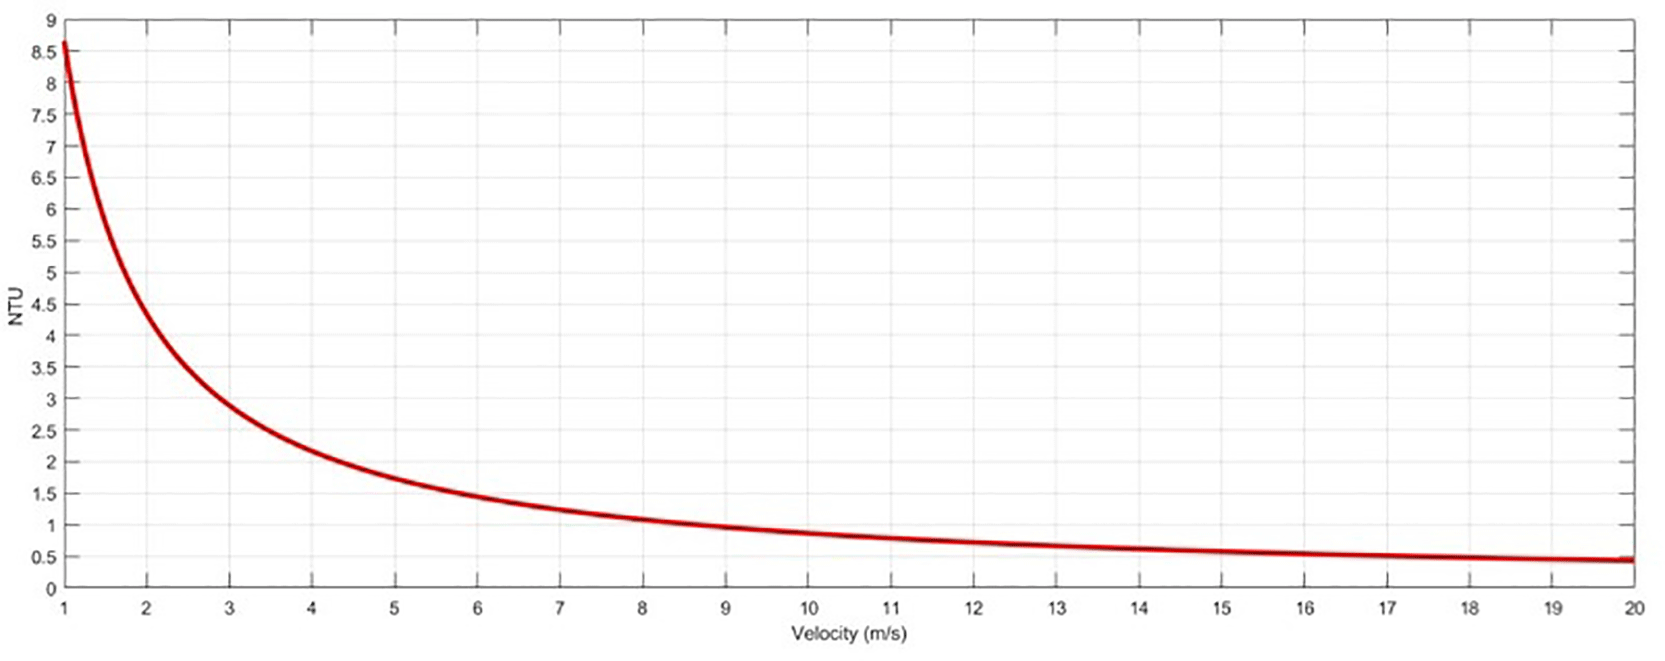
From a hydraulic perspective, volumetric airflow (measured in cubic feet per minute, CFM) scales linearly with air velocity, reaching approximately 506 ft3/min at the optimal 7 m/s velocity (Fig. 4). While increased airflow contributes to greater cooling capacity by supplying more process air, the benefit diminishes beyond 10 m/s (Fig. 5). This plateau in cooling capacity gain suggests a point of diminishing returns where additional mechanical energy inputs do not translate into proportional cooling improvements. Correspondingly, heat exchanger effectiveness—as quantified by the Number of Transfer Units (NTU)—declines with increasing air velocity, dropping from approximately 1.1 at 7 m/s to near 0.8 at velocities above 12 m/s (Fig. 9). This reduction signals a loss of heat exchanger efficiency due to shortened residence time and less effective heat and mass transfer.
The analysis of convective heat transfer coefficients provides further insight into the system’s internal dynamics. At the optimal velocity of 7 m/s, the convective heat transfer coefficient in the dry (product air) channel rises significantly from around 30 to approximately 49 W/m2·K, reflecting the transition from laminar to turbulent flow and the associated enhancement of convective transport (Fig. 3). In contrast, the wet channel—where the airflow velocity is approximately 10% of that in the dry channel—remains within the laminar flow regime, maintaining a relatively stable heat transfer coefficient near 39.9 W/m2·K (Fig. 10). This disparity between the two channels highlights the importance of channel-specific velocity distribution and design optimization to balance heat transfer improvements with the potential for increased pressure drop and energy consumption.
Fan power consumption is shown to exhibit a quadratic relationship with air velocity (Fig. 8), consistent with established thermodynamic and fluid dynamic theory. At the optimal operating point of 7 m/s, fan power is calculated at 125.8 W, a reasonable energy input when considered relative to the cooling capacity achieved. However, as air velocity rises beyond this point, fan power requirements increase exponentially due to heightened pressure losses, while cooling performance declines. This imbalance underscores the necessity of operating within an optimal velocity window to maximize overall system efficiency and sustainability.
The implications of these findings are significant for the design and control of M-Cycle indirect evaporative cooling systems. Operating near the identified optimal velocity of 7 m/s enables maximum cooling capacity and energy efficiency while maintaining occupant comfort through moderate humidity levels. This balance is especially crucial in hot and arid climates where evaporative cooling can substantially reduce reliance on vapor compression systems, thus contributing to carbon footprint reduction and energy savings. Moreover, understanding the trade-offs associated with velocity changes allows engineers to optimize fan selection, channel geometry, and control strategies for varying climatic conditions and building requirements.
In addition to steady-state performance, future work should address the transient behavior of the system, including responses to fluctuating ambient conditions such as temperature and humidity, as well as dynamic load variations in buildings. Such investigations would help refine the optimal operating conditions and improve real-time control algorithms to further enhance system efficiency and user comfort.
In summary, the integrated thermodynamic, hydraulic, and energy performance analysis clearly identifies 7 m/s as the optimal air velocity for the M-Cycle indirect evaporative cooling system studied here. At this velocity, the system maximizes cooling capacity and energy efficiency, while maintaining acceptable fan power consumption and favorable thermal comfort indicators. The key performance parameters under these optimal conditions are summarized in Table. 4.
This study conducted a detailed thermodynamic and hydrodynamic investigation of an indirect evaporative cooling system based on the Maisotsenko Cycle (M-Cycle), with a specific emphasis on the influence of inlet air velocity on overall system performance. A two-dimensional steady-state analytical model was developed to simulate airflow behavior, coupled heat and mass transfer, and energy efficiency across a wide velocity range (0–20 m/s). Key performance metrics—including outlet air temperature, relative humidity, cooling capacity, convective heat transfer coefficients, fan power consumption, and energy indicators (COP, EER, SEER)—were comprehensively evaluated to determine optimal operational conditions.
The findings reveal a strongly nonlinear dependence of system performance on air velocity. At low velocities (< 4 m/s), laminar airflow conditions extend air residence time, thereby enhancing evaporative cooling and enabling outlet air temperatures close to the ambient wet-bulb temperature (~22.3°C). However, this benefit comes at the cost of elevated relative humidity levels near saturation, which may impair indoor comfort despite the advantage of reduced mechanical energy input.
In the intermediate velocity range (6–8 m/s), the transition to partial turbulence significantly boosts the convective heat transfer coefficient in the dry channels, improving overall heat and mass exchange efficiency. The optimal performance was observed at approximately 7 m/s, where the system delivered a cooling capacity of 17,642 Btu/hr, an outlet air temperature of 22.27°C, and a relative humidity of 71%, alongside a remarkably low fan energy consumption of 125.8 W. At this operating point, energy performance peaked with COP = 38.21, EER = 130.42 Btu/hr·W, and SEER = 144.91 Btu/hr·W, indicating an optimal balance between cooling effectiveness and energy input. Such detailed quantification addresses a critical gap in prior studies, which often lacked velocity-dependent optimization and full performance mapping of M-Cycle systems.
At higher velocities (> 12 m/s), the onset of fully turbulent flow results in a pronounced decline in evaporative effectiveness due to shortened residence time, causing outlet temperatures to exceed 26°C and drastically reducing energy efficiency. Simultaneously, fan power consumption increases nonlinearly, surpassing 300 W at 15 m/s, which significantly undermines the system’s economic and environmental advantages. These findings underscore the strong sensitivity of M-Cycle systems to airflow velocity and highlight the importance of precise velocity control for real-world applications. Compared with traditional vapor-compression and conventional IEC systems, the optimized M-Cycle configuration demonstrates substantial energy savings and reduced environmental impact.
From an engineering standpoint, these insights are crucial for the design and application of M-Cycle systems. Maintaining air velocity near 7 m/s ensures high cooling output and energy efficiency while preserving moderate fan power demands and thermal comfort. These results offer actionable guidance for fan selection, channel geometry optimization, and smart control strategies, particularly in hot and arid regions where reducing dependence on high-GWP refrigerants is critical for decarbonization goals.
For future research, it is recommended to examine the transient performance of M-Cycle systems under dynamic environmental conditions—including fluctuations in ambient temperature, humidity, and building cooling loads. Additionally, integrating variable-speed fan technologies and real-time control algorithms could further enhance adaptability, energy savings, and long-term operational stability. Exploring hybrid designs that incorporate phase change materials or solar-assisted cooling may also open new pathways for efficiency improvements.
Overall, this study establishes the M-Cycle as a highly effective, environmentally responsible, and energy-efficient alternative to conventional air-conditioning technologies. These findings provide a solid foundation for deploying M-Cycle technology as a cornerstone of sustainable cooling solutions in a decarbonized future.
Source code available from:
Archived software available from:
https://doi.org/10.5281/zenodo.20716743
License:
MIT License
| Views | Downloads | |
|---|---|---|
| F1000Research | - | - |
|
PubMed Central
Data from PMC are received and updated monthly.
|
- | - |
Provide sufficient details of any financial or non-financial competing interests to enable users to assess whether your comments might lead a reasonable person to question your impartiality. Consider the following examples, but note that this is not an exhaustive list:
Sign up for content alerts and receive a weekly or monthly email with all newly published articles
Already registered? Sign in
The email address should be the one you originally registered with F1000.
You registered with F1000 via Google, so we cannot reset your password.
To sign in, please click here.
If you still need help with your Google account password, please click here.
You registered with F1000 via Facebook, so we cannot reset your password.
To sign in, please click here.
If you still need help with your Facebook account password, please click here.
If your email address is registered with us, we will email you instructions to reset your password.
If you think you should have received this email but it has not arrived, please check your spam filters and/or contact for further assistance.

Comments on this article Comments (0)