Keywords
Blood Donation, Voluntary Donor, Sociodemographic Patterns, Nigeria, UNTH, Blood Bank Trends

Blood Donation, Voluntary Donor, Sociodemographic Patterns, Nigeria, UNTH, Blood Bank Trends
Blood is the essential fluid that keeps us alive. An estimated average adult has approximately 5 Liters of blood in the body to carry out necessary functions for survival (Peate, 2020). If you lose 40% or more of these fluids (about 2 Liters of blood) there is a serious risk for many complications such as loss of consciousness and, ultimately, death (Yore, 2024). Therefore, replacing blood by donating and receiving blood transfusions is critical to sustaining life. The fact that blood is scarce should not be forgotten and shouldn’t be wasted. Since our world’s population continues to increase; we expect to continue having an increase in medical needs which will require a large amount of blood (Hofmann et al., 2022; Roberts, James, Delaney, & Fitzmaurice, 2019). Each year, over 100 million units of blood are donated throughout the world for use in meeting these increased demands (Gasparovic Babic, Krsek, & Baticic, 2024; Organization, 2022). In the U.S. alone, there are approximately 24 million units of blood and blood products transfused each year. According to the American Red Cross, a need for blood and/or platelets exists every 2 seconds in the U.S., resulting in a daily demand for approximately 29,000 units of red blood cells and nearly 5,000 units of platelets within our population (Abdul, 2021; Skrajewski-Schuler, 2023).
In the United States and most economic powerhouses of the world (76% of blood is given to adults aged 60 years or older), there are major differences in blood transfusion trends when looking at low-economy nations. For example, in some low economic nations blood is given to children till age 5 at almost 54% and mostly for the treatment of severe anemia due to malnutrition, complications related to pregnancy and infectious diseases. In fact, this type of use for transfusions is in drastic contrast to high-income countries where transfusions are most commonly used as a type of supportive care in persons with chronic diseases, surgeries including; cardiovascular surgery, surgical transplant, massive trauma, and treatment for solid and hematological malignancies. WHO also states (in 2018) that there has been a 10.7-million donation increase from voluntary unpaid donors from 2008 to 2018 in 119 nations globally with the highest number coming from South East Asia (127%) followed by the Americas (81%) and Africa (81%) (Garcia et al., 2024). According to this analysis, Africa is lacking when it comes to providing blood to donate. In fact, Angola and the surrounding countries are struggling; for instance, in 2014, there were only 189,000 blood units collected (which is 47.25% of what was needed) for the Kenya National Blood Service. 34 out of 60 countries in Africa have less than 10 donation measurements per 1,000 people (Allain, 2019; Loua et al., 2020).
Men and women can donate blood. In addition, most individuals who are 16 years of age or beyond may donate blood. Studies show that there are disparities in blood donation behavior related to factors such as gender, age and other sociodemographic factors (Patel et al., 2019; Zucoloto et al., 2019). In general, men have been shown to donate blood more frequently than women, while the research surrounding age has been more varied (Öhrner, Kvist, Blom Wiberg, & Diedrich, 2019). There are many other sociodemographic variables that have an effect on blood donation including; education level, race, religion, and profession (Patel et al., 2019). Blood donors can be voluntary/unpaid, family replacement, and commercial (paid) (Nyakunga, 2023). Donors can also be first-time or repeat donors and/or regular donors. Donor blood can be collected at either hospitals or other facilities that perform transfusions (Jacobs et al., 2023). Blood donors can also be from a variety of different blood types. This pattern of blood donation has been documented across many studies and seems to influence the blood donation process on a global and local level (Gasparovic Babic et al., 2024). According to the WHO, 79 countries have over 90% of their blood supply from voluntary and unpaid blood donations (38 HC countries, 33 LC countries, and 8 LMC countries). Consequently, multiple nations on the African Continent are reliant on means besides voluntary/informal donations of blood, including Nigeria, with only 0.2 blood donation per 1000 members of the population each year among the 1.5 million overall needed annually according to estimates available in the 1998 WHO report (Organization, 2022).
Blood donation rates have shown disparity globally on annual distribution basis; for example, the Western Pacific Region had the highest overall donation increase (4.15 million); followed closely by Southeast Asia (3.05 million), and then Africa (1.53 million) (Oo, 2025; Organization, 2022). In addition, the blood donor index for the Ivory Coast went from 0.4 to 5.2 while its donor rate went from 0.4 to 3.4 per 1,000 inhabitants, still indicating that both of these indices were below WHO guidelines of at least 10 units of blood donors per 1,000 inhabitants required to meet the clinical demand (Jacobs et al., 2024; Roberts et al., 2019; Siransy et al., 2025). There are numerous reported causes of varying rates of blood donation among countries throughout Africa; some of these factors can be identified as being sociodemographically based while others appear not to be related to sociocultural or demographic origins. For example, while the age of the donor (greater than 30 years), their gender (male), and their level of education (more education than average) all had some effect on blood donation according a study that examined blood donors in Enugu Nigeria (Ugwu, Madu, Efobi, & Ibegbulam, 2018). It was also found in other studies that there are several other influencing factors such as; level of understanding about blood donation; any medical conditions; timing of voluntary blood donation; previously deferring due to circumstances beyond ones control; tattoos or piercings on the body of an individual; the underlying motivations for donating blood.
It can be said that sufficient studies have been done to better understand what motivates and or hinders blood donors; this has been accomplished by looking at the various sociodemographic characteristics of the donor, the patterns/trends of blood donation, and the factors that influence blood donation. These efforts will enable the development of actionable plans and policies related to blood donation in local settings, such as at UNTH. Although historically referred to as bloodletting, blood donation is used in modern medicine through phlebotomy as a method of treatment (Passoni, Poole, & Hardy, 2025). Blood donation entails the collection, testing, preparing, and storing of blood and blood products for transfusion purposes (Booth, Allard, & Robinson, 2021; Organization, 2021).
Blood has held special significance throughout history; it was a necessary part of life, but also held mystery. The Egyptians, Romans, and Greeks believed that the blood carried special healing properties, and used it for various rituals, as well as for rejuvenation (by ingesting or bathing in it), to cure ailments (David & Forshaw, 2023; Rosso, 2023). While the actual use of blood through transfusions did not begin until much later, its use before that was primarily for symbolic purposes through some form of nutritional ingestion. There was no understanding of how blood flowed through the body, nor of compatibility between different types of blood; therefore, do those who experimented with this type of procedure did so primarily out of speculation rather than by applying scientific principles. The first major advancement in blood transfusion was made by William Harvey in 1613, after he discovered the circulatory system (Schultz, 2002). By 1667, experimental transfusions of animal blood into humans were being performed by Boyle, Lower, and Denis (Yahaya, 2019). These initiatives would lead to some fatal hemolytic responses, causing massive public outcry, and countries like France and England placed total bans on blood transfusions. Because of the serious lack of comprehension about how to effectively perform blood transfusions, for over 100 years no study or research took place on this important aspect of patient care (Abdul-Aziz, Lorencatto, Stanworth, & Francis, 2018).
The first successful human-to-human blood transfusion in 1818, treating postpartum hemorrhage with it, led to a resurgence of interest in blood transfusions during the nineteenth century (Dzik, 2018). Although he faced many challenges, including clotting, Blundell’s success inspired researchers to develop more effective ways to anticoagulate or minimize the risk of a clot forming within the tube through which blood flowed during blood transfusions. Nevertheless, blood transfusion research continued to be plagued by problems, as researchers attempted to establish milk and saline as suitable substitutes for blood should other sources of blood availability become limited (Simon, McCullough, Snyder, Solheim, & Strauss, 2022). Unfortunately, milk and saline transfusions frequently caused adverse reactions and ultimately were considered ineffective blood replacement therapies. However, in 1900, Karl Landsteiner developed the ABO blood type system for human beings, providing researchers with an understanding of the cause of transfusion reactions (the body’s immune response to transfusions of incompatible blood types) (Ajmani, 2020; Noor & Asmaa, 2024). Thus establishing a foundation for the establishment of safe blood transfusion practices. In the early 20th century, there were important developments in blood storage and preservation. Sodium citrate was first developed in 1924 by Lewisohn to be used as an anti-coagulant agent, after several earlier discoveries by Weil and others which allowed for the refrigeration of blood for short periods of time (Greening, Glenister, Sparrow, & Simpson, 2010). The citrate-glucose solution by Rous and Turner (1916) made it possible for storing blood much longer than previously possible with the blood depot system established during World War I (Angermeier, 2022). Many people in the military were killed due to easily treatable illnesses with transfusions of packaged red blood cells, which resulted in the development of blood banks (Goforth, Tranberg, Boyer, & Silvestri, 2016). Further progress included the identification of the Rh factor in 1940, freeze-dried plasma, and the Cohn fractionation process for plasma protein extraction (Brinkman, McCann, & Gooch, 2022).
With the increase of voluntary donations and blood banks in the U.S. in the 1940s, transfusion medicine has developed rapidly. Organizations such as the AABB and the WHO worked together to standardize the procedures for collecting blood, processing it, and testing it. The mandatory screening of blood for transfusion-transmission diseases (e.g., HIV, hepatitis C, syphilis) was established, and regional screening programs were created in response to the emergence of infectious agents such as West Nile Virus (Cserti, 2019). Technical advancements in sterile collection systems, cryopreservation, and pathogen inactivation have enhanced the safety of blood transfusions (Cardoso, Ragan, Hartson, & Goodrich, 2023). Currently, the primary objective of transfusion medicine is to mitigate the risks of transfusion-related acute lung injury (TRALI), transfusion-associated graft-versus-host disease (TA-GVHD), and ensure that transfusions are compatible through global regulatory oversight and the availability of technology. Overall, blood transfusions are a highly regulated and life-saving practice with a long history of scientific evolution behind them (Bertola, Capellini, & Riva, 2026; Rani, Kumar, Kaur, & Krishan, 2017).
Numerous investigations have compared methods of blood donation across diverse populations, especially with regard to KAP (knowledge, attitudes, and practices) of adolescent donors (Bahumwire, 2018; Chukr et al., 2025). Many reviews have explored reasons why people do not donate, as well as how various sociodemographic attributes influence people’s willingness to donate blood. A study focused on identifying sociodemographic and behavioral traits of blood donors in America (Patel et al., 2019). These studY illustrate how to promote successful voluntary blood donation through improved understanding of individuals’ decisions to donate blood and through the implementation of successful public health initiatives. In addition, very little literature exists regarding specific patterns and trends relating to people donating blood at a more localized setting, specifically at the University of Nigeria Teaching Hospital (UNTH), Enugu. As far as we know, no comprehensive study has looked at the factors affecting blood donation at UNTH from 2022–2025. There is a crucial lack of information regarding donation behaviour change during this timeframe, particularly since the onset of the COVID-19 pandemic. In response to this void, we will examine donors’ sociodemographic characteristics and how these will influence donating behaviour at UNTH during these four years. Through the findings of our research, we hope to provide evidence for future planning as well as drive enhanced donor recruitment and improved efficiencies and reliability in blood transfusion services within the UNC Hospital setting.
The ideal situation is a stable pool of volunteer donors who support the donation of blood as a normal part of society, while also providing a consistent source of safe blood that can be used for transfusion services (Organization, 2023a). Some upper-middle-income countries and high-income countries have very close blood donation statistics to those outlined above. For example, WHO reported (data release in January 2025) that the increase in the number of blood donations was greatest within the Western Pacific Region (4.15 million donations) and second in Southeast Asia (3.05 million) (Organization, 2023b). More than half (38 out of 79, or 52.7%) of all high-income countries collect more than 90% of their blood supply from voluntary (unpaid) blood donations (Barnes et al., 2022; Organization, 2022). In order to establish a sustainable source of blood and effective methods of recruiting donors, we need clear knowledge about donor characteristics, patterns of donation, and what influences the frequency of these donations. Blood donation rates across numerous African and Nigerian hospitals, including UNTH, do not meet clinical needs and vary widely. A large number of donations are from family/replacement donors instead of voluntary non-remunerated donors. Collectively, middle- and low-income nations have 85% of the world’s countries, with donating individuals being at least 50% family/replacement and/or paid blood donors (Vrielink & Smid, 2023). There have been reports of low numbers of blood donations from many health facilities in Cameroon, Kenya, the Ivory Coast, Nigeria, and other areas throughout Africa (Dei-Adomakoh, Asamoah-Akuoko, Appiah, Yawson, & Olayemi, 2021; Zanin, Hersey, Cone, & Agrawal, 2016). Data on donor sociodemographic characteristics, donation patterns over time, and factors influencing donor behaviour are not comprehensively available or understood in the context of these locations. The knowledge gap will keep affecting the ability to efficiently plan, mobilize donors, and implement targeted strategies for enhancing blood donation practices until a plan of action is developed. Without data to support how we can maintain a consistent blood supply, the potential for putting patients who require transfusions at risk and increasing the strain on the healthcare system will also continue to exist.
The evaluation of a four years blood donation operations at the University of Nigeria Teaching Hospital (UNTH) determines key factors influencing the success of community-based blood donation campaigns. The results from the analysis of donor demographic information will allow for targeted outreach to segments of the population that are underrepresented in blood donation. In addition, the data highlights the need for ongoing educational messages regarding the significance of donating blood, which helps develop a culture of giving back to the community. Additionally, the findings serve as an example for other organizations to improve their blood donation practices and support global health initiatives. The data collected throughout the last four years will provide valuable insight into the issues related to recruiting and retaining donors. The knowledge gained from this study can be used as a reference point for other research done in other regions/countries, and the information about individuals’ reasons for donating blood could assist in developing donations programs that better meet the needs of potential donors. This analysis will provide valuable information to use in developing future blood donation strategies as part of larger donation initiatives aimed at ensuring adequate and safe blood supply globally and allowing millions of lives to be saved by using blood transfusion. The findings related to blood donation and overall donor recruitment will help further enhance the coordination and collaboration between healthcare professionals, academics, and policymakers to meet the blood donation goals on a broader level.
1. To determine the demographic characteristics of blood donors at the University of Nigeria Teaching Hospital
2. To determine the patterns of blood donation at the University of Nigeria Teaching Hospital
3. To assess the annual trend in blood donation at the University of Nigeria Teaching Hospital between 2022 and 2025
This study is retrospective in nature and was conducted over four years (2022 to 2025) using an analytical overall study design to evaluate blood donation behaviors at UNTH. In contrast to prospective studies, retrospective studies involve reviewing previously collected existing outcomes that are already available, to extract data (either directly from participants or from participant records) by reviewing years prior to the study (Talari & Goyal, 2020). The advantage of using retrospective studies is that they allow researchers to analyze previously collected data (to evaluate trends and/or relationships) without having to conduct any additional data collection; therefore, they save time and financial resources. However, retrospective studies rely on data that has been collected in a clinical database, as opposed to data that has been collected for research purposes, and where the data has not been collected using a pre-established protocol designed to meet the specific requirements of the study; thus, in virtually all cases, part of the data will be incomplete. Also, certain variables that have the potential to impact the outcome may not have been recorded at all. The researchers bore in mind these limitations while embarking on the research design.
This research took place at the blood bank located within the University of Nigeria Teaching Hospital (UNTH) located at Ituku-Ozalla, Enugu state. Enugu was one of the states in Nigeria located in the eastern geopolitical region and is bordered by Kogi and Benue to the north; Ebonyi to the east; Abia to the south; and Anambra to the west. The area is home to many ethnic groups, most notably the Igbo people, and the predominant religion is Christianity. The total population of Enugu in 2022 was approximately 4.69 million. The land area has a total area of 7,625 km2 and the population density is estimated to be 615.1/km2 from 2006–2022. The average annual growth rate is estimated to be approximately 2.3 percent. UNTH is a tertiary care provider and serves as a major source of healthcare for the region and beyond. The University of Nigeria Teaching Hospital (UNTH) is located north of the Enugu City in Ituku Ozalla village. This federal teaching hospital has approximately 576 patient beds and transfuses an average of 9000 units of blood per year. The Blood Bank Unit of the hospital is tasked with collecting, processing, screening, and distributing blood to patients who receive transfusions in the hospital or one of its affiliated transfusing facilities. Additionally, the Blood Bank at the UNTH has extensive records of blood donations and transfusions performed in the hospital; therefore, it will be a good site for this retrospective analysis.
The study population comprised all individuals who donated blood at the UNTH Blood Bank between May 2022 and July 2025.
A study’s retrospective design and the number of potential donors’ records may mean using all available data is not practicable for purposes of completing this study on-time. Additionally, since most of the data are kept as manual records rather than as digital electronic records (particularly for the UNTH blood bank), obtaining a sufficiently large sample can also be logistically impossible because they are difficult to enter into and analyze using statistical software. Therefore, a sample size necessary to represent the population and that could be feasibly collected was determined. The sample size for this study was determined using Cochran’s formula for an infinite population, which is appropriate when the population size is large or unknown (Hasan & Kumar, 2024). The formula is stated as:
Where:
• N is the sample size
• Z is the Z-score corresponding to a 95% confidence level (1.96)
• p is the estimated proportion of individuals with the characteristic of interest. In the absence of prior data, a conservative estimate of 0.5 will be used to maximize variability
• e is the desired margin of error, which will be set at 0.05 for ±5% precision
Substituting these values into the formula:
This gives an initial minimum sample size of approximately 384 medical records.
To compensate for potential non-responses or dropouts, the sample size will be adjusted by accounting for a 10% attrition rate:
Therefore, the final sample size will be rounded up to 427 medical records.
To sample donor records from the UNTH Blood Bank register, a stratified sampling method was employed. The four strata of interest were selected based on their corresponding years (2022–2025). Each of these four strata was systematically sampled using random sampling. The nth record was chosen from each stratum after selecting a random starting point, which allowed the cumulative sample to be representative of the entire population. The total number of eligible donors in the blood bank for each strata is held in the blood bank’s records. The cumulative sample of 427 samples has been proportionality distributed to the year 2022, 2023, 2024, and 2025 based upon the cumulative number of donors recorded in each year.
For each year, the sampling interval (k) was determined by dividing the total number of donors by the number allocated to that year. A random starting point between 1 and k was selected, after which every kth donor on the list was included in the study. This approach ensured both proportional representation and randomization in the selection process.42
For example, in 2022 with 4,856 donors and a sample allocation of 161:
K will be determined as follows:
11 which was a random number between 1 and 30 was selected as the starting point. The 11th donor on the list was the first participant, followed by the 41st (11 + 30), 71st (41 + 30), and so on, until 161 participants were selected for 2022.
All blood donors whose records are available in the UNTH Blood Bank that register within the specified period. And entries with complete data on sociodemographic characteristics and donation details.
Donor records with incomplete or missing essential information (age, sex, donation date). And records that are illegible or duplicated.
Data was extracted from the UNTH Blood Bank register using a structured data extraction form. The only data we were able to capture include are the sociodemographic characteristics of donors (age, sex, residence), and the donation details (blood groups, donation to wards, voluntary donation, and donation date). We extracted the data ourselves after we presented our ethical clearance and were given access to the records.
Data were entered and cleaned using Microsoft Excel and exported to SPSS (version 27) for statistical analysis. Descriptive statistics were used to summarize donor sociodemographic characteristics and donation patterns. Patterns were visualized with a frequency table and charts. Trends over the 4 years were assessed using line graphs. The associations between sociodemographic factors and donation practice and trends were analyzed using the chi-square test. Finally, statistical significance was set at p < 0.05.
Table 1 shows the data from 427 medical records were drawn from a pool of 12,911 records between 2022 and 2025, representing 3.3% of the actual data. This will have to be borne in mind in interpreting the data presented. All selected data had complete details for all variables used in the research work: Age, Sex, Residence, Blood Group, Ward, Year, and Month.
| Year (Stratum) | Donors | Proportional Sample Allocation |
|---|---|---|
| 2022 | 4856 | (4,856/12,911) × 427 ≈ 161 |
| 2023 | 3181 | (3,181/12,911) × 427 ≈ 105 |
| 2024 | 2907 | (2,907/12,911) × 427 ≈ 96 |
| 2025 | 1967 | (1,967/12,911) × 427 ≈ 65 |
| Total | 12911 | 427 |
Research Question One. What are the demographic characteristics of blood donors at the University of Nigeria Teaching Hospital (UNTH)?
To determine the demographic characteristics of blood donors at the University of Nigeria Teaching Hospital.
Table 2 shows the descriptive statistics of donors’ ages over the 4 years. The mean age was 27.7 years, with a standard deviation of 7.25, indicating a relatively young donor population with moderate age variability. The most frequently occurring age was 22, while donor ages ranged from 18 to 56 years. This suggests that blood donation in the hospital was predominantly carried out by young adults.
| Age (Years) Descriptive Statistics | |
|---|---|
| Mean | 27.67 |
| Mode | 22 |
| Std. Deviation | 7.25 |
| Range | 38 |
| Minimum | 18 |
| Maximum | 56 |
Figure 1 illustrates the age distribution of blood donors. Donors aged 41 years and above accounted for the highest proportion at 64%, followed by those aged 21–30 years (18%) and 20 years and below (11.2%). Only 7.3% of donors were aged 31–40 years. This pattern indicates that adults in their Fourties formed the majority of the donor population during the study period.
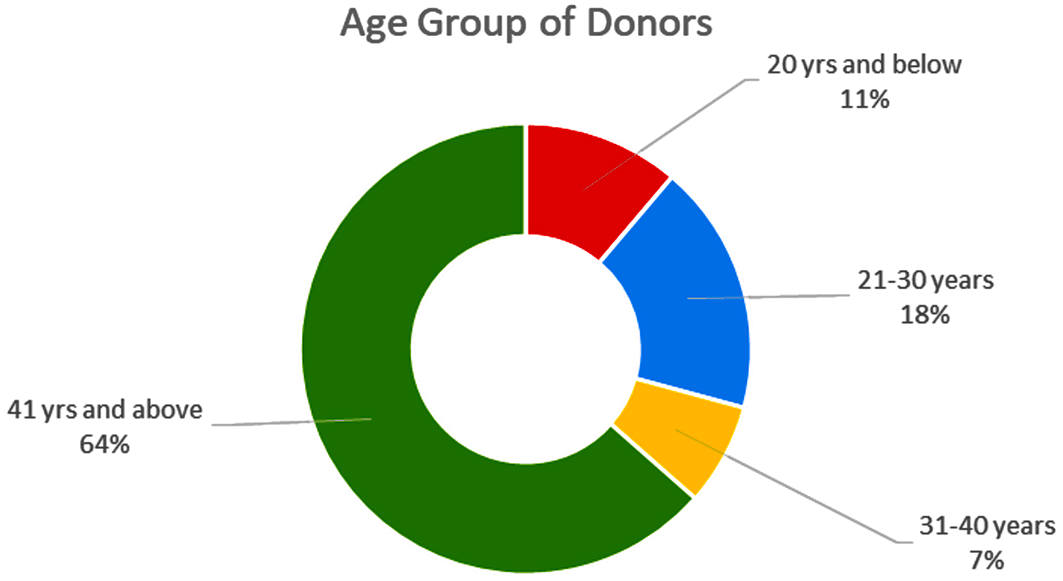
Figure 2 reveals the gender distribution of blood donors. Males comprised the vast majority, accounting for 89.9% of all donations, while females represented only 10.1%. This highlights a significant gender disparity, with males being the predominant donors in the hospital over the 4-year period.
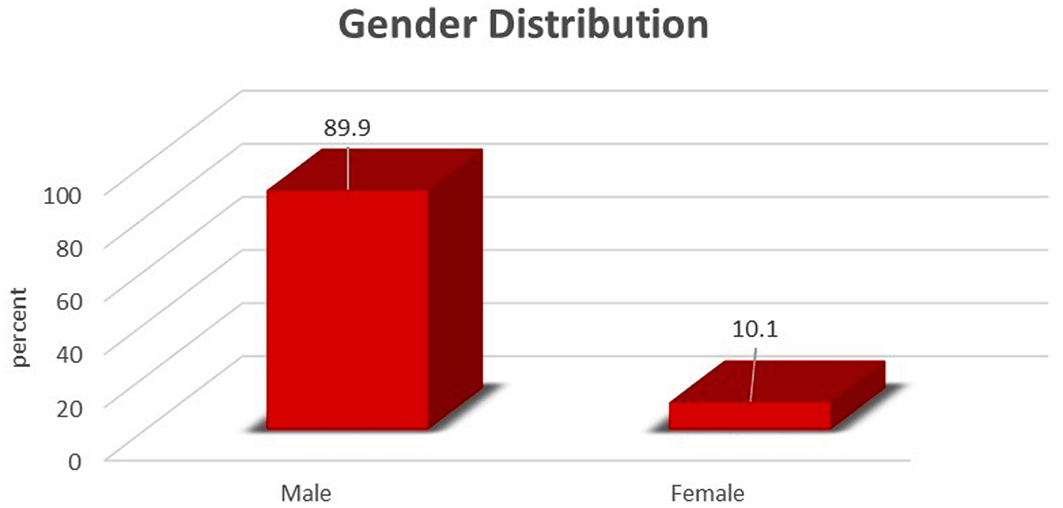
Figure 3 highlights the residential distribution of blood donors. The majority (73.5%) resided in other parts of Enugu State outside Ozalla, followed by donors from the Ozalla community (19.4%). A smaller proportion came from other Southeast states (4.4%) and non-Southeast regions (2.6%). This indicates that blood donation was largely driven by individuals living within the hospital’s immediate catchment area.
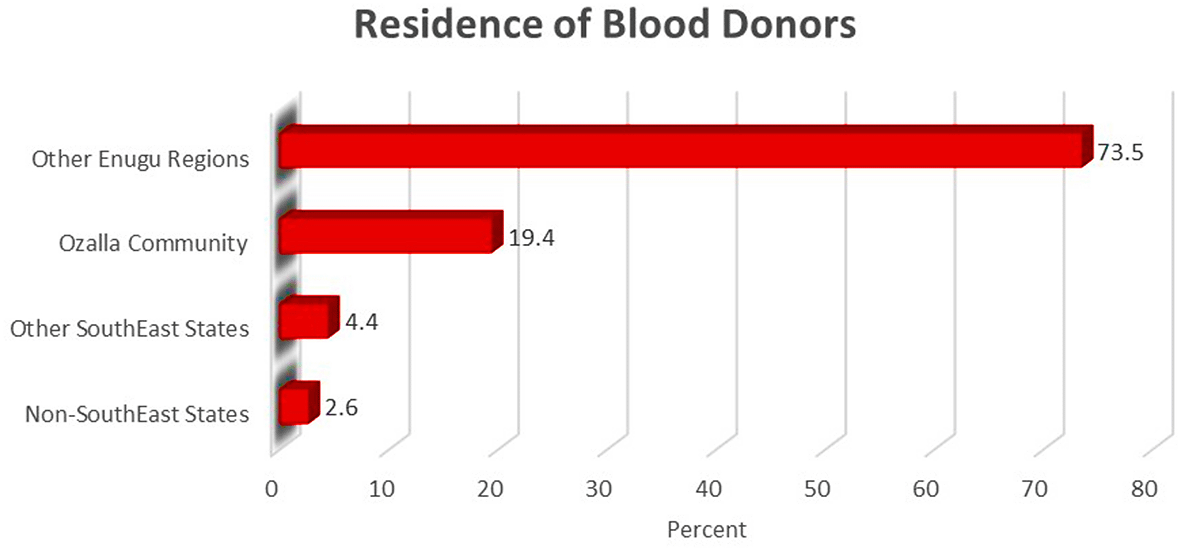
Table 3 shows that most blood donors were aged 21–30 years, comprising 62.2% of males and 74.4% of females. Donors aged ≤20 years, 31–40 years, and ≥41 years were fewer across both sexes, indicating that young adults dominated the donor pool.
| Variable | Categories | Male n (%) | Female n (%) |
|---|---|---|---|
| Age (Years) | ≤ 20 | 45 (11.7) | 3 (7.0) |
| 21–30 | 239 (62.2) | 32 (74.4) | |
| 31–40 | 71 (18.5) | 6 (14.0) | |
| ≥ 41 | 29 (7.6) | 2 (4.7) |
Table 4 shows the distribution of sex across the residences of blood donors. The majority of both males (74.0%) and females (69.8%) resided in other Enugu regions, followed by the Ozalla community. Only small proportions came from other Southeast or non-Southeast states.
| Variable | Categories | Male n (%) | Female n (%) |
|---|---|---|---|
| Residence | Ozalla Community | 72 (18.8) | 11 (25.6) |
| Other Enugu Regions | 284 (74.0) | 30 (69.8) | |
| Other South East States | 17 (4.4) | 2 (4.7) | |
| Non-South East States | 11 (2.9) | 0 (0.0) |
Table 5 shows the distribution of age across the residences of blood donors. Most donors in all age groups lived in other Enugu regions, followed by the Ozalla community. Only a few donors were from other Southeast or non-Southeast states.
Research Question Two. What are the patterns of blood donation at UNTH?
To determine the patterns of blood donation at the University of Nigeria Teaching Hospital.
Figure 4 shows the distribution of blood group patterns among 427 respondents. The most common blood group was O+, accounting for 61.8% of participants, followed by A+ (18.7%), and B+ (13.3%). Less common types included O- (4.0%), A- (1.2%), B- (0.5%), and AB+ (0.5%).
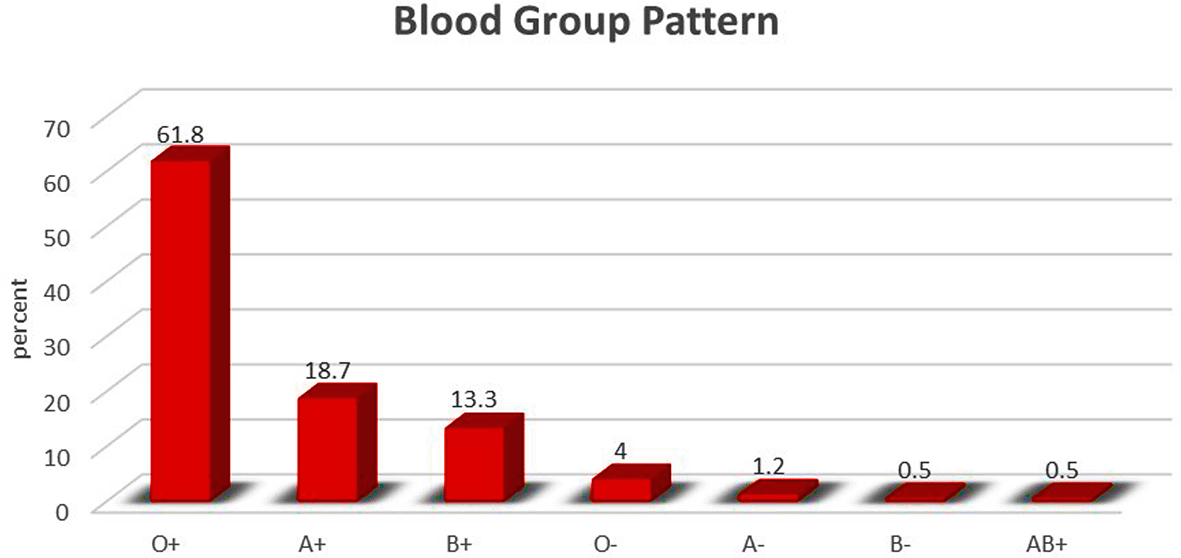
Figure 5 highlights the top 10 hospital wards with the highest demand for blood in the institution. The Accident and Emergency (A&E) ward had the highest demand, accounting for 32.3% of requests. This was followed by Oncology/XRT (10.3%), Obstetrics and Gynaecology/SCW (8.7%), and Male Surgical (6.3%). Other wards with notable demand included Paediatric Medicine (5.4%), Female Surgical (5.2%), Male Medical (3.5%), Female Medical (3.0%), ANC (2.8%), and Paediatric Surgery (2.6%). The remaining 13.1% were from other wards put together.
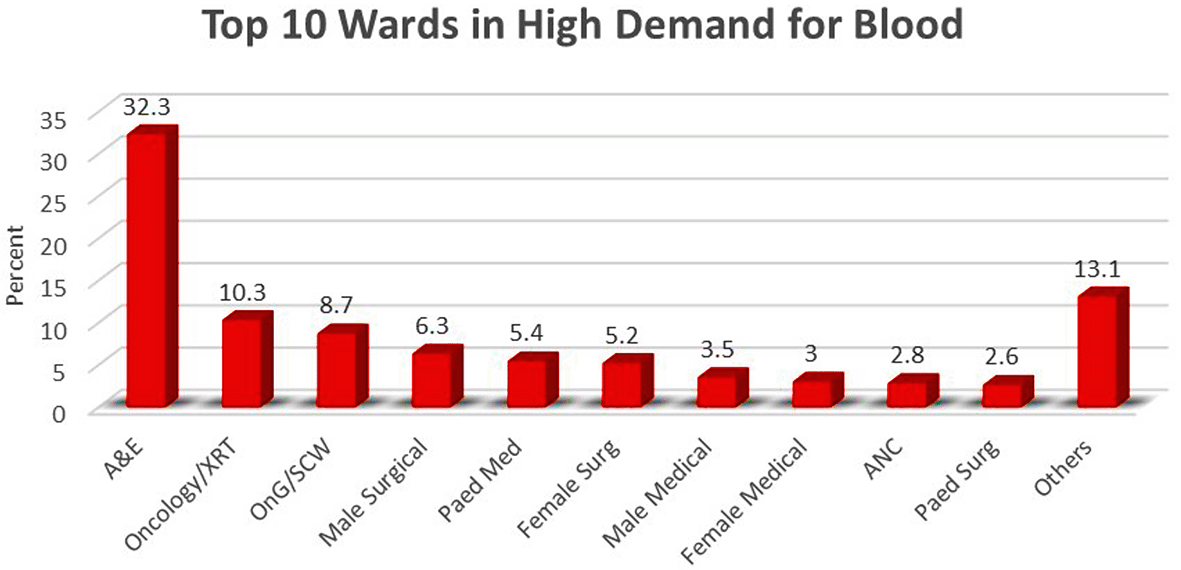
Table 6 presents the distribution of age across blood group patterns among donors. Blood group O+ was the most common across all age groups, with the highest numbers seen in the 21–30 years category (162 donors). This was followed by A+ and B+, which were also more frequent in younger donors. The rarer groups (O−, A−, B−, and AB+) appeared in much smaller proportions across all age categories, with AB+ recorded only in the 21–30 and 31–40 years groups. Overall, younger adults not only dominated the donor pool but also showed the widest spread across different blood groups.
| Variable | Categories | O+ | O− | A+ | A− | B+ | B− | AB+ |
|---|---|---|---|---|---|---|---|---|
| Age (Years) | ≤ 20 | 30 | 1 | 8 | 1 | 8 | 0 | 0 |
| 21–30 | 162 | 11 | 54 | 3 | 39 | 1 | 1 | |
| 31–40 | 47 | 4 | 16 | 0 | 8 | 1 | 1 | |
| ≥ 41 | 25 | 1 | 2 | 1 | 2 | 0 | 0 |
Table 7 shows that O+ was the most common blood group in both sexes, followed by A+ and B+, which were more frequent among males. The rarer groups (O−, A−, B−, AB+) appeared in very small numbers, with some absent among females.
| Variable | Categories | O+ | O− | A+ | A− | B+ | B− | AB+ |
|---|---|---|---|---|---|---|---|---|
| Sex | Male | 236 | 16 | 70 | 5 | 54 | 2 | 1 |
| Female | 28 | 1 | 10 | 0 | 3 | 0 | 1 |
Table 8 summarizes the pattern of free blood donation among 29 individuals across the years 2022–2025. Most donors were male (82.8%) and aged 21–30 years (65.5%). The majority resided in other Enugu regions (65.5%), followed by the Ozalla community (24.1%).
| Variable | F | % | |
|---|---|---|---|
| Age | <= 20 | 1 | 3.4 |
| 21–30 | 19 | 65.5 | |
| 31–40 | 4 | 13.8 | |
| > = 41 | 5 | 17.2 | |
| Sex | Male | 24 | 82.8 |
| Female | 5 | 17.2 | |
| Residence | Ozalla Community | 7 | 24.1 |
| Other Enugu Regions | 19 | 65.5 | |
| Other South East States | 2 | 6.9 | |
| Non-South East States | 1 | 3.4 |
Research Questions Three. What has been the annual trend in blood donation at UNTH between 2022 and 2025?
To assess the annual trend in blood donation at the University of Nigeria Teaching Hospital between 2022 and 2025.
Figure 6 illustrates the annual trend of blood donation from 2022 to 2025, with a total of 427 donations recorded. The highest number was in 2022 (161 donations; 37.7%), followed by 2023 (105; 24.6%), 2024 (96; 22.5%), and the lowest in 2025 (65; 15.2%), indicating a gradual decline over the years.
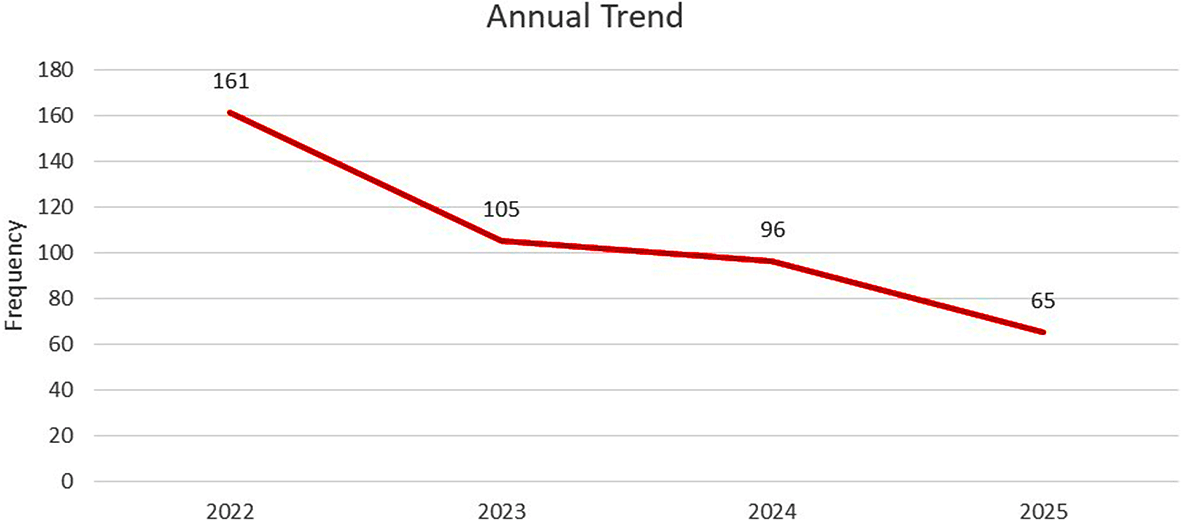
Figure 7 shows the monthly trend of blood donation from January to December across 2022 to 2025, totaling 427 donations. The peak month was July with 84 donations (19.7%), followed by June (46; 10.8%) and August (45; 10.5%). The lowest was in December (18; 4.2%), with relatively lower activity also in September (5.6%) and April (5.9%).

Figure 8 presents the annual trend of free blood donations from 2022 to 2025, with a total of 29 donations. The highest occurred in 2022 (10 donations; 34.5%), followed by 2024 (9; 31.0%), and 2025 (8; 27.6%), while 2023 recorded the lowest with only 2 donations (6.9%).
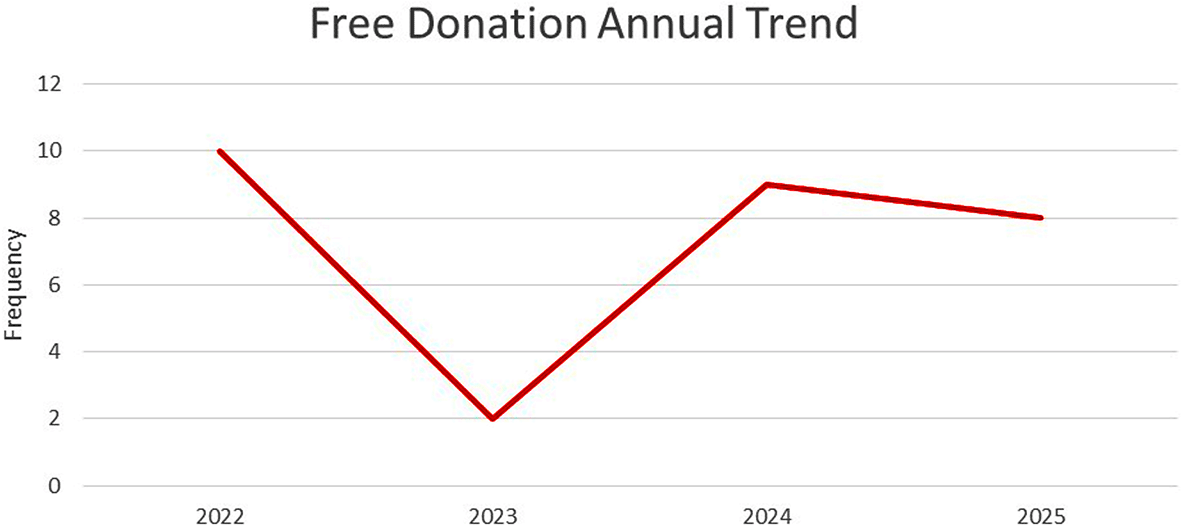
Figure 9 illustrates the annual trend of blood donation by age group from 2022 to 2025. Across the years, the 21–30 age group consistently had the highest number of donations, contributing 271 out of 427 total donations (63.5%). This was followed by the 31–40 age group (77; 18.0%), ≤20 (48; 11.2%), and ≥ 41 (31; 7.3%). The year 2022 recorded the highest overall donations across all age groups.
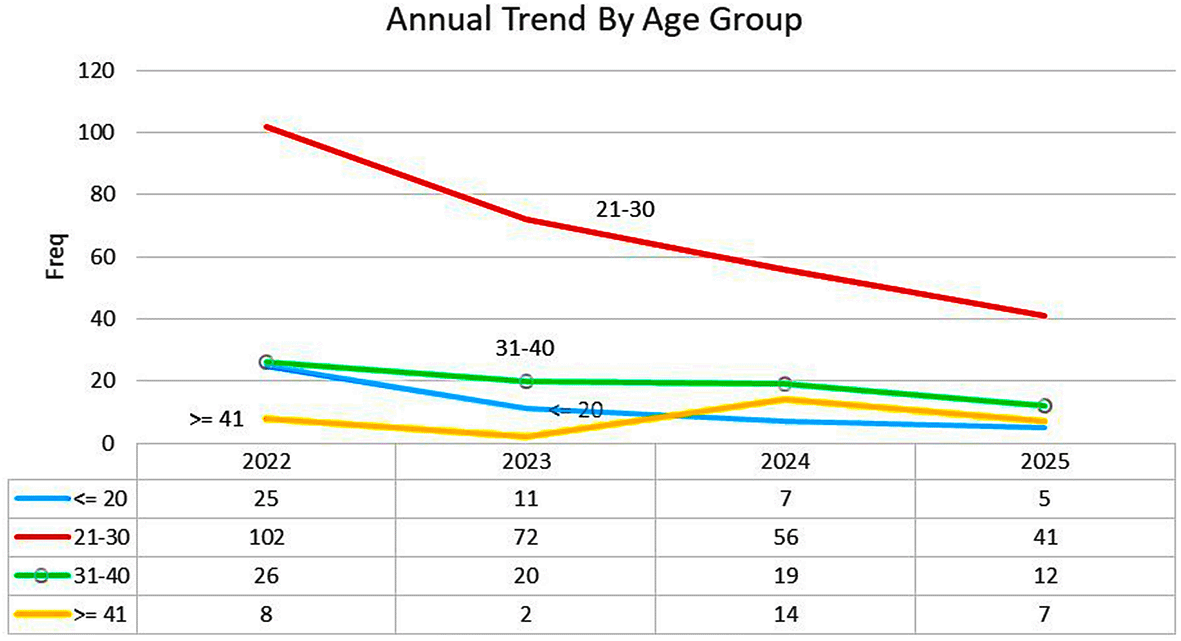
Figure 10 displays the annual trend of blood donation by sex from 2022 to 2025. Out of 427 total donations, males consistently dominated each year, contributing 384 donations (89.9%), while females contributed only 43 (10.1%). The highest male and female donations were recorded in 2022, with 140 and 21 donations respectively.
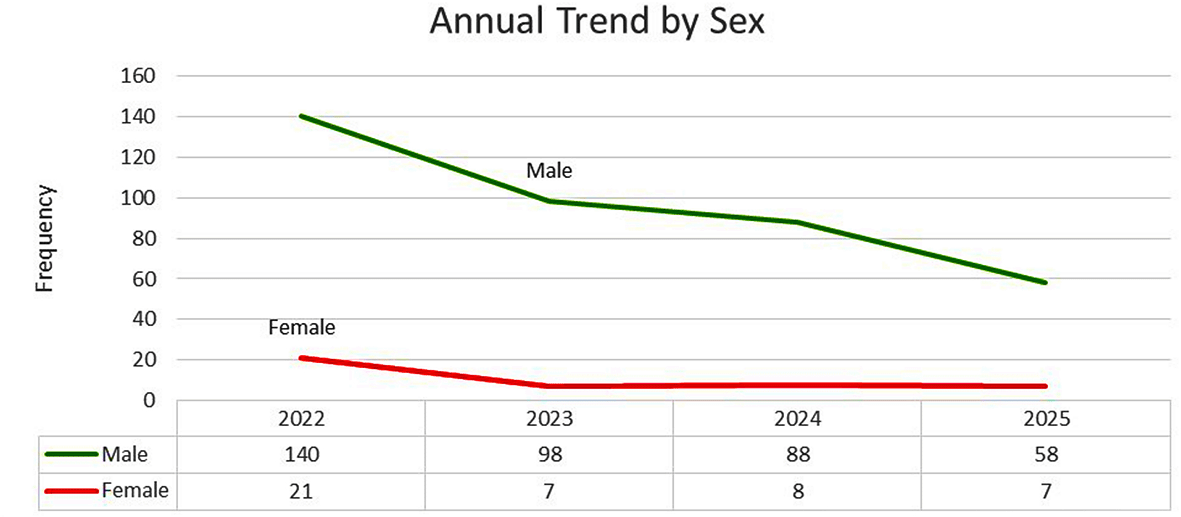
Figure 11 shows the annual distribution of blood donations by place of residence from 2022 to 2025. The majority of donors were from other Enugu regions, contributing 314 out of 427 donations (73.5%). This was followed by donors from the Ozalla community (83; 19.4%), other South-East states (19; 4.4%), and non–South-East states (11; 2.6%). The highest number of donations across all residence categories occurred in 2022.
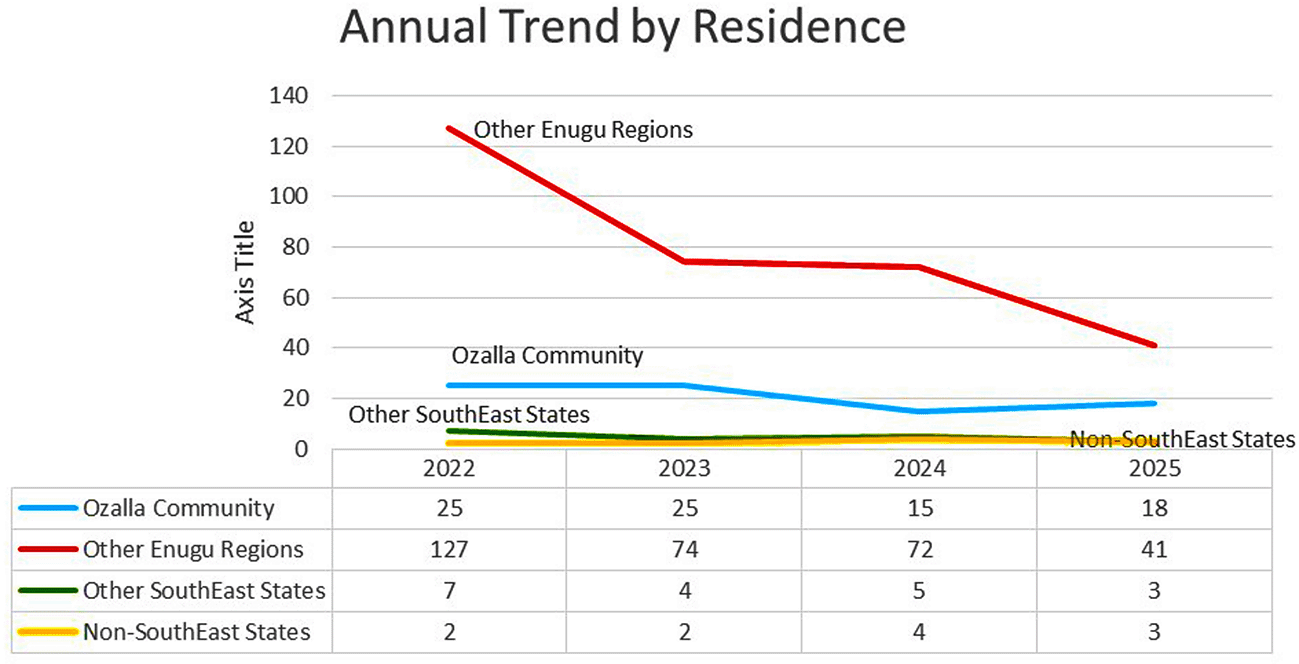
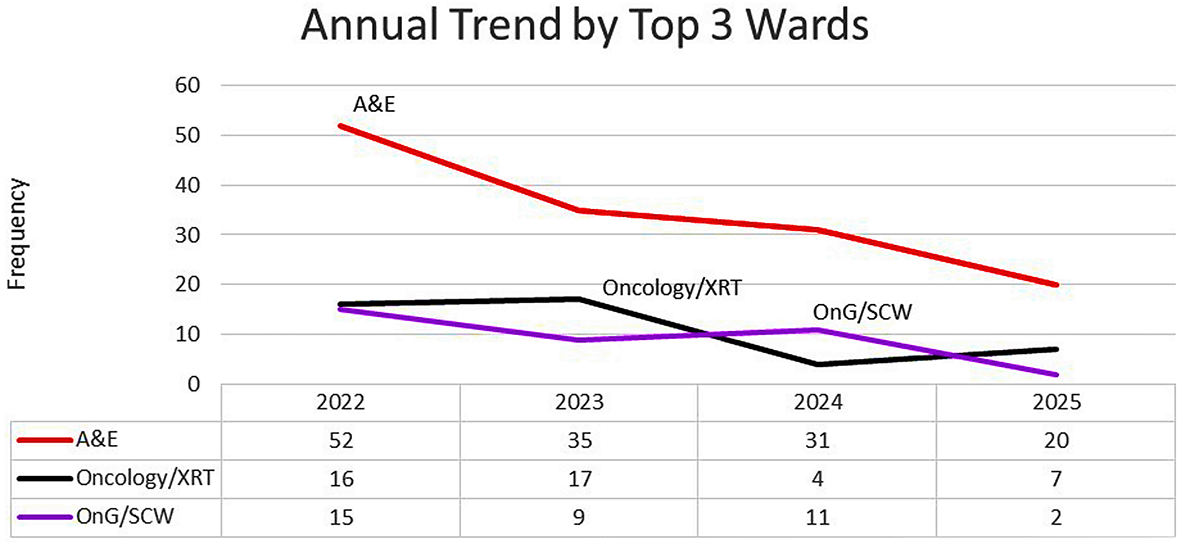
Figure 12 presents the annual trend of blood demand from the top three wards between 2022 and 2025. The Accident and Emergency (A&E) ward consistently had the highest demand, totaling 138 requests, followed by Oncology/XRT (44) and Obstetrics and Gynaecology & Sickle Cell Ward (37). Demand peaked in 2022, particularly for A&E, and declined across all three wards by 2025.
This study found that most of the blood donors were young people. The average age was 27.7 years, and more than half (63.5%) were between 21 and 30 years old. This is similar to study that found that most donors (74.3%) were aged 18–23(Aljohani, 2024). Another study also reported that most of the donors (50.7%) were aged 20–29 (Goldman et al., 2017), Additionally, a mean age and standard deviation report of 28.8 ± 8.5 (range: 19–56 years) very closely aligns with our data (Heddle et al., 2019). These results suggest that blood donation is mostly done by young adults, possibly because they are healthier and more likely to take part in health campaigns, especially in schools and universities. In the United States, a study also reported that young adults (18–24 years) donated the most, but older people were also represented (Patel et al., 2019). In contrast, a study found that in Brazil, most donors were over 30 years old (Santos et al., 2024). This difference may be due to differences in health systems, awareness levels, and how people are encouraged to donate in different countries. We also found a big difference between male and female donors. Almost 90% of the donors were male, which is even more than (85.7%) (Bartonjo & Oundo, 2019). Women may donate less due to fear of weakness, menstruation, or other health concerns. Even though more men donated, our data showed no significant difference in age group between males and females (p = 0.463). Most of the donors in our study lived in Enugu State, especially outside Ozalla. Interestingly, we found that age and place of residence were linked (p = 0.003), suggesting that where a person lives might affect their age and willingness to donate, possibly due to access to the hospital or awareness efforts in those areas. In general, our results are similar to earlier studies but also show some local differences that can help improve blood donor campaigns.
This study found that the most common blood group among donors was O-positive (61.8%), followed by A-positive (18.7%) and B-positive (13.3%). This pattern matches findings from a study that reported that 58.8% of donors at UNTH had O Rh-positive blood (Ugwu et al., 2018). Similarly, a study carried out in Brazil found O-positive to be the most frequent blood group (37.5%), although their proportion was lower than in our setting (da Silva Santos et al., 2024). These consistent findings suggest that blood group O-positive is the most widely distributed, which is helpful for transfusion services due to its compatibility with many recipients. We also looked at where blood was most needed. The Accident and Emergency ward had the highest demand (32.3%), followed by the Oncology and Obstetrics wards. This mirrors a study that found that most blood requests came from emergency units (51.5%) (Okocha, Ogbenna, Ezeama, Aneke, & Ezeh, 2019). It makes sense that emergencies and critical care areas would use the most blood due to trauma, surgeries, and urgent medical needs. When we looked at free or voluntary donations, we found that only 29 people donated without replacement; most were male (82.8%), aged 21–30 (65.5%), and lived in other parts of Enugu State. This number is quite low, showing that voluntary donations are still limited in our setting. Similar low rates were seen in India by a study where only 4.3% of donors were voluntary (Shrivastava, Agrawal, Das, & Mishra, 2024), and in Cameroon by a study found that voluntary donors made up just 1.6% (Gesu Ngunyi et al., 2025). Family/replacement donors still dominate in many places, including studies (Asamoah-Akuoko, 2018). These results show that while blood group patterns are consistent with other studies, the rate of voluntary donation is still low. There is a need to promote voluntary blood donation more actively through awareness, campaigns, and donor incentives.
The pattern of blood donations at our study center between 2022 and 2025 shows a gradual decline over the four-year period. The year 2022 recorded the highest number of donations (37.7%), while the lowest occurred in 2025 (15.2%). This downward trend may reflect broader changes in donor behavior, institutional outreach, or even external factors such as economic pressures or health system disruptions. Our findings differ from the report of a study which found that blood donation rates in the U.S. remained steady at around 6% from 1999 to 2015 (Ellingson et al., 2017). In contrast, our study saw a notable drop in donation activity over just four years. A temporary dip in blood donation figures has also been linked to major public health disruptions, especially during the COVID-19 pandemic. A study reported sharp declines in blood donation during 2020, attributing this to pandemic-related interruptions (Jaffe, Sonkin, Strugo, & Zerath, 2021). Specifically, a study noted a 17.1% reduction in donations and a 21.7% drop in transfusions in Nigerian hospitals between January and July 2020 compared to the same period in 2019 (Oreh et al., 2022). While our dataset begins in 2022, the post-pandemic peak, the lingering effects of COVID-19 might still have contributed to the steady decline observed up to 2025. Monthly donation trends further show July as the peak donation month across all years (19.7%), followed by June (10.8%) and August (10.5%). This mid-year surge could reflect seasonal factors, student availability, or targeted blood drive campaigns. Similar seasonal peaks were not emphasized in the literature although a study stated a 17.1% decline in the number of blood donations and a 21.7% decline in blood transfusions observed over the study period, with the most significant drop occurring in April 2020 (44.3% for both 2019 and 2020) (Oreh et al., 2022). Free donations remained few, totaling just 29 in four years, with the highest number (10) occurring in 2022. The majority of these came from the 21–30 age group, which also dominated the overall donor pool. This supports the finding that younger adults continue to form the core of the active donor base, even though replacement donors far outnumber voluntary ones in many settings (Miszkiel & Gaffiero, 2026). Finally, the Accident and Emergency (A&E) ward had the highest blood demand every year, followed by Oncology/XRT and Obstetrics and Gynaecology. These patterns echo the observations made by a sttudy where emergency departments were top consumers of donated blood (Okocha et al., 2019). The consistent demand from A&E highlights the need for maintaining a stable blood supply year-round to support life-saving interventions.
Overall, the findings suggest that sociodemographic factors such as age, sex, and residential location play key roles in shaping donation patterns. These results support earlier recommendations to intensify community-targeted education and to dispel donation myths, especially among underrepresented groups like women and rural dwellers.
The findings of this study reveal that blood donation at UNTH is largely driven by young adult males, especially those residing within Enugu State. Blood group O-positive donors were the most common, and demand was highest in critical care wards like A&E. Despite the need, voluntary blood donation remained low, and the total number of donations declined steadily from 2022 to 2025. Although awareness may be relatively high among urban and young populations, the reliance on family/replacement donations and the underrepresentation of women and older adults highlight systemic and sociocultural gaps. These findings underscore the importance of targeted strategies to expand donor pools, increase voluntary donations, and ensure year-round blood supply stability. Based on the statistical analysis, the null hypothesis was rejected, as there was a statistically significant association between age and residence (p < 0.05). This indicates that donor age distribution varied meaningfully across different residence categories, suggesting that residence may influence the age profile of donors. The rejection of the null hypothesis implies that the observed relationship was unlikely to have occurred by chance, thereby supporting the alternative hypothesis.
To government and health authorities, a one-time donations of blood through partnerships with schools, churches and community groups should be encouraging to create regular and visible blood donation drives targeted at young people and women. Also, improve access and awareness by funding education campaigns aimed at educating donors on blood donation, especially in rural areas and to women, including addressing myths and cultural barriers to donations, while publicizing the safety of donating blood. By building four donor support services; (Develop programs to recognize and thank donors, such as ‘thank you’ programs, certificates, and small incentives for repeat donors/voluntary; Move from hard copy to soft copy on blood product records at the hospital blood bank and help facilitate the use of electronic donor tracking to improve data quality and help with planning, and provide support for research; Provide opportunities for students and staff to participate in blood donation drives at the university and participate in the education of blood donation during student orientation and during health awareness week at the university; Track and forecast blood demand by using blood demand data from hospitals’ major critical areas (e.g. A&E/Obstetrics) to help track and forecast blood demand and to ensure that blood supply is available to meet periods of high blood demand/transfusion). The researchers recommend that teaching hospitals implement programs that promote blood donations in their communities, provide educational opportunities for blood donation recipients, and conduct mobile blood drives in order to serve underrepresented populations; create a robust and effective donor recruitment system that involves establishing and maintaining contact with existing donors through appointment scheduling, sending donor reminder text messages, and providing regular health checks for repeat donors; and provide training for blood bank staff in effective communication with donors, emphasizing effective counseling for prospective donors who exhibit uncertainty or doubt (particularly women and first-time donors) through culture-sensitive practices. To potential blood donors, the public and possible partners should encourage a culture of voluntary donation by encouraging people of all ages to voluntarily donate blood without waiting for an emergency situation or to help a family member who is in need. Educating peers and community members about the safe and successful nature of blood donation will provide the opportunity to dispel many myths and misperceptions that may damage one’s willingness to donate blood; that is fear of donating blood because of a fear of developing complications such as weakness, infertility. If an individual finds themselves eligible to donate blood as a healthy young adult, they should make blood donation a consistent act of kindness/compassion, to save lives and help build a healthy community healthcare network.
Some limitations of this study include: the data was collected retrospectively; this resulted in inaccuracies because the data were only as good as the original records, which were often incomplete or not consistently documented; using paper records to extract the data meant there was greater risk of transcription errors and difficulty with illegible entries; researchers were also hindered by having to sort through large, often damaged records; researchers did not attempt to gain a better understanding of the motivations or attitudes surrounding volunteering by conducting interviews or distributing surveys; and the study has a limited sample size. Additionally, this single-site study may or may not represent other regions/institutions. Finally, although this study spanned four years, the residual impact of the COVID-19 pandemic could confound any observed trends in blood donation behavior over time.
More research could examine how educational programs could enhance donation retention rates. A study that looks into psychological factors for donation would be another beneficial area for investment. Further studies could also examine how social media aids in raising awareness about blood donations. A comparative study of other hospitals’ donation processes will provide useful benchmarks for UNTH. Researching the long-term health benefits of regular donation on the donors may also be an area worth considering. Understanding and improving blood donation practices through a comprehensive approach will benefit the donor as well as the health care system.
Ethical clearance was obtained from the Research and Ethics Committee of the University of Nigeria Teaching Hospital (UNTH). The research was approved on 17/06/2025 with the Ref No. UNTH/HREC/2025/06/4034. Since the study involved retrospective review of existing records, no direct contact with participants was made, but all data were handled with strict confidentiality. Records were anonymized and securely stored. In addition, information gathered from this research was not used for any other purpose aside to increase the body of knowledge on the subject matter of the research and possibly to enable policy formulation that will further improve blood availability and safety in Nigeria. Permission to access the blood bank records was obtained from the hospital authorities prior to data collection. The records obtained were treated with utmost confidentiality.
| Views | Downloads | |
|---|---|---|
| F1000Research | - | - |
|
PubMed Central
Data from PMC are received and updated monthly.
|
- | - |
Provide sufficient details of any financial or non-financial competing interests to enable users to assess whether your comments might lead a reasonable person to question your impartiality. Consider the following examples, but note that this is not an exhaustive list:
Sign up for content alerts and receive a weekly or monthly email with all newly published articles
Already registered? Sign in
The email address should be the one you originally registered with F1000.
You registered with F1000 via Google, so we cannot reset your password.
To sign in, please click here.
If you still need help with your Google account password, please click here.
You registered with F1000 via Facebook, so we cannot reset your password.
To sign in, please click here.
If you still need help with your Facebook account password, please click here.
If your email address is registered with us, we will email you instructions to reset your password.
If you think you should have received this email but it has not arrived, please check your spam filters and/or contact for further assistance.

Comments on this article Comments (0)