Introduction
Definition and significance of preterm birth
Preterm birth (PTB), defined as birth prior to 37 completed weeks’ gestation, is a major public health problem that affects more than 10% of all births worldwide1,2. Globally, an estimated 15 million babies are born premature each year1,2. Despite substantial public health efforts over the past several decades, the U.S. PTB rate remained at 11.72% in 20113,4.
PTB is the leading cause of neonatal mortality in non-anomalous newborns1,3,5,6. It is also associated with a broad spectrum of lifelong morbidity in surviving preterm infants, including neuro-developmental delay, cerebral palsy, blindness, deafness, and chronic lung disease7–9.
Definition of spontaneous preterm birth
Some PTBs are iatrogenic and can be attributed to obstetric intervention aimed at reducing maternal and/or fetal risk. The remaining PTBs are known as spontaneous PTB (SPTB) and are the focus of research efforts to identify genetic and environmental risk factors. Although SPTB is a pressing health issue, the incomplete understanding of its biology has inhibited development of effective prevention and treatment strategies.
Genetics of spontaneous preterm birth
The etiology of SPTB is complex and multifactorial9–12, although genetic factors are important contributors9–14. In addition, PTB prevalence varies among different population groups15–19. African-American ancestry is consistently associated with an increased PTB risk, even after adjusting for epidemiologic risk factors, such as income, education, lack of prenatal care, and other socioeconomic factors10,20,21.
A candidate gene approach has identified polymorphisms in genes that encode the progesterone receptor, tumor necrosis factor alpha, interleukins 4, 6, and 10, and mannose-binding lectin22–33, that are mildly to modestly associated with SPTB. However, results have been inconsistent29,34–36.
Our genome-wide approach for spontaneous preterm birth
Here, we employed an unbiased, genome-wide approach to search for possible candidate genes associated with SPTB. Genome-wide association studies (GWAS), or whole genome association studies, are a commonly used genetic approach to study a disease or a trait. GWAS compares thousands or even millions of common genetic markers, mainly single nucleotide polymorphisms (SNPs), across individuals with a disease or trait status. There are 1,688 publications identifying 11,299 SNPs that are significant for diseases or traits in 17 different categories37,38. We obtained the SPTB phenotype and genotype data deposited in the National Center for Biotechnology Information (NCBI) Genotypes and Phenotypes Database (dbGaP)39,40, study accession phs000103.v1.p1, to perform a GWAS to explore genetic variants associated with SPTB.
Materials and methods
Data application and approval
We applied to and received approval from dbGaP39,40 for access to a dataset for SPTB phenotype and genotype (study accession phs000103.v1.p1). We followed the Data Use Certification Agreement we signed during the application.
To access the data, one must apply and agree to the dbGAP terms of usage. A detailed instructions and procedures for application can be obtained at https://dbgap.ncbi.nlm.nih.gov/.
Data content
This dataset contains participants collected by the Danish National Birth Cohort (DNBC)41. DNBC is a prospective cohort that enrolled more than 100,000 pregnant women in the first trimester, before most adverse outcomes occurred, and therefore is free from sampling or collection bias. In this dataset, there are approximately 1000 preterm births and 1000 term births as controls. These study subjects were collected from 1997 to 2003. All are singleton gestations. Each birth has records of mother-child pairs. With the exception of 24 children with one or two grandparents from other Nordic countries, all other children in the dataset had parents and all four grandparents born in Denmark.
The case (preterm) group contains births delivered before 37 gestational weeks. The control (term) group contains births delivered at approximately 40 weeks’ gestation. In both preterm and term groups, children born with any recognized congenital or genetic abnormality were excluded. Pregnancies with maternal conditions known to be associated with PTB, iatrogenic or spontaneous (placenta previa, placental abruption, hydramnios, isoimmunization, placental insufficiency, pre-eclampsia/eclampsia), were also excluded by DNBC.
The blood sample (buffy coat) was collected for each mother-child pair. Their whole genomes were genotyped on the Illumina Human660W-Quad_v1_A platform (Illumina, Inc., San Diego, California, USA), which contains more than 500,000 markers. Genotyping was performed by the Johns Hopkins University Center for Inherited Disease Research (Baltimore, Maryland, USA). Further data cleaning and harmonization were done at the GENEVA Coordinating Center at the University of Washington (Seattle, Washington, USA).
Quality control
In this study, we focused only on fetal genomes for further analysis. Individuals with missing genotypes greater than 3% were filtered out. In addition, individuals with a heterozygosity rate deviating more than 3 standard deviations were also excluded from further analysis42. After per-individual quality control, we also performed per-SNP filtering. The SNPs that had missing genotypes greater than 3% were excluded42. Those having significantly different genotype missing rate between the case and control groups were also eliminated. A conservative cut-off with p < 1×10⁻⁵ was applied42. We also excluded SNPs that significantly deviated from Hardy-Weinberg equilibrium in the control group – those with p < 1×10⁻⁵ were filtered out42,43.
Data analysis
After data quality control, we performed GWAS for the fetal genomes on 22 autosomal chromosomes using the PLINK software package v1.0744 (http://pngu.mgh.harvard.edu/purcell/plink/). The level of genome-wide significance was set at 9.18×10⁻⁸, corresponding to Bonferroni correction for 544,675 multiple independent tests.
Quantile-quantile (QQ) plot was made using STATA Statistical Software, Release 1245. Manhattan plots were generated using Haploview46.
Results
Data overview
We started with a dataset comprised of 1,900 children. There were 31 children having a missing genotype rate greater than 3%. The average heterozygosity was 0.3238, with standard deviation of 0.0059. There were also 31 children having heterozygosity that deviated more than 3 standard deviations. In fact, there was considerable overlap when applying these two filtering criteria (Figure 1) - 26 individuals were identified by both exclusion criteria. During per-individual quality control, a total of 36 individuals were excluded, resulting in 1864 individuals. However, 66 of them had a missing phenotype, yielding a final total of 849 cases and 949 controls (Table 1).
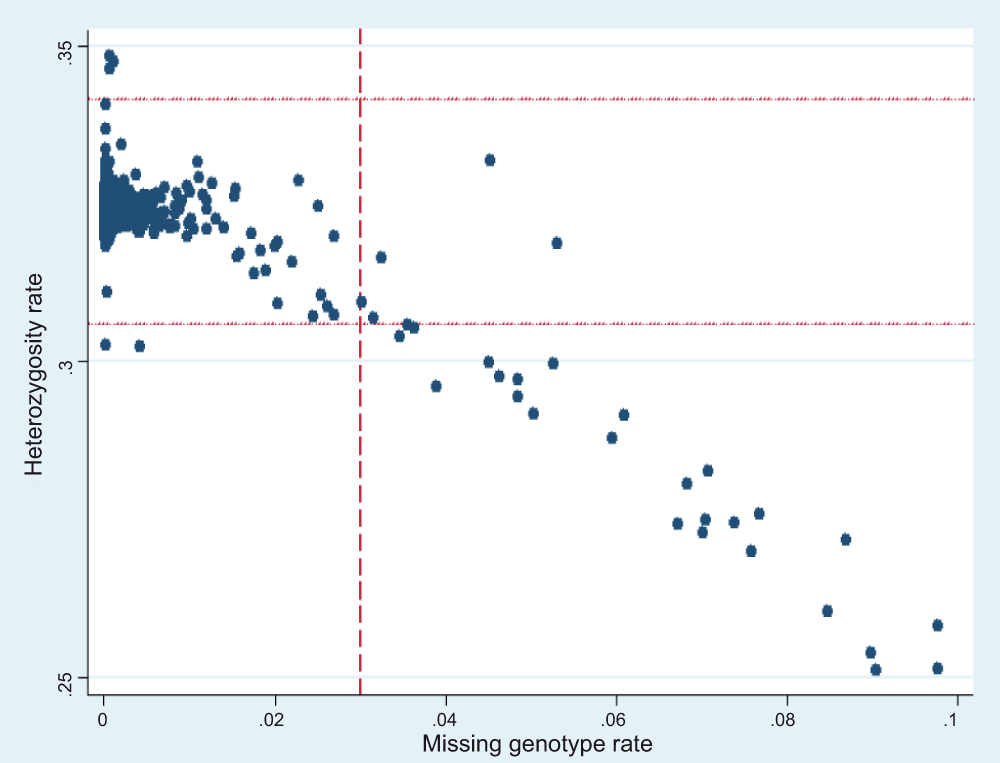
Figure 1. Per-individual quality control.
The X axis is the missing genotype rate for each individual. The Y axis is the heterozygosity rate for each individual. Each dot represents a person. The vertical dash line is the cut-off for per-individual missing rate: 3%. Individuals with missing rate greater than 3% are excluded. The two horizontal dot lines represent the mean heterozygosity ± 3 standard deviations. People with heterozygosity deviate above 3 standard deviations are also excluded. The two criteria overlap largely at the right lower part of the graph.
Table 1. Number of participants and markers in the dataset.
| I. Participants | (Individuals) |
|---|
| Original dataset |
1900
|
Per-individual
quality control exclusion |
36
|
| Missing genotype rate > 3% | 31 |
| Heterozygosity > 3 sd | 31 |
| Missing phenotype |
66
|
| Remained for analysis |
1,798
|
| II. Markers | (SNPs) |
|---|
| Original dataset |
560,768
|
Per-marker
quality control exclusion |
2,670
|
| Missing genotype rate > 3% | 1,933 |
Missing genotype rate
significantly different
between case and control | 367 |
Significantly deviate from
Hardy-Weinberg
equilibrium in control group | 885 |
| Not on autosomes |
13,423
|
| Remained for analysis |
544,675
|
Among the 560,768 markers, there were 1,933 SNPs that exceeded the missing rate threshold of 3%. There were 367 SNPs that had a significantly different missing rate between the case group and control group (P value < 1×10⁻⁵). Further, 885 SNPs significantly deviated from Hardy-Weinberg equilibrium in the control group (P value < 1×10⁻⁵). These three criteria also identified some overlapping SNPs; a total of 2,670 SNPs were excluded using all criteria. These quality control steps left 558,098 SNPs remaining in the dataset. Of these SNPs, 544,675 of them are located on 22 autosomes, and were included in the analysis (Table 1).
Allelic test
We carried out GWAS for these 1,798 individuals, of which 849 are SPTB cases and 949 are term controls, over 544,675 SNPs on 22 autosomal chromosomes. An allelic test was first carried out, and no SNPs reached genome-wide significance after Bonferroni correction for multiple testing (Manhattan plot (Figure 2) and QQ plot (Figure 3)).
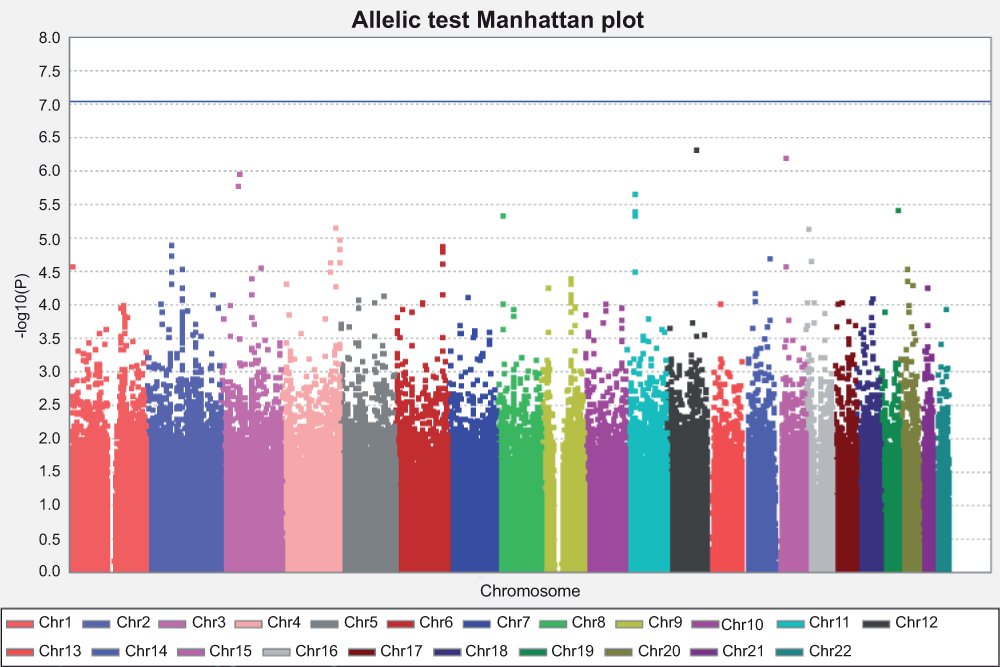
Figure 2. Manhattan plot for allelic test.
The X axis is the position of each SNP grouped by different chromosomes, and presented with different colors. The Y axis is the P value for each test for each SNP, in –log10 scale. The horizontal blue line indicated the threshold of genome-wide significance after Bonferroni correction. The threshold is at 7.04, which corresponds to –log10 (0.05/544,675) for 544,675 independent tests. No SNP reached genome-wide significance.
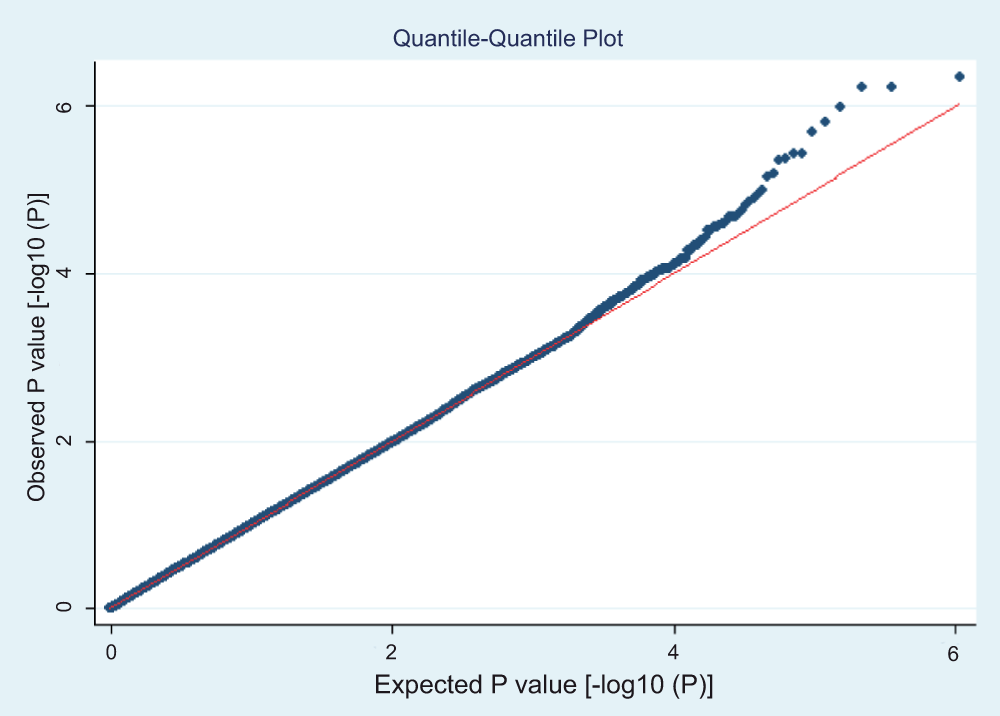
Figure 3. QQ plot for allelic test.
The X axis indicated the expected P value, in –log10 scale. The Y axis indicated the observed P value from allelic test, also in –log10 scale. The red diagonal line is the line of Y=X, where observed equals expected. The genome-wide significance threshold for –log10 (P) scale is at 7.04, which corresponds to –log10 (0.05/544,675) for 544,675 independent tests. No SNP reached genome-wide significance.
Other genetic models
We then performed GWAS with different genetic models. We tested three classical Mendelian inheritance models here. The recessive model assumes that carrying two variant alleles is required to present a different phenotype; while in the dominant model, one variant allele is sufficient to present a different phenotype as carrying two variant alleles. The additive model assumes the heterozygotes present an intermediate phenotype between the two homozygotes and thus consider the three genotypes separately. The Manhattan plot for the additive model (Figure 4), dominant model (Figure 5), and recessive model (Figure 6) are shown. The dominant or recessive models refer to the action of the minor allele. Within these genetic models, no SNP reached genome-wide significance after Bonferroni correction for multiple testing.
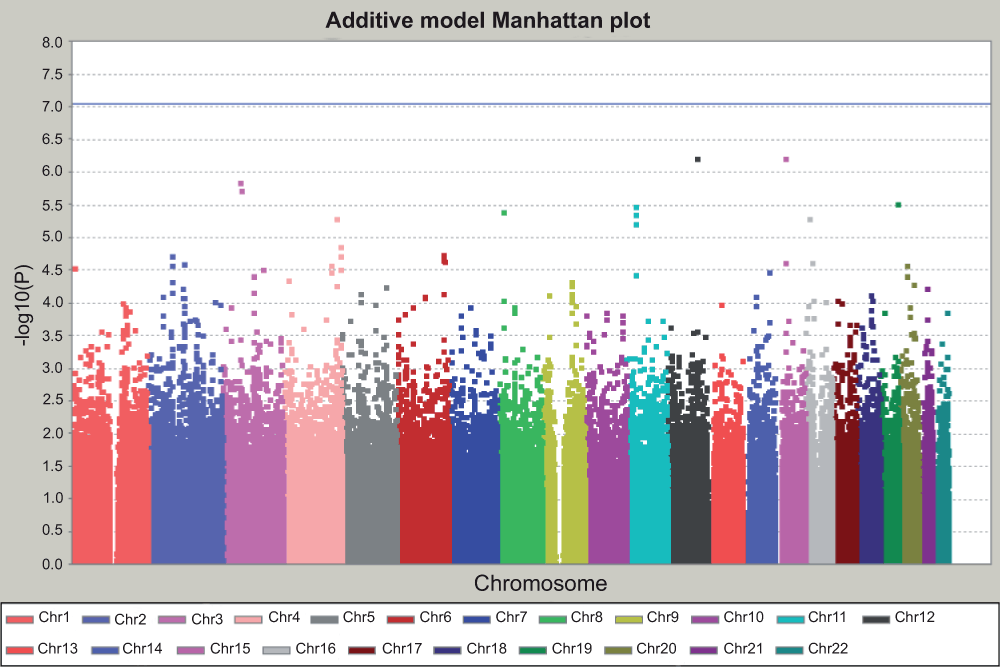
Figure 4. Manhattan plot for additive model.
The X axis is the position of each SNP grouped by different chromosomes, and presented with different colors. The Y axis is the P value for each test for each SNP, in –log10 scale. The horizontal blue line indicated the threshold of genome-wide significance after Bonferroni correction. The threshold is at 7.04, which corresponds to –log10 (0.05/544,675) for 544,675 independent tests. No SNP reached genome-wide significance.
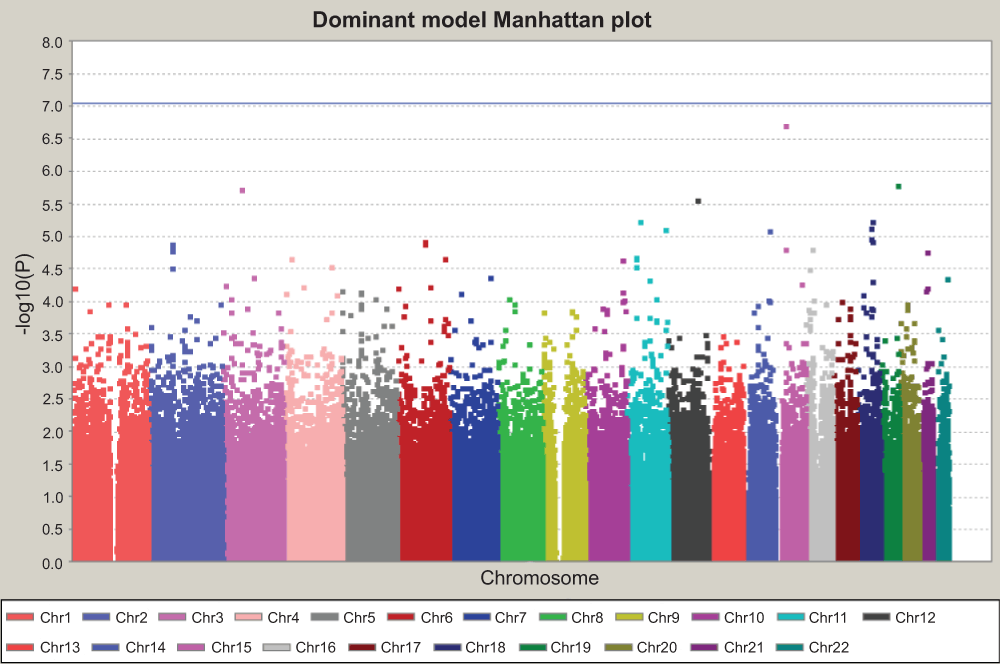
Figure 5. Manhattan plot for dominant model.
This is the GWAS result assuming the dominant action of minor alleles. The Y axis is the P value for each test for each SNP, in –log10 scale. The horizontal blue line indicated the threshold of genome-wide significance after Bonferroni correction. The threshold is at 7.04, which corresponds to –log10 (0.05/544,675) for 544,675 independent tests. No SNP reached genome-wide significance.
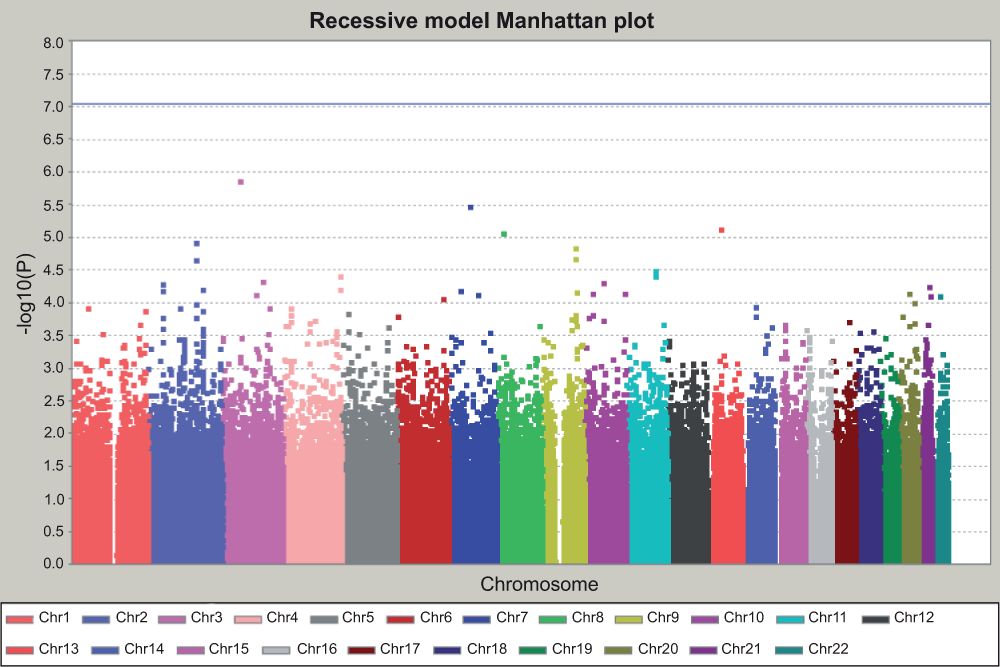
Figure 6. Manhattan plot for recessive model.
This is the GWAS result assuming the recessive action of minor alleles. The Y axis is the P value for each test for each SNP, in –log10 scale. The horizontal blue line indicated the threshold of genome-wide significance after Bonferroni correction. The threshold is at 7.04, which corresponds to –log10 (0.05/544,675) for 544,675 independent tests. No SNP reached genome-wide significance.
Discussion
Here we describe a negative result for associations between SPTB and genetic polymorphisms of 22 autosomal chromosomes in a homogeneous European population. Myking et al. reported a GWAS focusing on the X chromosome47 and they incorporated Danish cases and controls from DNBC41,47, in addition to participants enrolled from the Norwegian Mother and Child Cohort Study (MoBa)48. Nevertheless, with a larger sample size (DNBC + MoBa), and fewer independent tests limited to the markers on X chromosomes, no SNP reached genome-wide significance after Bonferroni correction47.
One way to decrease the probability of a negative result is to increase the sample size, either by recruiting more cases and controls directly, or by combining different studies and conducting a meta-analysis49,50. Instead of sequencing thousands or millions of sporadic cases plus controls, another approach is to study SPTB using a family-based design – i.e., identify high-risk pedigrees in which a genetic mutation is more likely to be present in multiple individuals. Pedigree studies have the additional advantage of reduced phenotypic heterogeneity49. Several loci associated with SPTB have been identified by using family-based linkage studies51,52.
Another approach is to employ whole genome or whole exome sequencing. This will help to identify rare genetic variants with potentially larger effect sizes.
Another approach that may increase statistical power is to analyze the SPTB phenotype as a quantitative trait instead of a dichotomous one. The distribution of gestational age in the population is approximately normal53. Therefore, to analyze SPTB as a quantitative trait (i.e., gestational age), samples should be drawn randomly from the population of newborns.
Conclusion
We found no evidence of genetic association with SPTB in Danish population using an unbiased genome-wide approach. A family-based design in a high risk pedigree, and whole genome or exome sequencing, may yield higher detection rates of both common and rare variants associated with SPTB.
Author contributions
WW conceived of and designed the study. EASC, TAM, MSE, MV, and LBJ provided input to the study design. WW and LBJ applied for data access and conducted the analysis. WW drafted the manuscript. EASC, TAM, MSE, MV, and LBJ provided critical review. All authors read and approved the final manuscript.
Competing interests
No competing interests were disclosed.
Grant information
EASC is supported by National Institutes of Health, National Institute of Child Health and Human Development (K23HD061910). We would like to acknowledge DNBC, dbGAP, and NCBI for depositing and hosting the phenotype and genotype data.
Acknowledgements
We would like to acknowledge DNBC, dbGAP, and NCBI for depositing and hosting the phenotype and genotype data. We would like to thank Robert Weiss from Department of Human Genetics, University of Utah, for his detailed consultations for data analysis. We would also like to thank Isabella Johnsen and June Blackburn from University of Utah for their assistances during our application for dbGAP data access.
Faculty Opinions recommendedReferences
- 1.
Reich ES:
Pre-term births on the rise.
Nature.
2012; 485(7396): 20. PubMed Abstract
| Publisher Full Text
- 2.
Blencowe H, Cousens S, Oestergaard MZ, et al.:
National, regional, and worldwide estimates of preterm birth rates in the year 2010 with time trends since 1990 for selected countries: a systematic analysis and implications.
Lancet.
2012; 379(9832): 2162–72. PubMed Abstract
| Publisher Full Text
- 3.
Hamilton BE, Hoyert DL, Martin JA, et al.:
Annual summary of vital statistics: 2010–2011.
Pediatrics.
2013; 131(3): 548–58. PubMed Abstract
| Publisher Full Text
- 4.
Raju TN:
Epidemiology of late preterm (near-term) births.
Clin Perinatol.
2006; 33(4): 751–763. abstract vii. PubMed Abstract
| Publisher Full Text
- 5.
Liu L, Johnson HL, Cousens S, et al.:
Global, regional, and national causes of child mortality: an updated systematic analysis for 2010 with time trends since 2000.
Lancet.
2012; 379(9832): 2151–61. PubMed Abstract
| Publisher Full Text
- 6.
Mathew T, MacDorman M:
Infant Mortality Statistics from the 2003 Period Linked Birth/Infant Death Data Set.
Natl Vital Stat Rep.
2006; 54(16): 1–29. PubMed Abstract
- 7.
Damus K:
Prevention of preterm birth: a renewed national priority.
Curr Opin Obstet Gynecol.
2008; 20(6): 590–6. PubMed Abstract
| Publisher Full Text
- 8.
Wood NS, Marlow N, Costeloe K, et al.:
Neurologic and developmental disability after extremely preterm birth. EPICure Study Group.
N Engl J Med.
2000; 343(6): 378–84. PubMed Abstract
| Publisher Full Text
- 9.
Muglia LJ, Katz M:
The enigma of spontaneous preterm birth.
N Engl J Med.
2010; 362(6): 529–35. PubMed Abstract
| Publisher Full Text
- 10.
Kistka ZA, Palomar L, Lee KA, et al.:
Racial disparity in the frequency of recurrence of preterm birth.
Am J Obstet Gynecol.
2007; 196(2): 131.e1–6. PubMed Abstract
| Publisher Full Text
- 11.
Collins JW Jr, David RJ, Handler A, et al.:
Very low birthweight in African American infants: the role of maternal exposure to interpersonal racial discrimination.
Am J Public Health.
2004; 94(12): 2132–8. PubMed Abstract
| Publisher Full Text
| Free Full Text
- 12.
Goldenberg RL, Culhane JF, Iams JD, et al.:
Epidemiology and causes of preterm birth.
Lancet.
2008; 371(9606): 75–84. PubMed Abstract
| Publisher Full Text
- 13.
Clausson B, Lichtenstein P, Cnattingius S:
Genetic influence on birthweight and gestational length determined by studies in offspring of twins.
BJOG.
2000; 107(3): 375–81. PubMed Abstract
| Publisher Full Text
- 14.
Treloar SA, Macones GA, Mitchell LE, et al.:
Genetic influences on premature parturition in an Australian twin sample.
Twin Res.
2000; 3(2): 80–2. PubMed Abstract
| Publisher Full Text
- 15.
Esplin MS, O’Brien E, Fraser A, et al.:
Estimating recurrence of spontaneous preterm delivery.
Obstet Gynecol.
2008; 112(3): 516–23. PubMed Abstract
| Publisher Full Text
- 16.
Adams MM, Elam-Evans LD, Wilson HG, et al.:
Rates of and factors associated with recurrence of preterm delivery.
JAMA.
2000; 283(12): 1591–6. PubMed Abstract
| Publisher Full Text
- 17.
Bakketeig LS, Hoffman HJ, Harley EE:
The tendency to repeat gestational age and birth weight in successive births.
Am J Obstet Gynecol.
1979; 135(8): 1086–103. PubMed Abstract
- 18.
Porter TF, Fraser AM, Hunter CY, et al.:
The risk of preterm birth across generations.
Obstet Gynecol.
1997; 90(1): 63–7. PubMed Abstract
| Publisher Full Text
- 19.
Winkvist A, Mogren I, Högberg U:
Familial patterns in birth characteristics: impact on individual and population risks.
Int J Epidemiol.
1998; 27(2): 248–54. PubMed Abstract
| Publisher Full Text
- 20.
Manuck TA, Lai Y, Meis PJ, et al.:
Admixture mapping to identify spontaneous preterm birth susceptibility loci in African Americans.
Obstet Gynecol.
2011; 117(5): 1078–84. PubMed Abstract
| Publisher Full Text
| Free Full Text
- 21.
Tsai HJ, Hong X, Chen J, et al.:
Role of African ancestry and gene-environment interactions in predicting preterm birth.
Obstet Gynecol.
2011; 118(5): 1081–9. PubMed Abstract
| Publisher Full Text
| Free Full Text
- 22.
Ehn NL, Cooper ME, Orr K, et al.:
Evaluation of fetal and maternal genetic variation in the progesterone receptor gene for contributions to preterm birth.
Pediatr Res.
2007; 62(5): 630–5. PubMed Abstract
| Publisher Full Text
| Free Full Text
- 23.
Aidoo M, McElroy PD, Kolczak MS, et al.:
Tumor necrosis factor-alpha promoter variant 2 (TNF2) is associated with pre-term delivery, infant mortality, and malaria morbidity in western Kenya: Asembo Bay Cohort Project IX.
Genet Epidemiol.
2001; 21(3): 201–11. PubMed Abstract
| Publisher Full Text
- 24.
Chen D, Hu Y, Wu B, et al.:
Tumor necrosis factor-alpha gene G308A polymorphism is associated with the risk of preterm delivery.
Beijing Da Xue Xue Bao.
2003; 35(4): 377–81. PubMed Abstract
- 25.
Simhan HN, Krohn MA, Roberts JM, et al.:
Interleukin-6 promoter-174 polymorphism and spontaneous preterm birth.
Am J Obstet Gynecol.
2003; 189(4): 915–8. PubMed Abstract
| Publisher Full Text
- 26.
Moore S, Ide M, Randhawa M, et al.:
An investigation into the association among preterm birth, cytokine gene polymorphisms and periodontal disease.
BJOG.
2004; 111(2): 125–32. PubMed Abstract
| Publisher Full Text
- 27.
Kalish RB, Vardhana S, Gupta M, et al.:
Interleukin-4 and -10 gene polymorphisms and spontaneous preterm birth in multifetal gestations.
Am J Obstet Gynecol.
2004; 190(3): 702–6. PubMed Abstract
| Publisher Full Text
- 28.
Macones GA, Parry S, Elkousy M, et al.:
A polymorphism in the promoter region of TNF and bacterial vaginosis: preliminary evidence of gene- environment interaction in the etiology of spontaneous preterm birth.
Am J Obstet Gynecol.
2004; 190(6): 1504–1508. discussion 3A. PubMed Abstract
| Publisher Full Text
- 29.
Amory JH, Adams KM, Lin MT, et al.:
Adverse outcomes after preterm labor are associated with tumor necrosis factor-alpha polymorphism -863, but not -308, in mother-infant pairs.
Am J Obstet Gynecol.
2004; 191(4): 1362–7. PubMed Abstract
| Publisher Full Text
- 30.
Annells MF, Hart PH, Mullighan CG, et al.:
Interleukins-1, -4, -6, -10, tumor necrosis factor, transforming growth factor-beta, FAS and mannose-binding protein C gene polymorphisms in Australian women: Risk of preterm birth.
Am J Obstet Gynecol.
2004; 191(6): 2056–67. PubMed Abstract
| Publisher Full Text
- 31.
Härtel C, Finas D, Ahrens P, et al.:
Polymorphisms of genes involved in innate immunity: association with preterm delivery.
Mol Hum Reprod.
2004; 10(12): 911–5. PubMed Abstract
| Publisher Full Text
- 32.
Engel SAM, Erichsen HC, Savitz DA, et al.:
Risk of spontaneous preterm birth is associated with common proinflammatory cytokine polymorphisms.
Epidemiology.
2005; 16(4): 469–77. PubMed Abstract
| Publisher Full Text
- 33.
Wu W, Clark EAS, Stoddard GJ, et al.:
Effect of interleukin-6 polymorphism on risk of preterm birth within population strata: a meta- analysis.
BMC Genet.
2013; 14: 30. PubMed Abstract
| Publisher Full Text
| Free Full Text
- 34.
Diaz-Cueto L, Dominguez-Lopez P, Cantillo-Cabarcas J, et al.:
Progesterone receptor gene polymorphisms are not associated with preterm birth in a Hispanic population.
Int J Gynaecol Obstet.
2008; 103(2): 153–7. PubMed Abstract
| Publisher Full Text
- 35.
Guoyang Luo, Morgan T, Bahtiyar MO, et al.:
Single nucleotide polymorphisms in the human progesterone receptor gene and spontaneous preterm birth.
Reprod Sci.
2008; 15(2): 147–55. PubMed Abstract
| Publisher Full Text
- 36.
Plunkett J, Muglia LJ:
Genetic contributions to preterm birth: Implications from epidemiological and genetic association studies.
Ann Med.
2008; 40(3): 167–79. PubMed Abstract
| Publisher Full Text
- 37.
Hindorff LA, Sethupathy P, Junkins HA, et al.:
Potential etiologic and functional implications of genome-wide association loci for human diseases and traits.
Proc Natl Acad Sci U S A.
2009; 106(23): 9362–7. PubMed Abstract
| Publisher Full Text
| Free Full Text
- 38.
Hindorff L, MacArthur J, Morales J, et al.:
Catalog of Published Genome-Wide Association Studies [Internet]. [cited 2013 Sep 2]. Reference Source
- 39.
Mailman MD, Feolo M, Jin Y, et al.:
The NCBI dbGaP database of genotypes and phenotypes.
Nat Genet.
2007; 39(10): 1181–6. PubMed Abstract
| Publisher Full Text
| Free Full Text
- 40.
Database of Genotypes and Phenotypes (dbGaP). Bethesda (MD): National Center for Biotechnology Information, National Library of Medicine. [Internet]. Reference Source
- 41.
Olsen J, Melbye M, Olsen SF, et al.:
The Danish National Birth Cohort--its background, structure and aim.
Scand J Public Health.
2001; 29(4): 300–7. PubMed Abstract
| Publisher Full Text
- 42.
Anderson CA, Pettersson FH, Clarke GM, et al.:
Data quality control in genetic case-control association studies.
Nat Protoc.
2010; 5(9): 1564–73. PubMed Abstract
| Publisher Full Text
| Free Full Text
- 43.
Balding DJ:
A tutorial on statistical methods for population association studies.
Nat Rev Genet.
2006; 7(10): 781–91. PubMed Abstract
| Publisher Full Text
- 44.
Purcell S, Neale B, Todd-Brown K, et al.:
PLINK: a tool set for whole-genome association and population-based linkage analyses.
Am J Hum Genet.
2007; 81(3): 559–75. PubMed Abstract
| Publisher Full Text
| Free Full Text
- 45.
Stata Corp. LP. STATA Statistical Software: Release 12. College Station, TX; 2011.
- 46.
Barrett JC, Fry B, Maller J, et al.:
Haploview: analysis and visualization of LD and haplotype maps.
Bioinformatics.
2005; 21(2): 263–5. PubMed Abstract
| Publisher Full Text
- 47.
Myking S, Boyd HA, Myhre R, et al.:
X- chromosomal maternal and fetal SNPs and the risk of spontaneous preterm delivery in a Danish/Norwegian genome-wide association study.
PLoS One.
2013; 8(4): e61781. PubMed Abstract
| Publisher Full Text
| Free Full Text
- 48.
Magnus P, Irgens LM, Haug K, et al.:
Cohort profile: the Norwegian Mother and Child Cohort Study (MoBa).
Int J Epidemiol.
2006; 35(5): 1146–50. PubMed Abstract
| Publisher Full Text
- 49.
Ioannidis JP, Thomas G, Daly MJ:
Validating, augmenting and refining genome-wide association signals.
Nat Rev Genet.
2009; 10(5): 318–29. PubMed Abstract
| Publisher Full Text
- 50.
Ehret GB, Munroe PB, Rice KM, et al.:
Genetic variants in novel pathways influence blood pressure and cardiovascular disease risk. International Consortium for Blood Pressure Genome-Wide Association Studies.
Nature.
2011; 478(7367): 103–9. PubMed Abstract
| Publisher Full Text
| Free Full Text
- 51.
Haataja R, Karjalainen MK, Luukkonen A, et al.:
Mapping a new spontaneous preterm birth susceptibility gene, IGF1R, using linkage, haplotype sharing, and association analysis.
PLoS Genet.
2011; 7(2): e1001293. PubMed Abstract
| Publisher Full Text
| Free Full Text
- 52.
Bream EN, Leppellere CR, Cooper ME, et al.:
Candidate gene linkage approach to identify DNA variants that predispose to preterm birth.
Pediatr Res.
2013; 73(2): 135–41. PubMed Abstract
| Publisher Full Text
| Free Full Text
- 53.
Kieler H, Axelsson O, Nilsson S, et al.:
The length of human pregnancy as calculated by ultrasonographic measurement of the fetal biparietal diameter.
Ultrasound Obstet Gynecol.
1995; 6(5): 353–7. PubMed Abstract
| Publisher Full Text


Comments on this article Comments (0)