Introduction
Efforts to study gene-expression regulation networks has led to detailed descriptions of many such networks, and many more can be expected to be identified in the near future. Therefore, there is a need to develop methods of computational and theoretical analysis of gene regulatory networks (GRNs). One of the most promising directions is to reduce the problem to the study of Markov chains generated in some way from the GRN1–5. Usually, Boolean networks6 are used as a formal representation of a GRN. Classification of process states, studies of long-term behavior7, and development of optimal strategies for therapeutic intervention7–15 provide good examples of this approach16. In contrast to Boolean networks, Hopfield networks are defined using arithmetic operations17. They are a well-developed branch of science dealing with stochastic processes of asynchronous state switching as a result of interactions. As such, they are similar to Boolean networks. A Hopfield-like formalism also leads to the definition of a Markov chain. In the Hopfield network field, essential results have been obtained in the study of various update schemes18, network oscillations19, solutions of combinatorial optimization problems19–26, estimation of convergence rates, and many other problems. This makes it valuable to study the possibility of using Hopfield like-networks to construct Markov chains from GRNs and other interaction graphs. Here, a GRN is considered to be a kind of interaction graph. Interaction (regulatory) graphs have emerged in various fields of the life sciences27. In recent years, their transition graphs have often been used to analyze the properties of interactions (regulations). One promising way to understand the nature of the regulations or interactions represented by interaction graphs is to analyze the Markov chain associated with their transition graphs.
Method
The proposed method may be viewed as a version of the Hopfield-like network17 where groups of randomly selected unstable units are updated in parallel18.
Interaction graphs and non-steady-state vertices
Let G = (V, E) be a directed graph, where V is a set of vertices and E is a set of edges. Let B = {0, 1} be a set of vertex states. It is said that the vertex is active if the state of this vertex is equal to “1”, otherwise it is said that the vertex is inactive. The mapping function M: V → B gives the state of each vertex. For a given vertex v ∈ V, M(v) is the state of vertex v that corresponds to map M. M(v) = 1 is equivalent to saying that vertex v is active under map M. M(v) = 0 is equivalent to saying that vertex v is inactive. The weighting function W: E → R gives value of each edge of graph G, which represents the power of interactions. If e = (u, v), e ∈ E, then u is said to be a direct ancestor of v and v to be a direct descendant of u. The influence on v under the map M is defined as the sum of weights of edges from all direct active ancestors of vertex v. The influence on v under the map M is denoted by I(v, M) (also called “the local field or the net input”). That is,
This influence is determined by the map function M and the weighting function W. Only if the weighting function W is assumed to be constant over time can it be said that the influence I(v, M) is the influence of map M on vertex v. If I(v, M) ≥ 0, it is said that the map M activates vertex v, otherwise that the map M represses (or inactivates) vertex v. Now the most important definition of a vertex steady state under map M can be provided. Let v be an active vertex under map M. If map M activates v, then the state of v is a steady state under map M, else the state of v is a non-steady state under map M. Now let v be an inactive vertex under map M. If map M inactivates v, then the state of v is a steady state under map M, else the state of v is a non-steady state under map M. If all vertices are in steady state under map M, then map M is called a steady-state map. The forced state of vertex v under map M is defined as follows:
By definition, if the forced state and the current state of v are the same, then the current state of vertex v under map M is steady. The following equation provides a formal definition:
The random set update rule
Now consider a stochastic process {Yj, j = 1, 2, 3, …} that takes on the set of maps of some interaction graph G, where Yj denotes the map of G at time period j. At each time period j for each non-steady-state vertex vi under map Yj, the current vertex state is changed to a forced state with probability pi, and the current state remains unchanged with probability 1 – pi. Let S = {v1, v2, … , vn} be a set of all non-steady-state vertices at time period j. The vertices chosen to change their state in a one-step transition constitute a random set X ⊆ S. To create a new map that is directly accessible from the current map Yj, all vertices in X simultaneously change their state, whereas other vertices remain unchanged. Let P={p1, p2, … , pn} be some vector of numbers such that 0 ≤ pi ≤ 1, where pi is referred to as the probability of a state change (firing) of the non-steady-state vertex vi. For any X ⊆ S, let 1X: S → B be an indicator function such that 1X(vi) = 1 if vi ∈ X, otherwise 1X(vi) = 0. Let PX: S → [0.0, 1.0] denote the function such that PX(vi) = pi if 1X(vi) = 1, otherwise PX(vi) = 1 − pi. Hence, it can be assumed that each vi acts independently to create a random set X. Then the production of PX gives pX, which is the firing probability of the random set X:
Evidently,
Now this definition of the random set update rule and its probabilities can be used to define the transition graph of the combinatorial net model.
The transition graph of the interaction graph
Let S be the set of non-steady state vertices under map M = Yj. S represents a full set of vertices, each of which can flip to a forced state at the next j + 1 time step. In the combinatorial model, steady-state vertices cannot flip. To construct a transition graph, the full set of maps M1, M2, … that are directly reachable from map M should be defined. Each pair (M, Mi) will correspond to one edge in the transition graph. What is the set of maps M1, M2, … that can be directly reached (by a one-step transition) from map M? To represent independence and asynchronicity, it is assumed that any random set of non-steady-state vertices X ⊆ S can produce the next map from the current map. Let MX be a map such that MX(v) = F(v, M) if v Ï X and MX(v) = M(v) if v ∉ X; then MX can be said to be produced by X from M. In other words, the random set X of non-steady-state vertices produces the directly reachable map MX from a map M. The weights of the edges from map M to map MX are given by the probability defined by Equation (4).
Random-walk network dynamics
Assume that whenever the process is in state M, there is a probability pX that at the next step, it will be in state MX. This probability is defined for each random set X of non-steady-state vertices of map M.
Generalized random set update rules
It is well known that asynchronous and random set update rules are equivalent in the sense of global stable states28. However, in the sense of the reachability of one state from another, they are not equivalent. Figure 1 show a Mace combinatorial model that illustrates this fact. The vertex e provides a constant level of repression for vertex c, that is, equal to -2. Let vertex d of the Mace model be active at the start. Then it can activate both middle vertices a and b. Due to repression, vertex c of the Mace model can be activated only if both middle vertices a and b are active simultaneously. Asynchronous (one at a time) updating excludes simultaneous activation of these vertices, but the random set update rule does not. A synchronous update rule does not exclude simultaneous activation of a and b, but it makes the system deterministic. The random set update rule is more general than either synchronous or asynchronous update rules because it allows all possible system evolution paths. Therefore, the transition graphs of both synchronous and asynchronous update rules are subgraphs of the random set update graph.
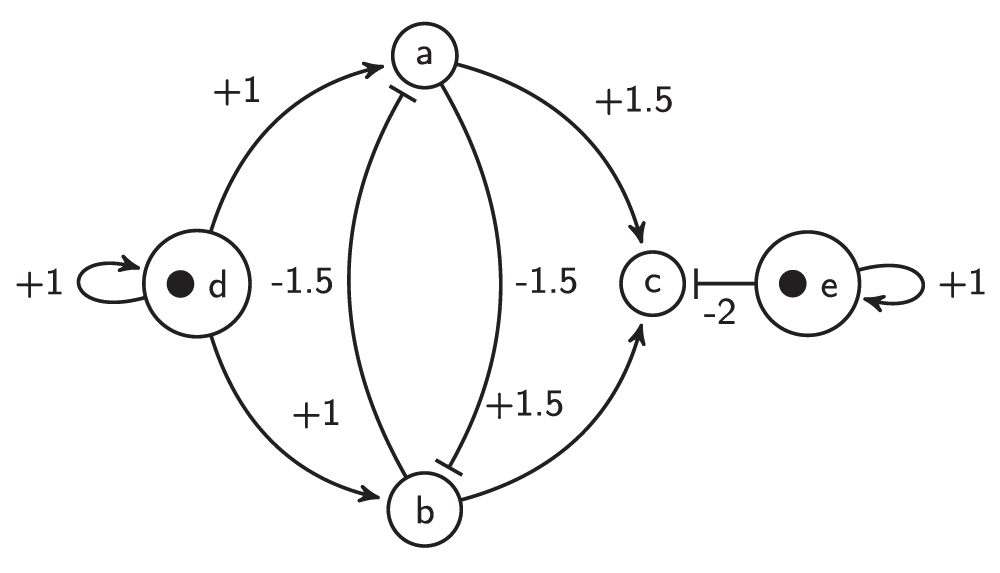
Figure 1. The Mace.
Examples of combinatorial models
The method described above will now be used to develop models of some important graphs of repressive interactions of self-activating nodes and to prove their main properties. Such models are called combinatorial models. Each combinatorial model consists of the interaction graph (combinatorial net) and the corresponding transition graph.
The combinatorial model of an auto-repression
A negative auto-regulation or an auto-repression occurs when the products of a certain gene represse their own gene. This form of simple regulation serves as a basic building block for most important transcription networks27,29. Auto-repression can produce oscillations. For example, embryonic stem cells fluctuate between high and low Nanog expression, and Nanog activity is auto-repressive30. The model of auto-repression presented here and shown in Figure 3 and Figure 2a also exhibits stochastic oscillating behavior. Figure 2a presents an interaction graph G = (V, E) of the auto-repression model. The set V contains a single vertex v1, and the set E consists of a single edge e1 = (v1, v1) from vertex v1 to itself. The weight of e1 is equal to -1. Let M0 be a starting map, and let M0(v1) = 0, i.e., v1 is inactive under M0. Therefore, the influence of M0 on vertex v1 equals 0, I(v1, M0) = 0. By Equation (2), F(v1, M0) = 1, and the state of vertex v1 is non-steady under map M0. Let p1 = 1/2; then the state of vertex v1 can change to an active state with probability 1/2 and can remain unchanged with probability 1/2. The other state of the model is also non-steady. This means that there are only non-steady states in the model. Therefore, it will oscillate infinitely between 0 and 1. Figure 3 shows the full transition graph of the auto-repression model.
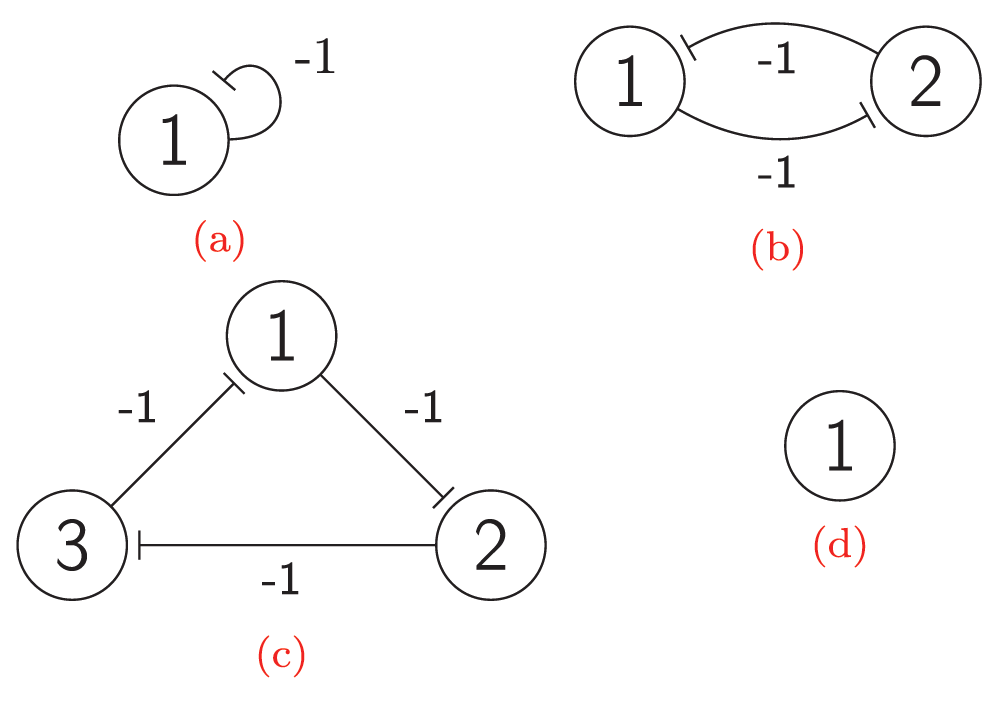
Figure 2.
The interaction graph of: (a) The auto-repression model; (b) The bi-stable switch model; (c) The Elowitz repressilator model; (d) The self-activation model.
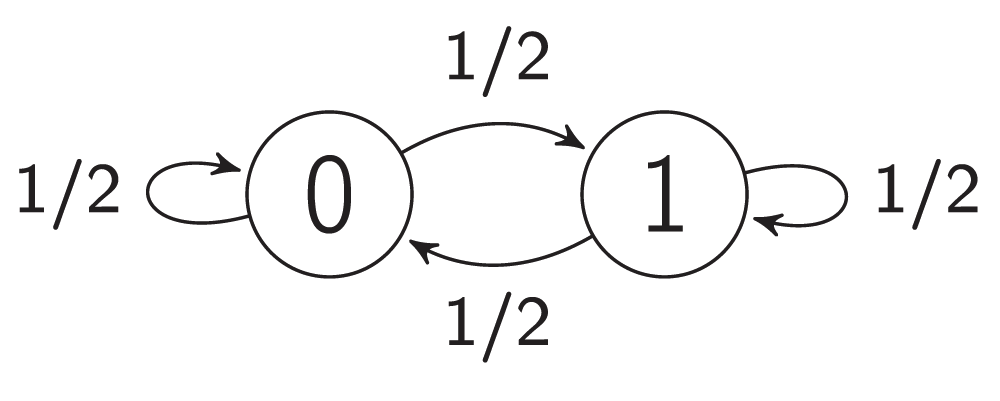
Figure 3. The transition graph of an auto-repression model.
Combinatorial model of a bi-stable switch
A bi-stable switch is a bi-stable gene regulatory network that is constructed from two mutually repressive genes31. These are very common in nature and extensively used in synthetic biology32,33. The ordinary differential equations (ODEs) used to construct their mathematical models are a convenient way to analyze some small circuits in detail. In this research, techniques have been developed that can be used to construct models of large networks of bi-stable switches and to prove some of their important properties. For this purpose, a probabilistic coarse-scale modeling approach34 has been used here instead of fine-scale ODE modeling. The proposed model of a bi-stable switch illustrated in Figure 2b and Figure 4 exhibits two steady maps. Figure 2b presents an interaction graph G = (V, E) of the bi-stable switch model. The set V = {v1, v2} contains two vertices, and the set E contains two edges with weights of -1. Let the probability of firing a non-steady-state vertex be 1/2. Figure 4 presents the transition graph of the model. Maps 00 and 11 are non-steady-state, whereas maps 01 and 10 are steady-state. To show that a map M is steady-state, it is necessary to show that each vertex v is steady-state under map M. To show that a vertex v is steady-state under map M, one must compute the value of the influence F(v, M) of map M on vertex v and compare it to the state of v under map M, i.e. M(v). Now it will be shown that map 01 is steady-state.
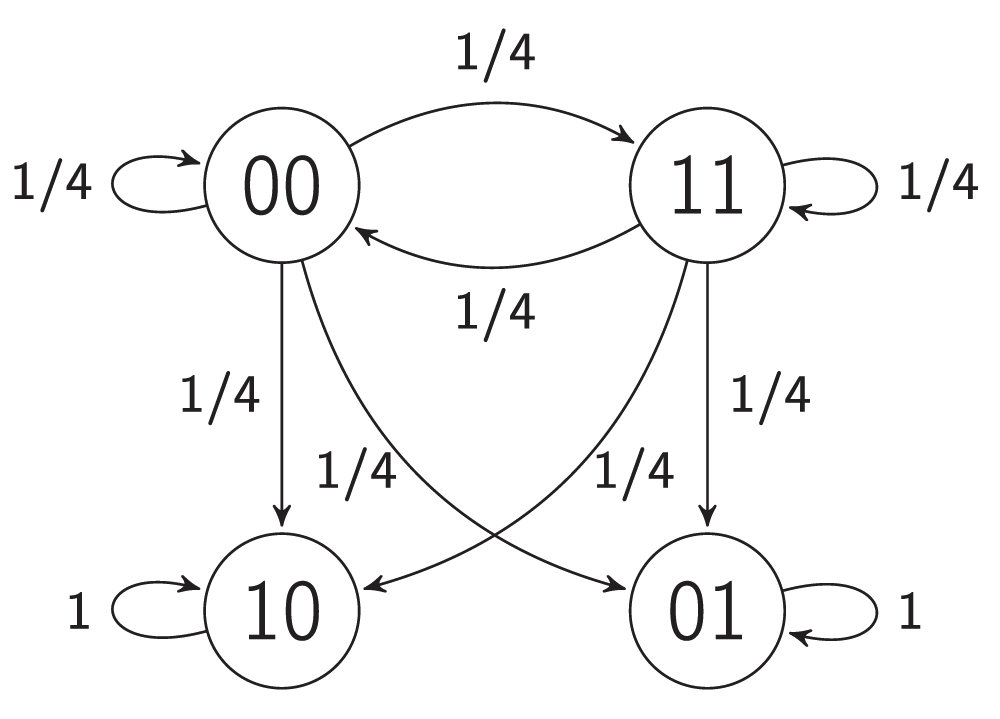
Figure 4. The transition graph of a bi-stable switch.
Combinatorial model of the Elowitz repressilator
The Elowitz repressilator consists of three genes35, each of which is constitutively expressed. The first gene inhibits the transcription of the second gene, whose protein product in turn inhibits the expression of a third gene, and finally, the third gene inhibits the first gene’s expression, completing the cycle. Such a negative feedback loop leads to oscillations. The combinatorial model of an Elowitz repressilator produces oscillations and consists of three vertices and three edges with weights equal to -1. Figure 2c present an interaction graph G = (V, E) of the Elowitz repressilator model, where the set V = {v1, v2, v3} contains three vertices and the set E = {(v1, v2), (v2, v3), (v3, v1)} contains three edges. Oscillations are produced by circle {1,3,2,6,4,5} in Figure 5. Decimal, binary, and graphical representations of the state space of the Elowitz repressilator are shown in Table 1.
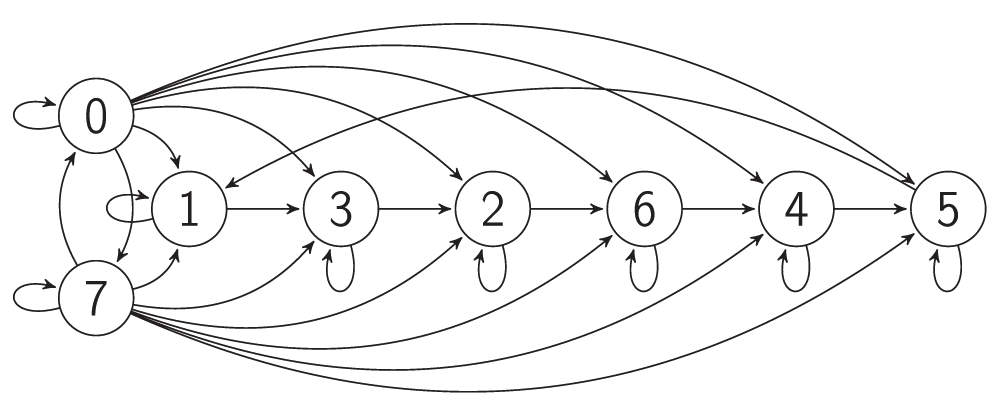
Figure 5. The transition graph of the Elowitz repressilator model.
Table 1. Decimal, binary, and graphical representations of the state space of the Elowitz repressilator.
| Dec | Binary | Graphic | Non steady vertices | Direct reachable states |
|---|
| 0 | 000 |

|

| 0, 1, 2, 3, 4, 5, 6, 7 |
| 1 | 001 |

|

| 1, 3 |
| 2 | 010 |

|

| 2, 6 |
| 3 | 011 |

|

| 3, 2 |
| 4 | 100 |

|

| 4, 5 |
| 5 | 101 |

|

| 5, 1 |
| 6 | 110 |

|

| 6, 4 |
| 7 | 111 |

|

| 0, 1, 2, 3, 4, 5, 6, 7 |
Combinatorial model of self-activation
A constitutively expressed gene is an example of self-activation. Such genes do not require any interaction to be active. A combinatorial model of self-activation consists of one vertex and no edges. In any case, the influence on it equals 0 because there are no other vertices. Therefore, a forced state of the vertex equals 1. Therefore, 1 is a steady state and 0 is a non-steady state. A vertex starting in steady state will stay in it infinitely. A vertex starting in a non-steady state will flip to steady state with probability p and stay in non-steady state with probability 1-p. The amount of time T which the vertex spends in non-steady state is the random variable. The distribution of this random variable is a shifted geometric distribution with parameter p.
Figure 2d and Figure 6 represent the combinatorial model of self-activation.

Figure 6. The transition graph of a self-activation model.
A network of bi-stable switches
An independent set (IS) in a graph is a set of vertices no two of which are adjacent. An independent set is called maximal (MIS) if there is no independent set that it contains properly. A Hopfield network whose stable states are exactly maximal independent sets was developed by Shrivastava36. An independent set in a graph is a clique in the complement graph, and vice versa. Therefore, cliques can be used to find or to enumerate MISs20,21. Finding independent sets (or cliques) has applications in various fields37. Combinatorial nets can be used to compute maximal independent sets of graphs in a distributed self-organization model. Stable states of a network of bi-stable switches derived from a graph are exactly maximal independent sets of its underlying graph. Now consider a simple graph H, that is, a graph without directed, multiple, or weighted edges, and without internal loops. Let C(H) denote the graph obtained from H by deleting each undirected edge (u, v) of H and adding instead of this edge two new directed edges (u, v) and (v, u). Let the set of vertices of C(H) be the same as the set of vertices of H. Let -1 be the weight of each edge of C(H). The bi-stable switch can be seen as a combinatorial net derived from a simple graph of order 2. For example, Figure 7b illustrates the combinatorial network derived from the graph shown in Figure 7a. The first switch is formed by the subgraph induced by the {1,2} set of vertices of the C(H) network. The second switch is formed by the {2,3} set of vertices. Vertex 2 is a common member of these switches, and therefore they can interact by means of this vertex. Each edge of an underlying graph corresponds to a switch in a derived network. If two incident edges share a common vertex, then the corresponding switches interact because this vertex has the same state in both switches. C(H) is referred to as the derived network of a bi-stable switch, and H is referred to as the underlying graph.
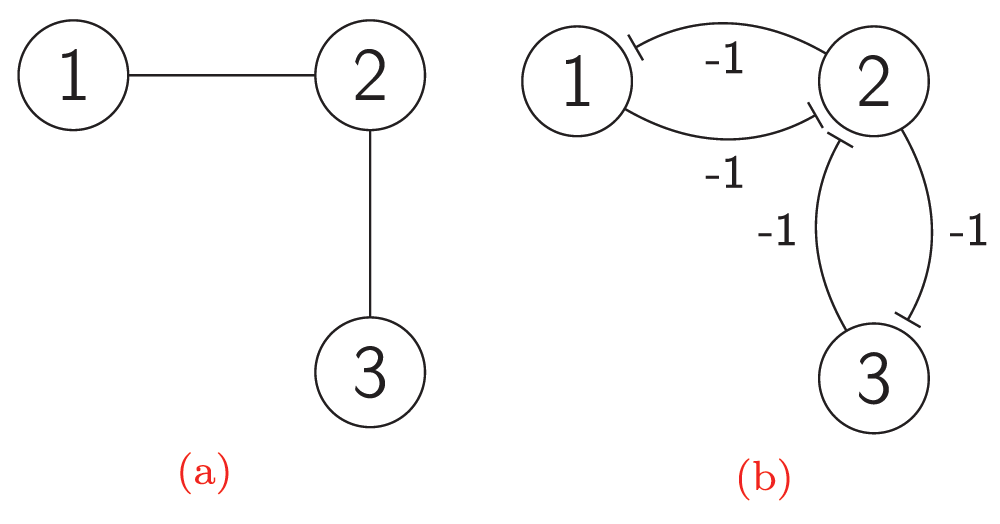
Figure 7.
The network C(H) derived from a graph H: (a) The graph H; (b) The network C(H) derived from the graph H.
Lemma 1. A steady-state map M of a combinatorial net derived from a simple graph does not have two adjacent active vertices u and v.
Proof 1. Assume by contradiction that u and v are adjacent active vertices; then I(u, M) < 0, and the forced state of u is inactive. If the map (the network state) M is steady and the forced state is inactive, then the state of the vertex u is inactive, whereas by the assumption u is active.
Lemma 2. If a map M of a combinatorial net derived from a simple graph is steady-state and some vertex is inactive, then there is at least one active vertex adjacent to it.
Proof 2. Assume by contradiction that there are no active adjacent vertices of inactive vertex v; then the influence I(v, M) = 0, and the forced state of v is active. Hence the map M is steady-state, the forced state of the vertex is equal to its current state, and the state of the vertex is active, which contradicts the assumption.
Lemma 3. Under a steady-state map M of the combinatorial net C(H) derived from a simple graph H, the set of all active vertices is a maximal independent set of H.
Proof 3. Let us prove independence first. Assume by contradiction that the set of active vertices of some steady-state map C(H) is not an independent set of vertices of graph H. Then there is a pair of adjacent vertices in H which are simultaneously active under this steady-state map M. However, by lemma 1, there are no two adjacent active vertices under a steady-state map. This contradiction proves the independence of the set of active vertices under the steady-state map. Now consider the maximality of the independent set of active vertices under a steady-state map. Assume that there is an inactive vertex which is not adjacent to any active vertex. Therefore, this vertex can be added to this set to form a bigger independent set. But if such vertex exists, then there is an active vertex adjacent to this, by lemma 2, which contradicts the independence.
Lemma 4. Any maximal independent set of a simple graph H forms the full set of active vertices of some steady-state map of the combinatorial net derived from H.
Proof 4. The desired map M can be constructed as follows. Let all vertices from the maximal independent set be active under M, but let another vertices be inactive under M. Evidently, this map M is a steady-state map.
Theorem. Let C(H) be the combinatorial net derived from a simple graph H; then the map M is steady-state if and only if the set of all active vertices under map M is the maximal independent set of vertices of graph H.
Proof 5. Lemmas 3 and 4 prove the theorem.
Conclusions
A similar approach to constructing Markov chains for interaction graphs was developed in earlier works by the authors for neural and gene regulatory networks38–42. Both approaches can be used to construct Markov chains for gene regulatory networks. Systems of mutually repressive elements are ubiquitous in nature. A network of bi-stable switches can be used to create models of their stable states and of the self-evolution of such systems toward stable states.
Author contributions
VS and MS developed the framework of combinatorial models. MS developed the model the bi-stable switch. AS and VS formulated the theorems. AS developed the model of self-activation. PS developed the combinatorial model of the Elowitz repressilator, auto-repression and all the illustrations. VS and AS proved all lemmas and theorems. MS and VS prepared the first draft of the manuscript. All authors were involved in the revision of the draft manuscript and have agreed to the final content.
Competing interests
No competing interests were disclosed.
Grant information
The author(s) declared that no grants were involved in supporting this work.
Faculty Opinions recommendedReferences
- 1.
Kim S, Li H, Dougherty ER, et al.:
Can Markov chain models mimic biological regulation?
J Biol Syst.
2002; 10(4): 337–357. Publisher Full Text
- 2.
Shmulevich I, Dougherty ER:
From Boolean to probabilistic Boolean networks as models of genetic regulatory networks.
Proc IEEE.
2002; 90(11): 1778–1792. Publisher Full Text
- 3.
Almeida L, Pechmann DR, Cechin AL:
Gene expression analysis using Markov chains extracted from rnns.
CLEI Electroni J.
2007; 10(2): 1–10. Reference Source
- 4.
Liang J, Han J:
Stochastic Boolean networks: an efficient approach to modeling gene regulatory networks.
BMC Syst Biol.
2012; 6(1): 113. PubMed Abstract
| Publisher Full Text
| Free Full Text
- 5.
Zhang SQ, Ching WK, Yue Jiao, et al.:
A simplified multivariate Markov chain model for the construction and control of genetic regulatory networks. In Bioinformatics and Biomedical Engineering, 2008. ICBBE 2008. The 2nd International Conference on. 2008; 569–572. Publisher Full Text
- 6.
Kauffman SA:
The origins of order: self-organization and selection in evolution. New York: Oxford University Press. 1993.
- 7.
Qian X, Dougherty ER:
Intervention in gene regulatory networks via phenotypically constrained control policies based on long-run behavior.
IEEE/ACM Trans Comput Biol Bioinform.
2012; 9(1): 123–36. PubMed Abstract
| Publisher Full Text
- 8.
Layek R, Datta A, Pal R, et al.:
Adaptive intervention in probabilistic boolean networks.
Bioinformatics.
2009; 25(16): 2042–8. PubMed Abstract
| Publisher Full Text
- 9.
Datta A, Choudhary A, Bittner ML, et al.:
External control in Markovian genetic regulatory networks: the imperfect information case.
Bioinformatics.
2004; 20(6): 924–30. PubMed Abstract
| Publisher Full Text
- 10.
Zhao W, Serpedin E, Dougherty ER:
Identifying genes involved in cyclic processes by combining gene expression analysis and prior knowledge.
EURASIP J Bioinform Syst Biol.
2009; 2009: 683463. PubMed Abstract
| Publisher Full Text
| Free Full Text
- 11.
Yousefi MR, Dougherty ER:
Intervention in gene regulatory networks with maximal phenotype alteration.
Bioinformatics.
2013; 29(14): 1758–67. PubMed Abstract
| Publisher Full Text
- 12.
Faryabi B, Vahedi G, Chamberland JF, et al.:
Optimal constrained stationary intervention in gene regulatory networks.
EURASIP J Bioinform Syst Biol.
2008; 2008: 620767. PubMed Abstract
| Publisher Full Text
| Free Full Text
- 13.
Faryabi B, Chamberland JF, Vahedi G, et al.:
Optimal intervention in semi-Markov-based asynchronous genetic regulatory networks.
American Control Conference.
2008; 1388–1393. Publisher Full Text
- 14.
Vahedi G, Faryabi B, Chamberland JF, et al.:
Optimal intervention strategies for cyclic therapeutic methods.
IEEE Trans Biomed Eng.
2009; 56(2): 281–91. PubMed Abstract
| Publisher Full Text
- 15.
Faryabi B, Vahedi G, Datta A, et al.:
Recent advances in intervention in Markovian regulatory networks.
Curr Genomics.
2009; 10(7): 463–77. PubMed Abstract
| Publisher Full Text
| Free Full Text
- 16.
Pal R, Bhattacharya S, Caglar MU:
Robust approaches for genetic regulatory network modeling and intervention: A review of recent advances.
IEEE Signal Process Mag.
2012; 29(1): 66–76. Publisher Full Text
- 17.
Hopfield JJ:
Neural networks and physical systems with emergent collective computational abilities.
Proc Natl Acad Sci U S A.
1982; 79(8): 2554–2558. PubMed Abstract
| Publisher Full Text
| Free Full Text
- 18.
Herz AV, Marcus CM:
Distributed dynamics in neural networks.
Phys Rev E Stat Phys Plasmas Fluids Relat Interdiscip Topics.
1993; 47(3): 2155–2161. PubMed Abstract
| Publisher Full Text
- 19.
Wang X, Jagota AK, Botelho F, et al.:
Absence of Cycles in Symmetric Neural Networks.
Neural Computation.
1998; 10(5): 1235–1249. Publisher Full Text
- 20.
Grossman T:
Applying the INN model to the Max-Clique problem. In D. S. Johnson and M. A. Trick, editors, DIMACS Series: Second DIMACS Challenge. American Mathematical Society, Providence, RI: Baltimore, MD. 1996; 125–145. Reference Source
- 21.
Jagota A:
The Hopfield-style network as a maximal-clique graph machine. Buffalo TR. State University of New York at Buffalo, Department of Computer Science, 1990. Reference Source
- 22.
Grossman T, Jagota A:
On the equivalence of two Hopfield-type networks. In International Symposium on Neural Networks. 1993; 2: 1063–1068. Publisher Full Text
- 23.
Jagota A:
Approximating maximum clique with a Hopfield network.
IEEE Trans Neural Netw.
1995; 6(3): 724–735. PubMed Abstract
| Publisher Full Text
- 24.
Jagota A:
Hopfield neural networks and self-stabilization.
Chicago J Theoretical Com Sci.
1999; 1999(6): 1–24. Reference Source
- 25.
Duffy NP, Jagota AK:
Generalized Connectionist Associative Memory. In International Joint Conference on Artificial Intelligence. 1999; 833–839. Reference Source
- 26.
Jagota A, Wang X:
Oscillations in Neural Systems, chapter Oscillations in Discrete and Continuous Hopfield Networks. Lawrence Erlbaum Associates, Mahwah, New Jersey. 2000; 369–388. Reference Source
- 27.
Alon U:
Network motifs: theory and experimental approaches.
Nat Rev Genet.
2007; 8(6): 450–61. PubMed Abstract
| Publisher Full Text
- 28.
Hertz J, Krogh A, Palmer RG:
Introduction to the theory of neural computation. Addison-Wesley Longman Publishing Co., Inc., Boston, MA, USA, 1991. Reference Source
- 29.
Madar D, Dekel E, Bren A, et al.:
Negative auto-regulation increases the input dynamicrange of the arabinose system of Escherichia coli.
BMC Syst Biol.
2011; 5(1): 111. PubMed Abstract
| Publisher Full Text
| Free Full Text
- 30.
Navarro P, Festuccia N, Colby D, et al.:
OCT4/SOX2–independent Nanog autorepression modulates heterogeneous Nanog gene expression in mouse ES cells.
EMBO J.
2012; 31(24): 4547–62. PubMed Abstract
| Publisher Full Text
| Free Full Text
- 31.
Gardner TS, Cantor CR, Collins JJ:
Construction of a genetic toggle switch in Escherichia coli.
Nature.
2000; 403(6767): 339–42. PubMed Abstract
| Publisher Full Text
- 32.
Kim J, White KS, Winfree E:
Construction of an in vitro bistable circuit from synthetic transcriptional switches.
Mol Syst Biol.
2006; 2: 68. PubMed Abstract
| Publisher Full Text
| Free Full Text
- 33.
Marucci L, Barton DA, Cantone I, et al.:
How to turn a genetic circuit into a synthetic tunable oscillator, or a bistable switch.
PLoS One.
2009; 4(12): e8083. PubMed Abstract
| Publisher Full Text
| Free Full Text
- 34.
Shmulevich I, Dougherty ER:
Probabilistic Boolean Networks: The Modeling and Control of Gene Regulatory Networks. SIAM e-books. Society for Industrial and Applied Mathematics. 2010. Publisher Full Text
- 35.
Elowitz MB, Leibler S:
A synthetic oscillatory network of transcriptional regulators.
Nature.
2000; 403(6767): 335–8. PubMed Abstract
| Publisher Full Text
- 36.
Shrivastava Y, Dasgupta S, Reddy SM:
Neural network solutions to a graph theoretic problem. In Circuits and Systems, 1990., IEEE International Symposium on. 1990; 4: 2528–2531. Publisher Full Text
- 37.
Jagota A, Narasimhan G, Šoltés L:
A Generalization of maximal independent sets.
Discrete Appl Math.
2001; 109(3): 223–235. Publisher Full Text
- 38.
Skonyakov PV, Shurygina AV:
Maghout method for enumeration of steady states of neural activity in a combinatorial model of an elementary excitatory-inhibitory divergent neural ensemble. Proceedings of The XVI International Conference on Neurocybernetics. Publishing office of Southern Federal University, Rostov-na-Donu. 2012; 199–202.
- 39.
Skornyakova Maria V:
Combinatorial net as a formalism for phase net forming model. In FENS Abstr. 2008; 4: 224.2. Reference Source
- 40.
Skonyakov PV:
Development of a program for the discrete mathematical modeling of gene regulatory networks, in particular, genetic oscillators. Proceedings of The Russian Youth Science School “Effective work on Phd thesis”. Publishing office of Southern Federal University, Rostov-na-Donu. 2012; 190–191.
- 41.
Skonyakov PV, Skonyakov VP, Skonyakova МV, et al.:
Software package Combinatorial.net for the study of gene regulatory networks by means of combinatorial models. Proceedings of The V Fifth International Scientific Conference “Actual problems of biology, nanotechnology and medicine”. Publishing office of Southern Federal University, Rostov-na-Donu. 2013; 42–44.
- 42.
Shurygina AV:
Probabilistic combinatorial network for modeling dynamics of gene expression. Proceedings of The Russian Youth Science School “Effective work on Phd thesis”. Publishing office of Southern Federal University, Rostov-na-Donu. 2012; 231–233.


Comments on this article Comments (0)