Introduction
The graph abstract data type is an important concept in mathematics and computer science, and is the most appropriate representation for several classes of real world phenomena and scientific constructions. Some examples of these include phylogenetic trees, protein-protein interaction networks and scientific ontologies such as the Gene Ontology1 and the Sequence Ontology2. One feature of this type of data structure is that they are much easier for humans to understand when presented as a graphical network which preserves the structured nature of the data, than when they are displayed flattened in tabular or list format. The component described here is capable of displaying graphs of data, in particular Directed Acyclic Graphs (DAGs), efficiently using JavaScript to calculate the layout, and features of modern web browers for rendering, and is designed to integrate with other components in the BioJS3 project.
Current methods and implementations
Two commonly used approaches for representing graphs in two dimensions, allowing display in HTML documents, are the force-directed layout, and the Sugiyama layout. These differ in the way that they represent the hierarchical organisation of elements within a graph, and are each suitable for different kinds of data.
Force-directed layouts distribute nodes throughout the available co-ordinate space, placing related nodes closer to each other, and unrelated nodes further away from each other. A typical method of achieving this is to model the layout as a two-dimensional particle simulation, where nodes exert a repulsive force upon each other, and edges between nodes exert an attractive force. Stable layouts are those representing local energy minima of the simulation.
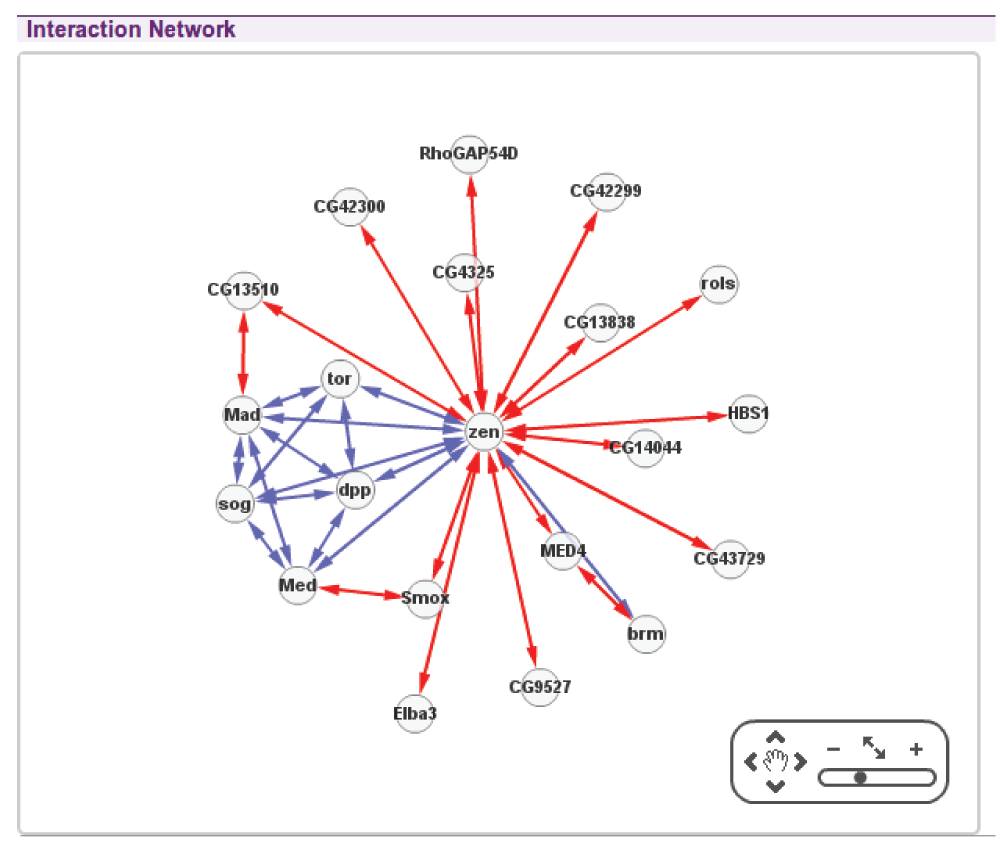
This method is straightforward to implement (see Cytoscape4 and D3 project5 for example JavaScript implementations), and is a suitable representation of graphs where we care more about the existence of edges than their directions, and more about identifying clusters of nodes than elucidating the internal structure of such clusters. For example in a protein-protein interaction network (see Figure 1) force-directed layouts are often used since they are good at indicating highly connected interactors and clusters of interactors, thus highlighting centrally significant parts of the graph.
The other commonly-used approach to rendering graphs visually is Sugiyama-style graph drawing6. This method also attempts to group related elements, but in addition it assigns significance to the structure of relationships by introducing the concept of root and rank. Rank is defined as the number of edges in the shortest path from a node to a root. A root is defined as a node of rank 0. When rendered, nodes of the same rank within a graph are aligned visually, either horizontally or vertically, producing a structured hierarchical layout of the graph.
This method requires edges to have a direction that indicates which side of the relationship is closer to the root. Such graphs are typically described as trees, and the nodes furthest from the root as leaves. This kind of representation is suitable for graphs in which the structure of relationships is important, which is a feature of several types of graphs, such as ontologies, and phylogenetic trees. Singly rooted, acyclic trees are the most straightforward structures to lay out and display, but this method can be applied to multiply rooted directed graphs with cycles (such as biochemical pathways).
Until now, using the Sugiyama method has required the generation of image files, either on demand or through batch preprocessing, and then sending them out over the network to a suitable display device. Several tools exist for this purpose, including GraphViz7, which is used by several projects for rendering Gene Ontology graphs. This requires any group wishing to employ this method for graphical network analysis to have access to the resources and expertise to manage either a server capable of dynamically generating such images, or to produce the images required in advance. In either case, user interaction is very limited.
What is new about the DAGViewer component is the use of a JavaScript Sugiyama layout engine to eliminate the image file generation, which cannot be done within a browser. Modern web browsers have advanced to the point where it is now practicable to calculate layouts for graphs of moderate size (in the order of around 200 to 500 nodes, depending on the density of connections) and render them in a dynamic hyper-text page, using tools such as JavaScript and Scaled Vector Graphics (SVG). This accounts for the great majority of networks that one might want to visualise, particularly since networks of greater information densities are very difficult for humans to interpret when rendered. We have taken advantage of the opportunity afforded by modern browser tools to produce a generic network display tool that does not require any server-side resources, and that is suitable for a variety of scientific purposes. This approach provides a much greater degree of customisation, interaction and flexibility than approaches based on image generation.
Features
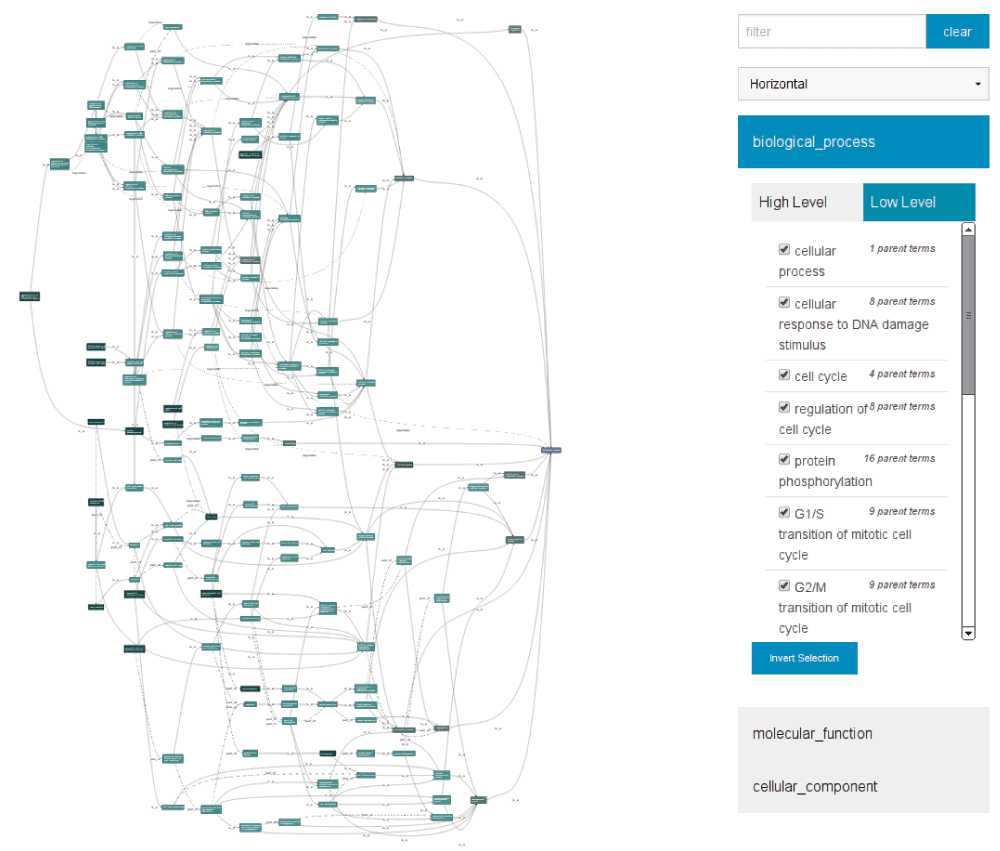
The graph viewer presented here uses a collection of publically available, open-source JavaScript tools, including the Backbone8 framework, the dagre-d39 layout engine, and D35 data-binding and presentation library. The combination of these tools make it possible to build a tool in JavaScript and running in modern browsers that provides rich interaction and graphical analysis possibilities, allowing users to focus on the data, e.g. in the Gene Ontology Annotation displayer in Figure 2.

Figure 2. The DAGViewer, displaying annotations (left) from the Gene Ontology for the Drosophila melanogaster gene cdc2, and the control panel (right).
The current implementation allows a JavaScript component to be placed on any page and be provided with any kind of linked network data; the data are rendered to the screen in the familiar box and line style of a Sugiyama graph drawing. Unlike static images, this graph can be zoomed, panned, reorientated and rescaled, allowing users to make sense of dense networks. Since the graph is rendered with SVG technology, rescaling does not lower graphical resolution, and text legibility is preserved over a wide range of zoom levels.
The user can interact more deeply with this representation than they could with a standard fixed image. Individual nodes and edges can each have their own styles and behaviour, allowing contextual tooltips and mousehover effects to provide information even when zoomed out. Since the information composing the graph is available to the page at runtime as a data-structure, it can be searched and filtered, and the graph can been zoomed and scaled to highlight particular nodes and edges that interest the user.
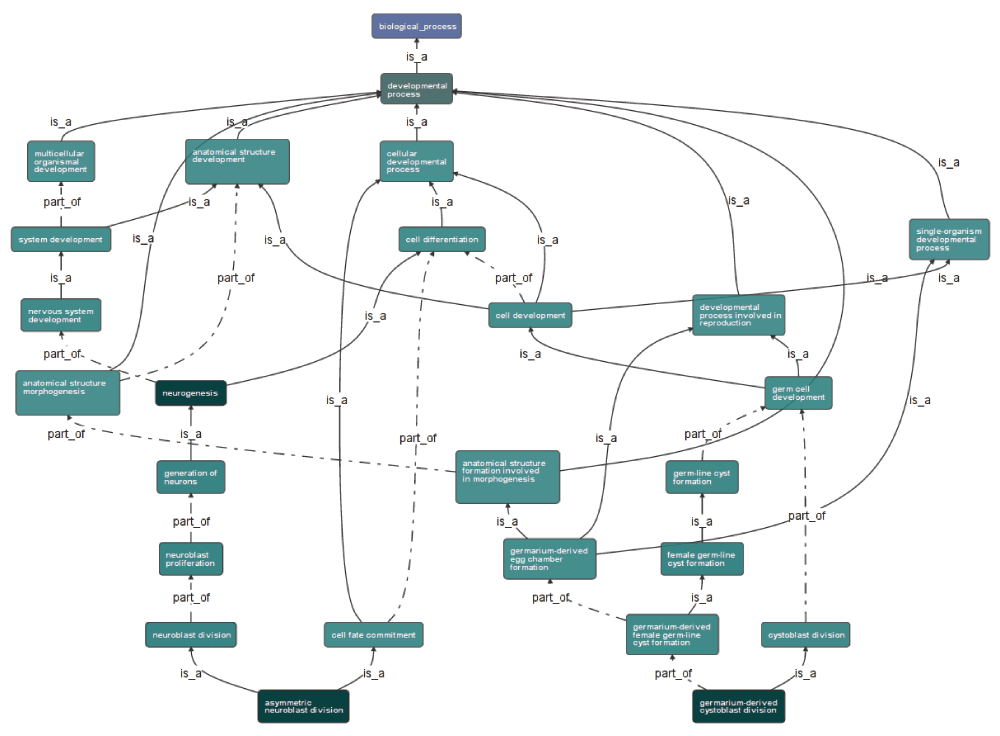
A control panel element (see Figure 2) provides access to this functionality, allowing users to search for nodes within the graph, and filter the graph to focus on relevant sub-sets of the available information. Figure 3 illustrates the display of one particular subgraph of the information presented in Figure 2, reorientated to make the best use of the available screen space. This particular subgraph is defined as those nodes reachable from one particular high-level ontology term, developmental process.
Installation
As a BioJS JavaScript component, the intended audience is web developers aiming to provide functionality for life scientists. It is expected to be deployed within HTML pages and rendered in modern browsers. As such, installation means indicating which resources a page needs to load. The DAGViewer tool is a modular javascript component, making use of other existing resources (Supplementary materials A); these dependencies need to be included on the page before the component itself can be used. Once these are loaded the BioJS DAGViewer component itself can be included (see code sample 1). This should be downloaded from the BioJS repository10 and hosted locally.
Listing 1. Loading the DAG-Viewer Library
<script src="Biojs.DAGViewer.js"></script>
Usage
With these elements available, a user is then able to instantiate a new DAGViewer component pointing at a defined element in the document object model (DOM), or page:
Listing 2. Instantiating a new DAGViewer Component
var viewer = new Biojs.DAGViewer({
  target: "element-id"
});
There are a large number of configurable parameters that can be provided at instantiation (or indeed, later). These mostly relate to configuring how to interpret the graph data provided. It is accepted that data may come in different formats, and rather than requiring users to convert their node and edge data to a predefined format, users can provide adapters that allow this component to read and display different kinds of graph data, while providing sensible defaults. More detail is provided on the BioJS registry documentation pages, but as an example consider a graph (representing a protein interaction network) which has nodes of the form:
Listing 3. Example Nodes
var nodes = [
  {primaryAccession: "P09089", name: "Protein
      zerknuellt 1"},
  {primaryAccession: "A0ANL0", name: null}
];
Here we will want to identify each node by its accession number (here from Uniprot) and label it by its name, if it has one, or by its accession if it does not. This behaviour can be defined by passing a couple of parameters:
Listing 4. Node Adaptor Example
var viewer = new Biojs.DAGViewer({
  target: "element-id",
  nodeLabels: ["name", "primaryAccession"],
  nodeKey: function (n) { return
      n.primaryAccession; }
});
Here the nodeLabels parameter indicates which fields should be read to obtain a label for this node, and the nodeKey parameter is a function that takes a node and returns an identifier (possibly computed). Similar configuration options exist for interpreting edges, determining the list of graph roots, providing style classes to nodes and edges and other functions.
Once configured, the component must be given the definition of the graph it is meant to visualise. A graph here is defined as two collections, one of nodes, and the other of edges between nodes. These can be unconnected data structures, such as loaded from JSON files, without interior references, or they may be circular self-referential data-structures, with edges pointing to their nodes. A small graph that represents a (grossly simplified) portion of the H. sapiens family tree, and the viewer to display it, could be configured as follows:
Listing 5. H. sapiens phylogenetic tree sample graph
var species = [
  {name: "H. sapiens", status: "extant"},
  {name: "H. neanderthalensis", status:
      "extinct"},
  {name: "H. heidelbergensis", status:
      "extinct"},
  {name: "H. erectus", status: "extinct"},
  {name: "H. ergaster", status: "extinct"},
  {name: "H. habilis", status: "extinct"}
];
var relationships = [
  {subject: species[0], ancestor: species[2]},
  {subject: species[1], ancestor: species[2]},
  {subject: species[2], ancestor: species[4]},
  {subject: species[3], ancestor: species[4]},
  {subject: species[4], ancestor: species[5]}
];
var viewer = new Biojs.DAGViewer({
  target: "element-id",
  nodeLabels: ["name"],
  nodeKey: function (n) { return n.name; },
  edgeProps: ["subject", "ancestor"]
});
viewer.setGraph({
  nodes: species,
  edges: relationships
});
As well as defining the data model, this component allows applications to respond to user input. An example of this is responding when a user clicks on a node in the graph. In the case of our human ancestry graph, that might look like this:
Listing 6. Listening for Events
viewer.addListener(
  "click:node",
  function (name, species) {
   alert(name + " is " +
      species.get("status"));
 }
);


Comments on this article Comments (0)