Keywords
once-daily regimen, twice-daily regimen, cost-effectiveness, HIV
once-daily regimen, twice-daily regimen, cost-effectiveness, HIV
Sub-Saharan Africa (SSA) is the region most heavily affected by human immunodeficiency virus (HIV)1. It is estimated that in 2012, as much as 68% of all people infected with HIV were living in SSA, and about 20% of all deaths and disability adjusted life years (DALYs) lost in Africa are due to HIV or acquired immunodeficiency syndrome (AIDS)1. The overarching aim of the antiretroviral therapy is to achieve optimal suppression of viral load, preserve immune functions and ultimately improve quality of life and reduce overall mortality2. The use of ART among people living with HIV has led to significant reduction in morbidity and mortality associated with HIV by slowing down the disease progression3. However, it is important to note that for the ART to effective, its clinical success depends on optimal adherence to the regimens4. It has been documented that optimal adherence to ART is associated with good viral suppression, slowing of disease progress and reduced all-cause mortality in people living with HIV5,6. Regimen simplification of ART, by administering them less frequently, has been suggested as a practical approach to improve adherence and patient convenience7. Recently, major advances have been made towards simplifying ART regimens. One of the most important advances is decreasing the dosing frequency and pill burden from more than 10 tablets to a one table once a day (QD) fixed dose combination4.
While the literature has focused on the effectiveness of QD versus twice a day (BID) regimens7–20, little interest has been paid to the economic evaluations21–25. Economic evaluation provides a useful framework to assist policy makers in allocating resources across competing needs. To the best of our knowledge, there have been no recent attempts to assess the likely cost-effectiveness of QD versus BID regimen from sub-Saharan’s perspective. Therefore, the objective of this study was to determine the cost-effectiveness of QD versus BID antiretroviral regimen in the HIV treatment.
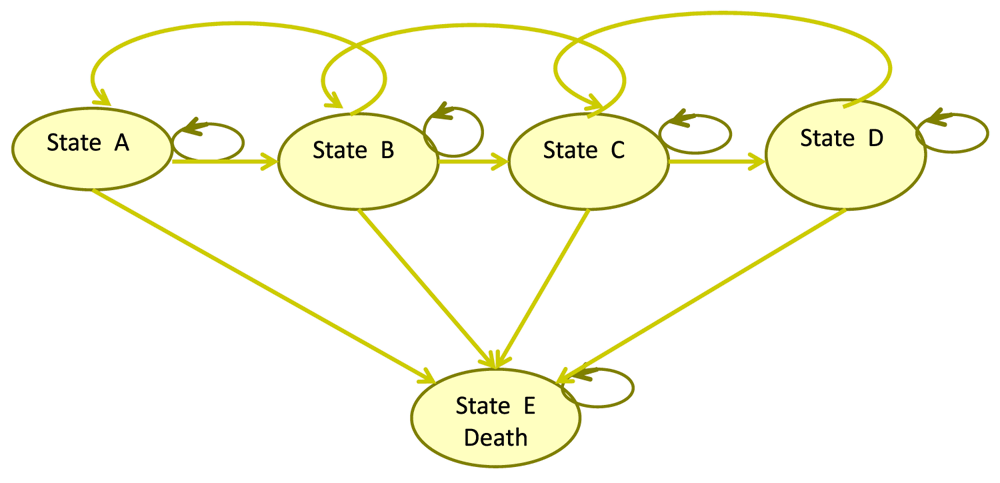
We developed a computer-based mathematical model of HIV infection to simulate the effect of QD versus BID regimen (Figure 1). The model is a traditional Markov stage-transition model26, which was used to extrapolate the costs and health outcomes over the lifetime of patients. The analysis was performed from a societal perspective, where both all direct and indirect cost was considered. Health outcomes and cost accrued beyond 1 year was discounted at 3.5%, to adjust for future costs and health benefits and expresses them in terms of their present values27. Based on recent clinical guidelines for the use of ART in HIV-infected individuals, the Markov model has five health states to represent the progression through HIV disease states to death28,29:
1) State A: HIV positive, asymptomatic, non-AIDS, CD4 >350 cells/μL;
2) State B: HIV positive, asymptomatic, non-AIDS, CD4 >200 cells/μL, but ≤350 cells/μL;
3) State C: HIV positive, asymptomatic, AIDS, CD4 <200 cells/μL;
4) State D: HIV positive, symptomatic AIDS or severe symptoms; and
5) State E: Death (age- and disease-related). People living with HIV may either die from HIV-related causes or from any other causes.

State A: HIV positive, asymptomatic, non-AIDS, CD4 > 350 cells/μL; State B: HIV positive, asymptomatic, non-AIDS, CD4 >200 cells/μL, but ≤350 cells/μL; State C: HIV positive, asymptomatic, AIDS, CD4 <200 cells/μL; State D: HIV positive, symptomatic AIDS or severe symptoms.
Patients can remain in the same state, progress or retreat from an AIDS state to a non-AIDS state. The final state is E, death. The Markov model was based on a cohort of 1,000 hypothetical individuals, and a cycle length of one year was applied and simulated over 20 years.
Parameter estimates were extracted from published data30–34(http://www.msfaccess.org/content/untangling-web-antiretroviral-price-reductions-17th-edition-%E2%80%93-july-2014). We conducted a series of focused literature searches in PubMed and Google Scholar to identify appropriate model input parameters to populate the model. The search terms included the following: “once-daily”, “fixed-dose combination”, “twice-daily”, “adherence”, “transition probabilities”, “HIV treatment costs”. Table 1 presents the model input parameters and their sources. Costs of treatment were incurred in US dollars and were adjusted for inflation; these were inflated to 2015 prices using a price inflation index (http://www.bls.gov/data/inflation_calculator.htm).
| Parameter | Base case scenario | Range (Best-case – Worst case scenarios) | Probability distribution | Reference |
|---|---|---|---|---|
| Baseline population | ||||
| State A | 0.38 | 0.35–0.41 | Beta | Goshu32 |
| State B | 0.28 | 0.26–0.31 | Beta | Goshu32 |
| State C | 0.23 | 0.21–0.26 | Beta | Goshu32 |
| State D | 0.11 | 0.09–0.13 | Beta | Goshu32 |
| State E | 0.00 | 0.00–0.00 | Beta | Goshu32 |
| Annual total medical cost (US$)* | ||||
| State A | 18,314 | 13,736–22,893 | Gamma | Alistar, Athan & MSF31,33 |
| State B | 25,501 | 19,126–3,1876 | Gamma | Alistar, Athan & MSF31,33 |
| State C | 39,862 | 29,897–49,828 | Gamma | Alistar, Athan & MSF31,33 |
| State D | 48,215 | 36,161–60,269 | Gamma | Alistar, Athan & MSF31,33 |
| State E | 0.00 | 0.00–0.00 | Gamma | Alistar, Athan & MSF31,33 |
| Mean drug cost** | ||||
| BID regimen | 638 | 478–798 | Gamma | CHAI |
| QD regimen | 610 | 458–763 | Gamma | CHAI |
| QALY | ||||
| State A | 0.90 | 0.66–1.00 | Uniform | Tengs30 |
| State B | 0.90 | 0.66–1.00 | Uniform | Tengs30 |
| State C | 0.75 | 0.63–0.87 | Uniform | Tengs30 |
| State D | 0.56 | 0.55–0.80 | Uniform | Tengs30 |
| State E | 0.00 | 0.00–0.00 | Uniform | Tengs30 |
| Probabilities*** | ||||
| State A to B | 0.132 | 0.120–0.144 | beta | Goshu32 |
| State A to C | 0.013 | 0.009–0.018 | beta | Goshu32 |
| State A to D | 0.002 | 0.000–0.004 | beta | Goshu32 |
| State A to E | 0.002 | 0.000–0.004 | beta | Goshu32 |
| State B to A | 0.251 | 0.229–0.272 | beta | Goshu32 |
| State B to C | 0.153 | 0.134–0.172 | beta | Goshu32 |
| State B to D | 0.006 | 0.003–0.010 | beta | Goshu32 |
| State B to E | 0.003 | 0.001–0.006 | beta | Goshu32 |
| State C to A | 0.030 | 0.022–0.040 | beta | Goshu32 |
| State C to B | 0.223 | 0.200–0.247 | beta | Goshu32 |
| State C to D | 0.085 | 0.070–0.101 | beta | Goshu32 |
| State C to E | 0.005 | 0.002–0.009 | beta | Goshu32 |
| State D to A | 0.005 | 0.001–0.010 | beta | Goshu32 |
| State D to B | 0.012 | 0.006–0.019 | beta | Goshu32 |
| State D to C | 0.164 | 0.142–0.188 | beta | Goshu32 |
| State D to E | 0.022 | 0.019–0.033 | beta | Goshu32 |
| Relative risk QD vs BID**** | 0.95 | 0.91 to 1.00 | logNormal | Nachega34 |
| Discount rate (%) | 3.5 | 2.0–5.0 | uniform | Assumed |
*both direct and indirect cost; **per patient-year of treatment; ***annual transitional probabilities for BID regimen; ****relative risk of QD versus BID for virologic suppression
† State A: HIV positive, asymptomatic, non-AIDS, CD4 > 350 cells/μL; State B: HIV positive, asymptomatic, non-AIDS, CD4 >200 cells/μL, but ≤350 cells/μL; State C: HIV positive, asymptomatic, AIDS, CD4 < 200 cells/μL; State D: HIV positive, symptomatic AIDS or severe symptoms.
CHAI - http://hdl.handle.net/1902.1/18843
In the base-case scenario, all model parameters assumed best values from the published literature. In the best and worst case scenarios, the parameters were set to values more favourable and less favourable to QD regimen respectively.
The values of HIV-related utility scores and quality-adjusted life years (QALYs) stratified by CD4 are also shown in Table 1. The antiretroviral naïve HIV patient is assumed to have a better initial response to medication therapy than individuals who have received previous antiretroviral treatment. Transition probabilities of naïve HIV patient between the five states for twice-daily regimen were extracted from the literature. The transition probabilities for the QD regimen were based on an adjustment to the baseline values, according to the treatment effect of BID regimen relative to QD regimen. This treatment effect took the form of a relative risk, which was derived from a meta-analysis of treatment naïve patients34.
In order to examine the uncertainty around the robustness of the input parameters, a sensitivity analysis was performed on the parameters. One-way sensitivity analysis was performed on a deterministic parameter by varying all the input parameters at lower and higher values at 25%. In the best and worst case scenarios, the parameters were set to values more favourable and less favourable to QD regimen respectively. We also performed a probabilistic sensitivity analysis to assess parameters uncertainty in the model using the using the Monte Carlo technique35, were model parameters were varied according to their intrinsic distributions. beta distribution was used for all probabilities. All costs were assumed to follow a normal distribution. Uniform distribution was used for utilities, discount, and time horizon. Results were based on 10,000 Monte Carlo simulations35.
Results were presented as mean incremental costs and effects, incremental cost-effectiveness ratio (ICER), cost-effectiveness planes (CE-plane) and cost-effectiveness acceptability curves (CEACs). CEACs provides a measure of the likelihood that a decision to apply a given intervention is correct across a range of ‘willingness-to-pay’ thresholds36. ‘Willingness-to-pay’ in this context represents the maximum amount a decision maker is prepared to pay for a gain of one QALY. The WHO-CHOosing Interventions that are Cost Effective (CHOICE) Working Group threshold for Africa region was adopted37,38. An intervention was defined as follows: very cost-effective, ICER < GDP per capita ($1,695); cost-effective, ICER = 1–3 × GDP per capita ($1,695 to $5,086); and not cost-effective, ICER is > 3 × GDP per capita ($5,086)37,38.
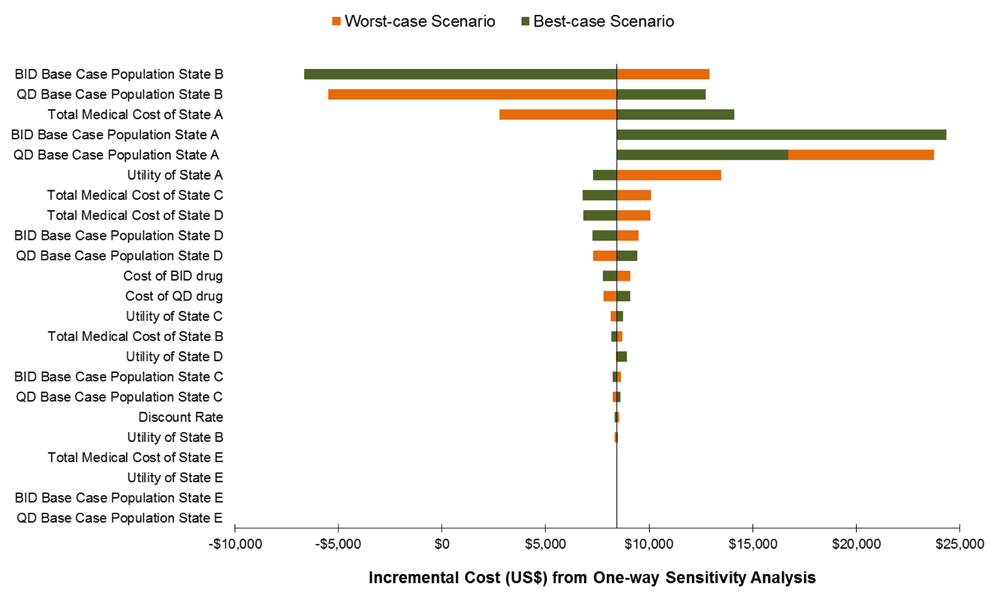
The expected costs and QALY gained generated from the model are shown in Table 2. At base-case values for all parameters, when all parameters assumed best values from the published literature, the total number of QALY gained by regimen simplification was 0.27. The base case was associated with an incremental cost of $2,147. The incremental cost-effectiveness ratio of QD versus BID regimen was $8,102/QALY gained. Figure 2 shows the result of one-way sensitivity analysis when one parameter value was varied at a time, while holding other parameters at their base-case values. However, incremental cost was most sensitive to the variations in the total medical cost of state A, total medical cost state D, utility of state A and total medical cost of state C. The incremental cost ranged from $2,352 to $13,822 when total medical cost of state A varied from $13,736 to $22,893 and ICER could increase to as much as $38,314/QALY gained.
| Regimen | Cost | Incremental cost (ΔC) | QALY | Incremental QALY (ΔQ) | ICER (ΔC/ΔQ) |
|---|---|---|---|---|---|
| BID | $275,017.02 | - | 8.630 | - | - |
| QD | $ 277,164.06 | $ 2,147.04 | 8.896 | 0.265 | 8102.04 |

State A: HIV positive, asymptomatic, non-AIDS, CD4 > 350 cells/μL; State B: HIV positive, asymptomatic, non-AIDS, CD4 >200 cells/μL, but ≤350 cells/μL; State C: HIV positive, asymptomatic, AIDS, CD4 <200 cells/μL; State D: HIV positive, symptomatic AIDS or severe symptoms. The y-axis shows the model parameter that was varied. The bars indicate the change in the incremental cost caused by changes in the value of the indicated variable holding all other parameters similar. All costs are in 2015 US dollars.
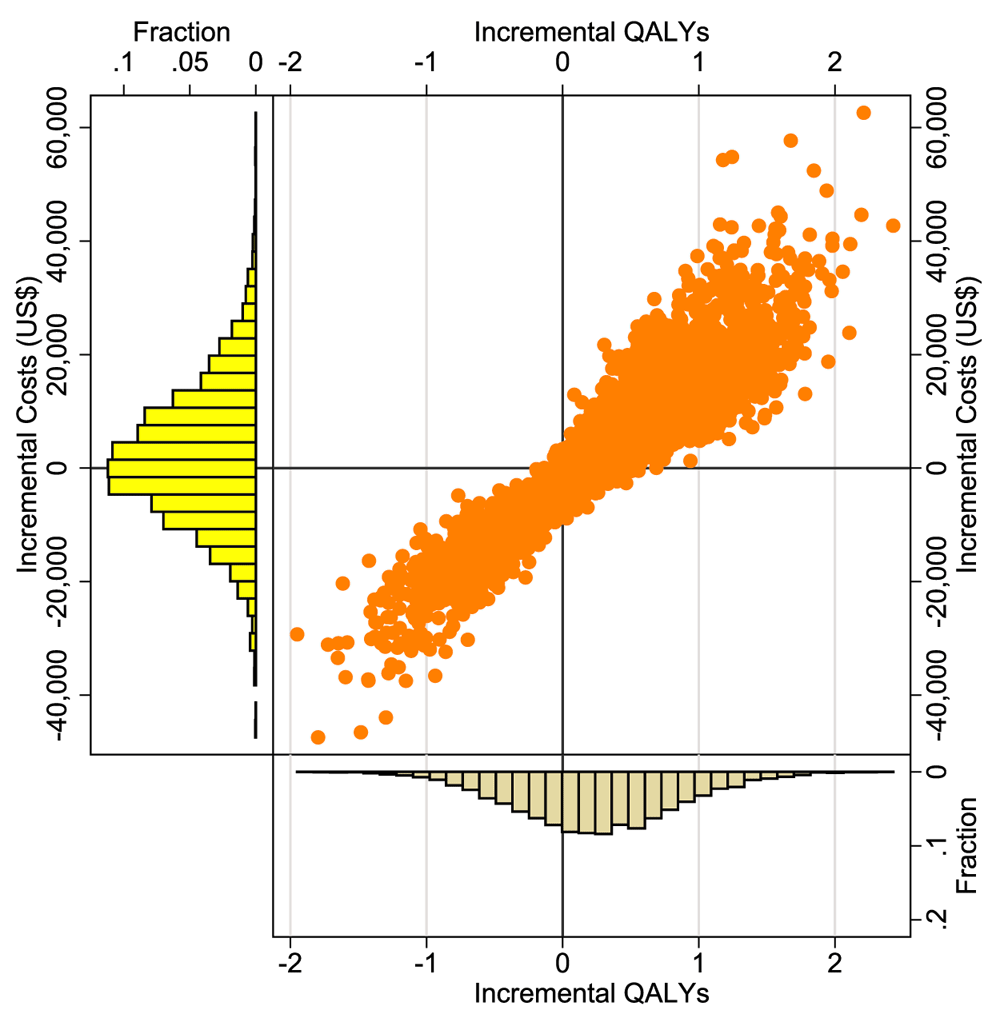
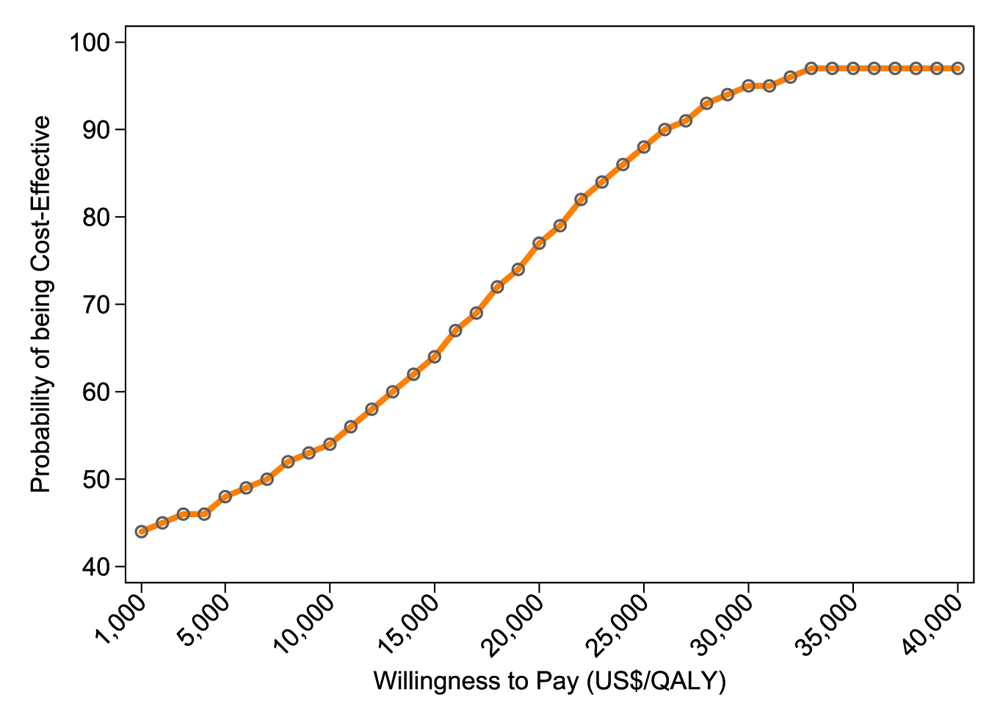
Incremental cost and QALYs are plotted on a scatter plot, as shown in the CE plane in Figure 3. About 60% of incremental cost-effect pairs fall in the northeast quadrant, indicating that the QD regimen is more costly and more effective than the BID regimen. The remaining 40% of the points lie in the southwest quadrant, indicating that QD regimen saves money, although is still less effective compared to the BID regimen. Figure 4 presents the cost-effectiveness acceptability curves (CEACs) for the incremental cost per QALY gained. As shown in Figure 4, if decision-makers were willing to pay $1,000 per QALY gained, the probability of QD being cost-effective was 44%. The probability of QD regimen being cost-effective was 48% when the willingness to pay was $5,000.

QALY – Quality Adjusted Life Years.

QALY – Quality Adjusted Life Years.
Poor adherence to ART can lead to virological failure, poor clinical outcome, and diminish future treatment options5,6,39. Ensuring adherence to prescribed ART continues to be a major public health concern. To the best of our knowledge, this is the first economic evaluation that evaluates the cost effectiveness of QD HAART regimen versus BID regimen from a sub-Saharan societal perspective. Compared with the BID regimen, the increase cost-effectiveness ratio of the QD regimen ($8,102/QALY gained) exceeds the WHO-CHOICE willingness to pay threshold (three times the country’s per capita GDP: $5,086)37,38. The incremental cost-effectiveness ratio was most sensitive to variations in the total medical cost of state A, total medical cost state D, utility of state A and total medical cost of state C.
The results of cost-effectiveness of QD versus BID literature have been mixed, while some studies demonstrated that regimen simplification to be cost-effective21–23, other found it not be cost-effective24,25. Fogolia and colleagues estimated the lifetime cost utility of QD regimens versus BID regimens in Italian human immunodeficiency virus (HIV)-infected patients naïve to treatment using a Markov microsimulation model24. Fogolia showed a cost-utility value advantage for twice-daily over QD regimen. Walensky conducted an economic evaluation of a three pill generic antiretroviral therapy and demonstrated cost-saving of such a regimen25. Similarly, Walensky and co-researchers found that generic antiretroviral therapy will be cost-saving in the USA25. Brogan and colleagues found that the QD regimen was more effective and cost-saving compared with the BID regimen in people living with HIV that are treatment naïve21.
Our Markov model incorporated a probabilistic sensitivity analysis to give a comprehensive estimate of uncertainty associated with model parameters. Compared with a cost-effectiveness study conducted alongside a trial, this model-based approach has several advantages; we combined evidence from several sources and also conducted different sensitivity analyses40. However, our analysis also has some limitations. There were a few parameters for which data from low-middle income countries (LMIC) were not available, and we had to rely on data from the high-income countries or make simplifying assumptions. Another limitation includes uncertainty in parameter values and the demonstrated sensitivity of the results to changes in some parameter values. All model input parameters used in the model were extracted from the published literature, and although there are intrinsic uncertainties associated with these parameters, there were, however, modelled appropriately. We conducted a probabilistic sensitivity analysis to concurrently assess the impact of these model input parameters41. Our model was also limited by the assumptions about the mechanism of HIV disease progression.
From a sub-Saharan Africa country societal perspective, the QD HAART regimen cannot be regarded as cost-effective. However, there is considerable decision uncertainty, driven particularly by the variations in the total medical cost of state A (asymptomatic, non-AIDS, CD4 >350 cells/μL), total medical cost state D (symptomatic AIDS or severe symptoms), and utility of State A; future research should focus on reducing uncertainty in these parameters. Findings from the economic evaluation are important for LMIC as they consider whether to adopt the new branded single tablet regimen. Generic-based ART could yield substantial budgetary saving to HIV programmes in LMIC.
Dataset 1: Raw data for Table 1, Model parameters., 10.5256/f1000research.9954.d14242342
Dataset 2: Raw data for Figure 2, Tornado plot for incremental plot., 10.5256/f1000research.9954.d14242443
Dataset 3: Raw data for Figure 3, Incremental cost-effectiveness plane for once daily (QD) versus twice-daily regimen (BID)., 10.5256/f1000research.9954.d14242544
Dataset 4: Raw data for Figure 4, Cost-effectiveness acceptability curve for once daily (QD) versus twice-daily regimen (BID)., 10.5256/f1000research.9954.d14242645
MBS and OAU were responsible for conception and design of the research. Acquisition of data was carried out MBS and OAU. Economic modelling and statistical analysis were carried out by MBS and OAU. MBS, OAU and JBN were responsible for review, analysis and interpretation of the outcomes. MBS, OAU and JBN were responsible for development of the manuscript. MBS, OAU and JBN were responsible for critical revision of the manuscript for important intellectual content. All authors read and approved the final manuscript.
| Views | Downloads | |
|---|---|---|
| F1000Research | - | - |
|
PubMed Central
Data from PMC are received and updated monthly.
|
- | - |
Competing Interests: No competing interests were disclosed.
Competing Interests: No competing interests were disclosed.
Alongside their report, reviewers assign a status to the article:
| Invited Reviewers | ||
|---|---|---|
| 1 | 2 | |
|
Version 1 16 Nov 16 |
read | read |
Click here to access the data.
Spreadsheet data files may not format correctly if your computer is using different default delimiters (symbols used to separate values into separate cells) - a spreadsheet created in one region is sometimes misinterpreted by computers in other regions. You can change the regional settings on your computer so that the spreadsheet can be interpreted correctly.
Provide sufficient details of any financial or non-financial competing interests to enable users to assess whether your comments might lead a reasonable person to question your impartiality. Consider the following examples, but note that this is not an exhaustive list:
Sign up for content alerts and receive a weekly or monthly email with all newly published articles
Already registered? Sign in
The email address should be the one you originally registered with F1000.
You registered with F1000 via Google, so we cannot reset your password.
To sign in, please click here.
If you still need help with your Google account password, please click here.
You registered with F1000 via Facebook, so we cannot reset your password.
To sign in, please click here.
If you still need help with your Facebook account password, please click here.
If your email address is registered with us, we will email you instructions to reset your password.
If you think you should have received this email but it has not arrived, please check your spam filters and/or contact for further assistance.
Comments on this article Comments (0)