Keywords
ketamine, depression, mTOR, data robustness, data sharing
This article is included in the Preclinical Reproducibility and Robustness gateway.
ketamine, depression, mTOR, data robustness, data sharing
Intravenous ketamine has been shown to induce a rapid and long-lasting antidepressant effect in treatment-resistant patients (Zarate et al., 2006a) and the results have been replicated by several groups (Aan Het Rot et al., 2012). Intravenous route of administration as well as concerns due to psychotomimetic potential of ketamine have triggered a search for alternative medications with improved safety and pharmacokinetic profiles. Ketamine is usually described in the literature as an antagonist acting at N-methyl-d-aspartate (NMDA) subtype of glutamate receptors, and pilot clinical data indicated that its antidepressant effects may be shared at least to some extent by other drugs from this class (e.g. CP 101,606; Preskorn et al., 2008). However, other non-competitive NMDA receptor antagonists appear to lack ketamine’s efficacy at least at the doses free from psychotomimetic effects (memantine: Zarate et al., 2006b; AZD-6765: Sanacora et al., 2014). These controversial findings have called for a deeper understanding of specific biological mechanisms of ketamine’s action.
Li et al. (2010) presented a set of data indicating that, in rats, antidepressant-like action of ketamine may be mediated by the activation of mTOR-dependent intracellular cascades. The phosphatidylinositol 3-kinase (PI3K)–Akt–mTOR pathway responds to a variety of growth factors and mitogenic signals and, when activated, mTOR has multiple functions including facilitated translation of proteins involved in synaptic plasticity and memory. In the study by Li et al. (2010), acute injection of ketamine activated the mTOR pathway, leading to increased synaptic signaling proteins and increased number and function of new spine synapses in the prefrontal cortex of rats. Therefore, assuming that something similar can occur in humans, these data may indeed explain why acute infusion of ketamine produces such long-lasting effects in patients with major depression.
As these results were reproduced by the same group (Liu et al., 2013) as well as by other academic groups (Yang et al., 2013), ketamine-induced mTOR activation seemed to be a robust finding worth further exploration. These effects were observed under a variety of experimental conditions (e.g. using fresh and frozen tissue; Li et al., 2010; Paul et al., 2014) and appeared to be quite robust (note low sample sizes in some of the studies: n=3 in Paul et al., 2014; n=4 in Li et al., 2010).
Therefore, without any coordination or pre-existing agreement, research labs at AbbVie, Servier, Pfizer and Alkermes started independent experiments aiming to reproduce and extend published evidence.
Animals. Male Sprague-Dawley rats (150–250 g, Charles River, Germany) were pair-housed, had access to food and water ad libitum and were maintained on a 12-h light/dark cycle in standard cages. Experimental procedures were approved by AbbVie’s Animal Welfare Office (Ludwigshafen, Germany) and were performed in accordance with the European and German national guidelines as well as the recommendations and policies of the U.S. National Institutes of Health “Principles of Laboratory Animal Care”. Animal housing and experiments were conducted in facilities fully accredited by the Association for Assessment and Accreditation of Laboratory Animal Care (AAALAC).
Drug administration and harvesting of tissue. Ketamine was purchased either as a 10% solution (WDT, Garbsen, Germany) or as a powder from Sigma-Aldrich (Cat. No.: K2753) and prepared according to the Ketaset® solution (100 mg/mL ketamine and 0.1 mg/mL benzethonium chloride as a preservative in AMPUWA water [Fresenius Cat.No.: 1080153] at a slightly acid solution [pH=3.5 to 5.5]). The animals were given different ketamine concentrations intraperitoneal (i.p.) either one hour or three hours before being killed or different ketamine concentrations intravenous three hours before being killed. Thirty minutes after ketamine administration some animals underwent a forced swim test. Animals were either killed with an overdose of isoflurane or with a guillotine without anesthesia. The prefrontal cortex, cerebral cortex and/or the hippocampus were dissected from the brain on ice. The brain samples were immediately frozen and stored at -80°C for further analysis.
Preparation of synaptosomal fraction and Western blotting. The brain samples were kept on ice during all stages of the preparation. The tissue was homogenized in 8µl preparation buffer per mg tissue. The preparation buffer contained 10 mM Tris-HCl, 0.32 M sucrose, protease inhibitor complete tablets mini with EDTA (Roche Cat. No.: 04693124001) and phosphatase inhibitor cocktail III (according to the Calbiochem mixture: 10 mM NaF, 0.2 mM Sodium Orthovanadate, 2 mM Sodium Pyrophosphate decahydrate, 2 mM Glycerophosphate). The brain samples were homogenized with a Teflon-glass tissue grinder (pre-cooled, clearance 0.25 mm) with 10 even strokes (one stroke equals one up and one down action; the first stroke was about 5 s and subsequent strokes around 3–4 s) using a motor-driven pestle at 650 rpm. The homogenate was centrifuged 5 min at 1000 × g and contained a pellet (P1), which was discarded and the supernatant (S1).
For the crude synaptosomes the supernatant (S1) was centrifuged for 30 minutes at 15,000 × g. The resulting pellet was resuspended in ~20µl preparation buffer. The protein concentration was determined by the BCA protein assay according to the manufacturer’s instructions (Thermo Scientific Cat. No.: 23227).
For the synaptosomal fraction of the Percoll method the supernatant (S1) was transferred to a discontinuous Percoll-Gradient containing layers (2%, 6% and 23% Percoll [Sigma-Aldrich Cat.No.: 77237-500ml] in preparation buffer) and centrifuged for 5 min at 33000 × g. The layer between 6% and 23% Percoll (synaptosomal fraction) was collected and diluted with preparation buffer at least 4 times the collected volume and centrifuged for 10 min at 33000 × g. The resulting pellet (P2) contained the synaptosomal fraction and was resuspended in preparation buffer. The protein concentration was determined by the BCA protein assay according to the manufacturer’s instructions (Thermo Scientific Cat.No.: 23227).
For Western blotting, equal amounts of protein (24 µg) for each sample were boiled in an E-PAGETM loading buffer (Invitrogen Cat.No.: EPBUF-01)/NuPAGE sample reducing agent (Invitrogen Cat.No.: NP0009) for 5 minutes, cooled down and applied on the E-PAGETM 48 8% gel (Invitrogen Cat.No.: EP048-08). The electrophoresis was run on an Invitrogen electrophoresis device either a Mother E-BaseTM device connected to a power source or a Daughter E-BaseTM connected to a Mother E-BaseTM. Two standard samples (MagicMarkTM XP Western Protein Standard [Invitrogen Cat.No.: LC5602] [marker] and SeeBlue® Plus2 Pre-stained Protein Standard [Invitrogen Cat.No.: LC5925] [marker]) were run in parallel to the samples for 24 minutes. After completion of the run the gel was removed and subjected to the Invitrogen semi-dry blotting procedure. Proteins were transferred to a nitrocellulose blotting membrane with a pore size of 0.2 microns (Invitrogen Cat.No.: IB3010-01). The membrane was dried and stored at 4°C for further analysis.
For the following steps the Invitrogen WesternBreeze Chemiluminescent Western Blot Immunodetection Kit for primary antibodies made in mouse (Invitrogen Cat. No.: WB7104) or for primary antibodies made in rabbit (Invitrogen Cat. No.: WB7106) was used. The membrane was allowed to come to room temperature, incubated 30 minutes in a blocking solution from the kit on a shaker, washed twice with deionized water and incubated with a Primary Antibody Solution for at least 1 hour at room temperature on a shaker. The membrane was washed four times for 5 minutes with a prepared Antibody Wash (included in the kit) and incubated in a Secondary Antibody Solution for 30 minutes. After washing the blots four times with Antibody Wash and rinsing it twice with deionized water the bands were detected using the Chemiluminescent Substrate Solution (included in the kit). The chemiluminescense intensity of the bands was quantified by a CHEMI DOC XRS imaging system (Bio-Rad Laboratories GmbH, Munich, Germany) utilizing an Universal Hood II enclosure.
The following proteins were analyzed for samples taken 1 hour after ketamine injection: phospho-p70S6 Kinase, phospho-Akt (Ser 473), Arc (C-7), phospho-mTor (Ser2448), phospho-S6 Ribosomal Protein (Ser 235/236) and phospho-p44/42 MAP Kinase (Erk1/2) (Thr 202/Tyr 204). The following markers were analyzed for samples taken 3 hours after ketamine application: Arc(C-7), Synapsin I, GluR-1 (E-6), phospho-S6 Ribosomal Protein (Ser 235/236) and PSD-95 (7E3). For details see Table 1 and Table 2.
* conditions and markers reported by Li et al. (2010)
Animals. Male Sprague-Dawley rats (150–200 g, Charles River, Wilmington, MA, USA) were pair-housed and allowed to acclimate for three days before handling. Animals had access to food and water ad libitum and were maintained on a 12-h light/dark cycle in standard cages. All procedures related to animal care and treatment were conducted under an Institutional Animal Care and Use Committee-approved protocol, according to the guidelines of the National Research Council Institute for Laboratory Animal Research Guide for the Care and Use of Laboratory Animals and the US Department of Agriculture Animal Welfare Act and Animal Welfare Regulations.
Drug administration and tissue collection. Ketamine HCl (Ketaset® 100 mg/mL; Fort Dodge Animal Health, IA, USA) was used to prepare a 10 mg/mL solution in sterile 0.9% saline for injection. Rats received a single acute i.p. dose of either ketamine solution or saline appropriate for their body weight. Animals were sacrificed by live decapitation at 0.5, 1, 2, 6, or 24 hours post dose (n=5). Brains were removed and placed on wet ice for immediate dissection and homogenization, while trunk blood was collected in EDTA tubes to measure drug concentrations.
Preparation of synaptosomal fraction and Western blotting. The brains were removed and prefrontal cortex was hand dissected on wet ice. The tissues were placed directly into tubes containing 1 mL of cold Buffer A (Li et al., 2010) and the tube contents (tissue and buffer) were poured directly into a dounce homogenizer and manually dounced 5 times on ice. The homogenized samples were centrifuged at 614 × g for 10 minutes at 4°C (P1 sample is the pellet). The supernatant was removed and centrifuged at 11,269 × g for 10 minutes at 4°C (P2 is the pellet). The supernatant was removed and fresh RIPA buffer (Li et al., 2010) was added to the pellet (400 μL) just prior to probe sonication. The sonicated samples were centrifuged for 1 minute at the maximum speed of a table top centrifuge (approximately 14000 rpm) and a protein assay was run on the supernatants to normalize gel loading. The samples (15 μg per well) were run on a 4–20% gradient tris-glycine gel and then wet transferred to nitrocellulose membranes for Western blotting. Blots were scanned on an Odyssey 9120 infrared scanner (Li-Cor, Lincoln, NB, USA). Local background was subtracted from all bands prior to normalizing each phospho-protein of interest to its control. For details on the antibodies being used see Table 1.
Animals. Adult male Sprague Dawley rats (300–400g; Charles River, France) were housed in pairs in a temperature controlled room with food and water ad lib and under a 12-h light/dark cycle with lights on from 8 am. All procedures were performed in conformity with the National (JO 887-848) and European (86/609/EEC) legislations on animal experimentation.
Drug administration and harvesting of tissue. Animals were anesthetized with pentobarbital (60 mg/kg ip); ketamine was administered (10 mg/kg i.p.; ketamine hydrochloride, LGC Standards) immediately after. Animals were sacrificed 30 min after ketamine administration under isoflurane anesthesia. Brains were dissected into medial and lateral cortices, dorsal and ventral hippocampi and were snap frozen as previously described (Svenningsson et al., 2000) and stored at -80°C until processed.
Preparation of synaptosomal fraction and Western blotting. The cortical samples were sonicated in 1% sodium dodecyl sulfate (SDS), 10mM NaF, transferred to Eppendorf tubes and boiled for 10 min. The protein concentration in each sample was thereafter determined with a BCA-based kit (Pierce, Rockford, Il, USA). Twenty five micrograms of each sample was re-suspended in sample buffer and separated by SDS-PAGE using a 12% running gel and transferred to an Immobilon P transfer membrane (Millipore). The membranes were incubated for 1 h at room temperature with 5% (w/v) dry milk in TBS-Tween 20. Primary antibodies were diluted in 5% dry milk dissolved in TBS-Tween 20 and immunoblotting was performed overnight. Membranes were washed three times with TBS-Tween 20 and incubated with secondary HRP anti-rabbit antibody for 1 h at room temperature. At the end of the incubation, membranes were washed six times with TBS-Tween 20 and the immunoreactive bands were detected by chemiluminescence using ECL reagents (Perkin Elmer). A series of primary, secondary antibody dilutions and exposure times were used to optimize the experimental conditions for the linear sensitivity range of the autoradiography films (Kodak Biomax MR). Films were scanned and the density of each band was quantified using the NIH ImageJ 1.63 software. The levels of phosphorylated proteins were normalized to total levels.
Animals. Male Sprague Dawley rats (275–300 g; Charles River, Kingston, NY, USA) were pair-housed and allowed to acclimate to the animal colony and handled for at least 3–4 days prior to experimentation. Rats were maintained on a 12:12-h light-dark cycle (0600:1800 h light; 1800:0600 h dark) with a room temperature of 22±3°C and a relative humidity level of 45±10%. Food and water were available ad libitum and rats used for these studies were housed, managed and cared for in accordance with the Guide for the Care and Use of Laboratory Animals (National Research Council, 2011). All experiments were approved by the Alkermes Institutional Animal Care and Use Committee. Animal studies conducted by Alkermes were reviewed and approved by its IACUC. All animal work conducted by Alkermes is compliant with PHS policies governing the humane care and use of laboratory animals.
Drug administration and tissue collection. Ketamine HCl (Ketaset® 100 mg/mL; Fort Dodge Animal Health, IA, USA) was used to prepare a 10 mg/mL solution in sterile 0.9% saline for injection. Rats received a single acute i.p. injection of ketamine and were killed 30 min later for phosphorylated mTOR (p-mTOR) or 24 hr for PSD-95 via CO2 asphyxiation followed by decapitation. Brains were removed, placed on wet ice and the prefrontal cortex was free-hand dissected and snap frozen on dry ice. Samples were stored at -80°C until further analysis.
Synaptosomal preparation and capillary electrophoresis. Crude synaptosomes were prepared from frozen prefrontal cortex samples. Tissues were weighed and dounce homogenized (10:1; wt:vol) in ice-cold Syn-PER™ synaptic protein extraction reagent (Thermo Scientific; Rockford, IL, USA) supplemented with Halt™ protease and phosphatase inhibitor cocktail (1X, Thermo Scientific). Homogenates were centrifuged at 1200 × g for 10 min at 4°C. The supernatant was centrifuged at 15,000 × g for 20 min at 4°C. After centrifugation, the supernatant was discarded and pellets were resuspended in 200 μL of Syn-PER reagent with inhibitors and proteases. Protein concentration was determined by BCA protein assay according to the manufacturer’s instructions (Thermo Scientific).
Protein levels were quantified using an automated size resolving capillary electrophoresis system, “WES”, from Protein Simple (San Jose, CA, USA). All procedures were performed according to manufacturer’s instructions. Briefly, 8 μL of 0.1 mg/mL of homogenate was mixed with 2 μL of 5X fluorescent master mix and heated at 95°C for 5 min. The samples, blocking reagent, primary antibody, anti-rabbit secondary antibody, chemiluminescent substrate, and wash buffer were loaded into a microplate provided with a 12-230 kDa WES kit (PSD-95) or a 66-440 kDa WES kit (p-mTOR). Primary antibodies used were PSD-95 (rabbit; Cell Signaling [#2507]; 1:50) and p-mTOR (rabbit; Cell Signaling [#5536]; 1:50) (see Table 1). Separation and immunodetection was performed automatically using default plate settings for each kit in Compass software (version 2.7.1; Protein Simple, San Jose, CA, USA). Signal and quantitation of immunodetected proteins were generated automatically by Compass software and the data were graphed using GraphPad Prism 6.0 (GraphPad Software, La Jolla, CA, USA).
More than a dozen independent experiments conducted by these four teams failed to detect robust effects of ketamine on markers reported to be affected in the study by Li et al. (2010). Given the number of studies and markers analyzed, vehicle- and ketamine-treated groups occasionally appeared to be different but there were no overall consistent and robust differences. Figure 1, Figure 2 and Figure 3 present results from the studies that assessed effects of ketamine on pmTOR, PSD-95 and pp70S6K. Table 2 summarizes experimental conditions that were systematically manipulated in order to enable detection of ketamine-induced biochemical effects.
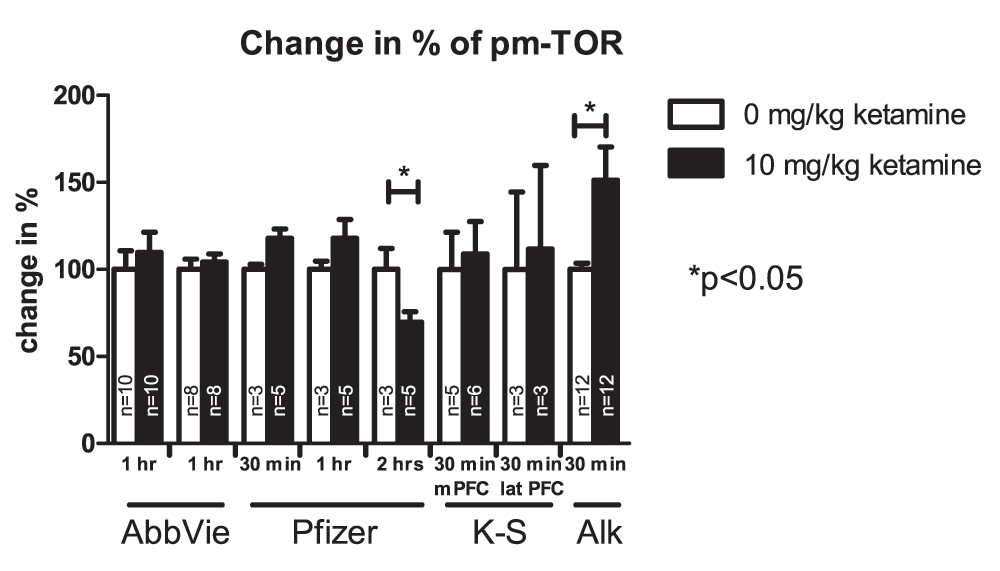
Values represent mean ± SEM, n is indicated in the bars for each independent experiment, *p<0.05; student’s t-test. Samples were collected at different time points after drug application as indicated in the figure. Karolinska-Servier distinguished between the medial (m PFC) and lateral (lat PFC) prefrontal cortex.
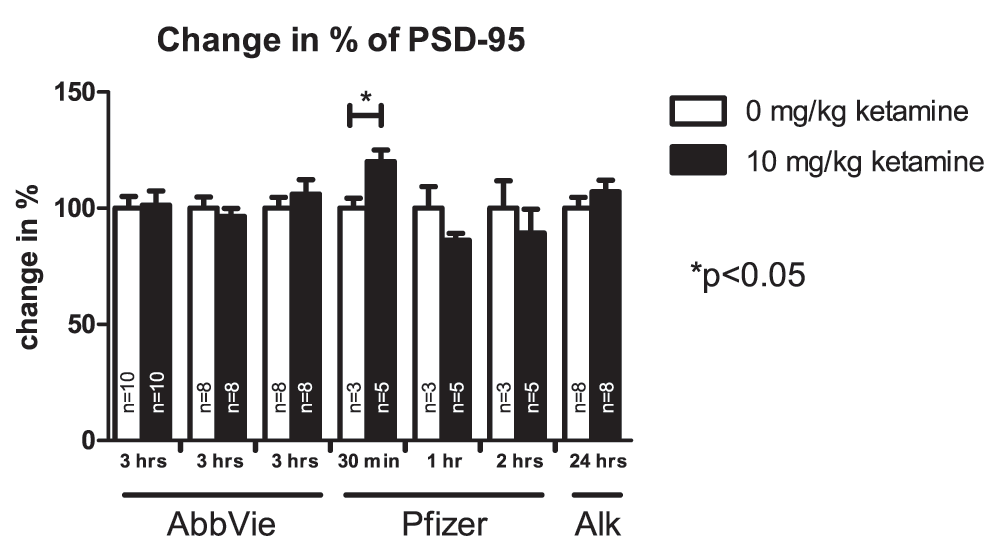
Values represent mean ± SEM, n is indicated in the bars for each independent experiment, *p<0.05; student’s t-test. Samples were collected at different time points after drug application as indicated in the figure.
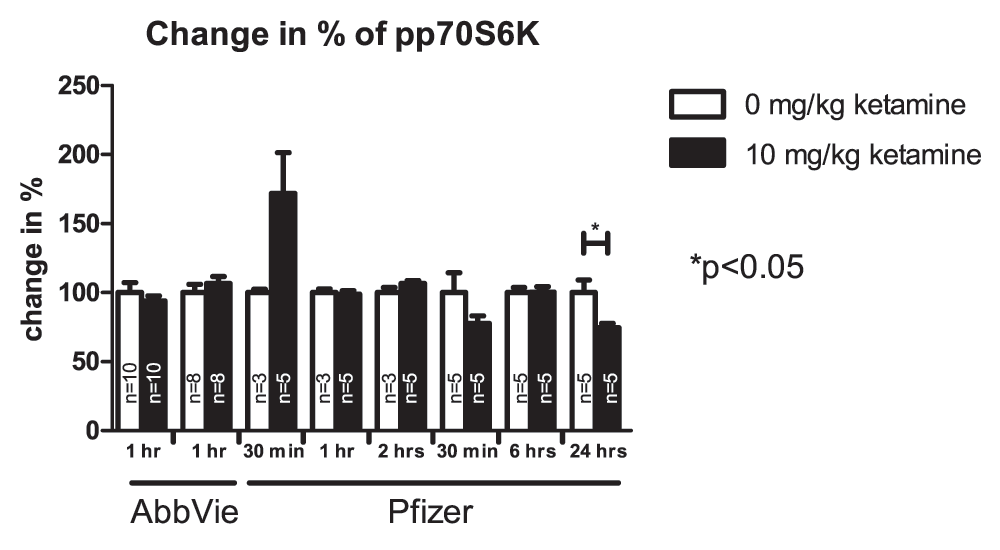
Values represent mean ± SEM, n is indicated in the bars for each independent experiment, *p<0.05; student’s t-test. Samples were collected at different time points after drug application as indicated in the figure.
Independent correspondence with Ronald Duman (senior author in the Li et al. publication) and S. Popp (AbbVie) or J. Joshi (Pfizer) did not help to identify methodological factor(s) that may account for the failure to reproduce ketamine’s effects.
What makes clinical effects of ketamine quite appealing is that they are strong enough to be seen even in small studies conducted by different institutions under varying conditions. In contrast, effects of ketamine on mTOR seem to require special conditions that are difficult to identify and establish at least in some labs. Many of these phosphorylation events are very sensitive, and subject to high amounts of variability even when environmental conditions are well-controlled. Thus, these kinds of measurements may not be reliable pharmacodynamic markers of efficacy.
Taken together, these data call into question the robustness of the preclinical ketamine mTOR findings and challenge the mTOR hypothesis of ketamine’s antidepressant action. We would also like to emphasize the importance of publishing detailed methods either within the papers or as supplementary materials. This information is essential for follow-up studies that any significant research is likely to trigger.
Efforts to identify individual lab efforts to establish ketamine’s effects on mTOR have followed the peer-to-peer mechanism of information exchange that is being developed by the ECNP Preclinical Data Forum (https://www.ecnp.eu/projects-initiatives/ECNP-networks/List-ECNP-Networks/Preclinical-Data-Forum.aspx) and is suggested as a general tool to identify unpublished data that, when put together and disclosed, could present a value to the scientific community.
We feel that information about failed attempts to establish ketamine’s effects should be disclosed to allow scientific community to judge on the robustness of these effects.
After the manuscript was prepared for submission, the authors have received information from colleagues at the Lilly Research Labs, Indianapolis, IN USA (H. Wang, J.M. Witkin, and J.W. Ryder, personal communication) that their lab was also unable to establish effects of ketamine on p-mTOR(pS2448), consistent with the data reported in this manuscript.
F1000Research: Dataset 1. Figure 1 raw data, 10.5256/f1000research.8236.d117437 (Popp et al., 2016a).
F1000Research: Dataset 2. Figure 2 raw data, 10.5256/f1000research.8236.d117438 (Popp et al., 2016b).
F1000Research: Dataset 3. Figure 3 raw data, 10.5256/f1000research.8236.d117439 (Popp et al., 2016c).
| Views | Downloads | |
|---|---|---|
| F1000Research | - | - |
|
PubMed Central
Data from PMC are received and updated monthly.
|
- | - |
Click here to access the data.
Spreadsheet data files may not format correctly if your computer is using different default delimiters (symbols used to separate values into separate cells) - a spreadsheet created in one region is sometimes misinterpreted by computers in other regions. You can change the regional settings on your computer so that the spreadsheet can be interpreted correctly.
Provide sufficient details of any financial or non-financial competing interests to enable users to assess whether your comments might lead a reasonable person to question your impartiality. Consider the following examples, but note that this is not an exhaustive list:
Sign up for content alerts and receive a weekly or monthly email with all newly published articles
Already registered? Sign in
The email address should be the one you originally registered with F1000.
You registered with F1000 via Google, so we cannot reset your password.
To sign in, please click here.
If you still need help with your Google account password, please click here.
You registered with F1000 via Facebook, so we cannot reset your password.
To sign in, please click here.
If you still need help with your Facebook account password, please click here.
If your email address is registered with us, we will email you instructions to reset your password.
If you think you should have received this email but it has not arrived, please check your spam filters and/or contact for further assistance.
https://www.ncbi.nlm.nih.gov/pmc/articles/PMC7162891/
https://www.ncbi.nlm.nih.gov/pmc/articles/PMC7162891/
https://www.ncbi.nlm.nih.gov/pmc/articles/PMC7162891/