Keywords
ranking genes, candidate gene prioritization, convergent evidence, rank product, combine p-values, bioconductor, R package,
ranking genes, candidate gene prioritization, convergent evidence, rank product, combine p-values, bioconductor, R package,
Genetic studies employ multiple independent lines of investigation spanning pan-omics approaches to holistically understand the molecular background of complex genetic traits. This includes studying the roles of various forms of genomic variation (e.g. SNPs, InDels, and CNVs) and gene expression in multiple tissues, and the regulation of a single phenotype across single or multiple species (e.g, humans and other relevant model organisms). One of the common objectives of performing such diverse experimental assays across multiple types of cells, tissues, treatments, time-points and species is to find the causal genes underlying a specific disease or trait. Integration of data from such diverse experimental assays (hereafter referred to as evidence layers) would enable prioritization of genes that are most relevant to the phenotype. Meta-analytic approaches that integrate gene-level data from multiple evidence layers have been shown to be successful in identifying and prioritizing candidate genes for complex genetic traits (Ayalew et al., 2012). However, no implementation of candidate gene prioritization methods existed in the Bioconductor project at the time this package was written, which otherwise offers a seamless framework to perform various statistical analyses in biomedical research. The majority of the existing meta-analysis related packages in Bioconductor have been exclusively developed to integrate microarray gene expression data, but do not serve the purpose of integrating gene-level data from multiple study types. Here, we implemented three methods to rank genes by integrating gene-level data generated from multiple evidence layers.
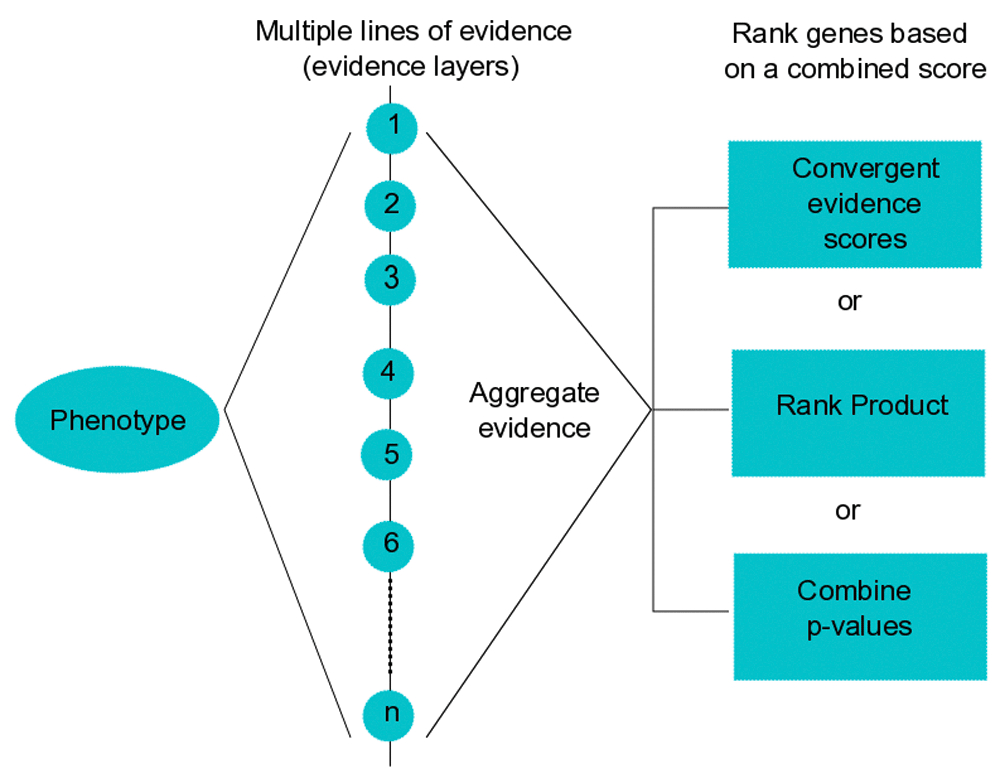
The methods are implemented in R and available as a package in the Bioconductor repository (http://bioconductor.org/packages/GenRank/). The package requires R version 3.2.3 or later versions and runs on all operating systems. Figure 1 shows an overview of the workflow of the GenRank package.

To obtain convergent evidence for the molecular basis of phenotypes, GenRank bioconductor package implements three methods to integrate gene-level data generated from multiple independent experiments. Examples of evidence layers are experiment assay-type (e.g., GWAS, RNAseq, ChIPseq), tissue-type (e.g., blood, liver, intestine), cell-type (e.g., neutrophils, lymphocytes), time-series (e.g., 0h, 2h, 6h), species-type (e.g., human, mouse, drosophila), treatment-type (e.g., control, dexamethasone, lipopolysachharide).
GenRank provides three methods to prioritize gene-level data obtained through multiple independent evidence layers. It requires a tab-delimited text file with three required fields: gene symbols or IDs, type of evidence layer and a significance statistic (e.g., p-value or effect-size). The first two fields are sufficient for the convergent evidence method. Summary statistics to prioritize the genes are computed as follows.
The convergent evidence (CE) method aggregates ranks of genes based on a weighted vote counting method. A conceptually similar gene-level integration has been successfully used to prioritize candidate genes in neuropsychiatric diseases (Ayalew et al., 2012).
Here, to rank genes, we compute convergent evidence scores. The convergent evidence score of gene G is given by
CE(G) = CE(GL1)/n(L1)+....+CE(GLn)/n(Ln)
Here CE(GLi) refers to the self-importance of evidence layer-i, while n(Li) refers to the number of genes within evidence layer-i. Additionally, we propose two other ways to compute convergent evidence scores. One of them is to ignore the number of genes within each layer, thus
CE(G) = CE(GL1)+....+CE(GLn)
In this case, the convergent evidence score would be equivalent to the primitive vote counting. Another alternative method enables the researchers to determine the importance of each layer based on their own intuition. This involves assigning custom weights to each evidence layer based on their expert knowledge in the field. For example, when a researcher knows that a specific technology could yield less reproducible findings, such evidence layer could be given relatively less weight compared to the other evidence layers. Another objective way of assigning custom weights to each evidence layer could be based on the sample sizes of each evidence layer. In this case the convergent evidence score is
CE(G) = CE(GL1) * w(L1)+....+CE(GLn) * w(Ln)
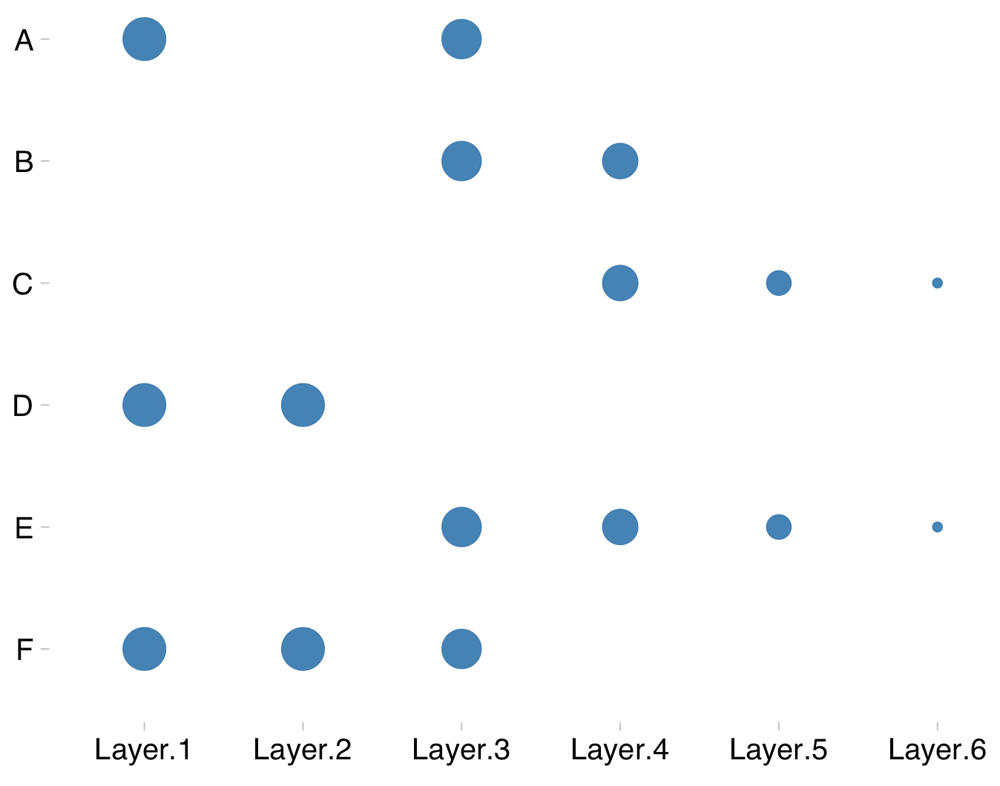
where w(Li) refers to the custom weight assigned to evidence layer-i. Figure 2 shows an illustration of how CE scores are computed.

This illustration shows six evidence layers (Layer.1–Layer.6). The point indicates the detection of a gene in an evidence layer, while the size of the point indicates the importance of an evidence layer (custom weights assigned by the user). Here, genes A, B and D are detected twice each. However, based on a weighted vote counting method, gene D would get a better rank than genes A and B.
The rank product (RP) method has been used widely to perform differential expression analysis in microarray-based gene expression datasets. This biologically motivated method is simple, yet powerful and ranks genes that are consistently ranked highly in replicated experiments, based on the geometric mean (Breitling et al., 2004). This method has been implemented earlier as a Bioconductor package to perform meta-analysis of gene expression experiments (Hong et al., 2006). We adapted the rank product method to identify genes that are consistently highly ranked across evidence layers. The rank product is computed and compared to a permutation-based distribution of rank product values to estimate the proportion of false predictions (pfp; equivalent to FDR).
Combining p-values has been one of the traditional methods of meta-analysis. To combine p-values of a gene from multiple evidence layers, the p-values should have been estimated from the same null hypothesis. Popular methods to combine p-values include Fisher’s and Stouffer’s methods, where the latter incorporates custom weights (e.g. sample sizes). These popular methods have already been implemented in the Bioconductor package survcomp (Schröder et al., 2011). Here, we built a wrapper around those methods to suit the overarching theme of this package (integrating gene-level data from multiple evidence layers). Missing p-values in some evidence layers could lead to a potential bias when combining p-values. To handle this issue, our implementation returns the combined p-values of only those genes, for which p-values are available at least across half of the evidence layers. However, it would be an ideal scenario to have p-values available across all evidence layers.
To avoid a potential bias owing to duplicated genes, duplicated genes are counted only once (as a single vote) within each evidence layer in all the three methods implemented in this package. When retaining duplicated genes, those with significant test statistic (e.g low p-values or high effect-size) were retained.
The use cases are explained in detail, with example data in the package vignette available at the package webpage here:
https://www.bioconductor.org/packages/devel/bioc/vignettes/GenRank/inst/doc/GenRank_Vignette.html
Oikkonen et al. (2016) serves as an interesting use case that used convergent evidence scores to prioritize candidate genes obtained through diverse experiment types in a complex genetic trait.
An earlier version of this article can be found on bioRxiv at (http://biorxiv.org/content/early/2016/04/12/048264)
The GenRank package is hosted on Bioconductor at:
http://bioconductor.org/packages/GenRank/.
Latest source code:
https://github.com/Bioconductor-mirror/GenRank
Archived source code as at the time of publication:
http://doi.org/10.5281/zenodo.439738. (Kanduri & Järvela, 2017)
License: Artistic-2.0 license.
CK and IJ conceived the study and drafted the manuscript. CK carried out the implementation.
The study has been funded by the University of Helsinki (Grant number: 73603104).
The funders had no role in study design, data collection and analysis, decision to publish, or preparation of the manuscript.
| Views | Downloads | |
|---|---|---|
| F1000Research | - | - |
|
PubMed Central
Data from PMC are received and updated monthly.
|
- | - |
Is the rationale for developing the new software tool clearly explained?
Partly
Is the description of the software tool technically sound?
Partly
Are sufficient details of the code, methods and analysis (if applicable) provided to allow replication of the software development and its use by others?
No
Is sufficient information provided to allow interpretation of the expected output datasets and any results generated using the tool?
No
Are the conclusions about the tool and its performance adequately supported by the findings presented in the article?
Partly
Competing Interests: No competing interests were disclosed.
Is the rationale for developing the new software tool clearly explained?
Yes
Is the description of the software tool technically sound?
No
Are sufficient details of the code, methods and analysis (if applicable) provided to allow replication of the software development and its use by others?
Yes
Is sufficient information provided to allow interpretation of the expected output datasets and any results generated using the tool?
Yes
Are the conclusions about the tool and its performance adequately supported by the findings presented in the article?
No
Competing Interests: No competing interests were disclosed.
Reviewer Expertise: Bioinformatics
Alongside their report, reviewers assign a status to the article:
| Invited Reviewers | ||
|---|---|---|
| 1 | 2 | |
|
Version 1 11 Apr 17 |
read | read |
Provide sufficient details of any financial or non-financial competing interests to enable users to assess whether your comments might lead a reasonable person to question your impartiality. Consider the following examples, but note that this is not an exhaustive list:
Sign up for content alerts and receive a weekly or monthly email with all newly published articles
Already registered? Sign in
The email address should be the one you originally registered with F1000.
You registered with F1000 via Google, so we cannot reset your password.
To sign in, please click here.
If you still need help with your Google account password, please click here.
You registered with F1000 via Facebook, so we cannot reset your password.
To sign in, please click here.
If you still need help with your Facebook account password, please click here.
If your email address is registered with us, we will email you instructions to reset your password.
If you think you should have received this email but it has not arrived, please check your spam filters and/or contact for further assistance.
Comments on this article Comments (1)