Keywords
Probe design, qPCR, microarray, Bioinformatics, molecular ecology, microbiology
This article is included in the Max Planck Society collection.
Probe design, qPCR, microarray, Bioinformatics, molecular ecology, microbiology
The analysis of the microbial community structure and abundance based on universal conserved marker genes has become a powerful tool for many disciplines in life science with a specific focus on next-generation sequencing technologies1,2. In addition to these qualitative methods technologies such as environmental microarrays and quantitative polymerase chain reaction (qPCR) offer cost-effective and highly reproducible techniques for semi-quantitative estimation of microbial communities. Genetic markers commonly used for microarrays and qPCR are ribosomal RNA (rRNA) genes, e.g. 16S, for bacterial communities3,4, as well as functional genes that determine microbial community structure with regards to specific metabolic functions5,6. Both technologies rely on taxon-specific short nucleotide sequences of the marker gene of interest, so-called oligonucleotide probes (OPs). In qPCR experiments OPs act as the primer to initiate the amplification reaction whereas in microarrays the probe is spotted onto a glass slide and the complementary sequence is hybridized with it.
A major challenge in using both techniques for novel organisms and marker genes, however, is the development of OPs with appropriate levels of taxonomic specificity and sensitivity: especially functional genes show highly variable levels of conservation, not only between sequences of different taxa but also between sequences of closely related organisms. Thus, depending on the experiment, the functional marker and the organisms of interest, hundreds or even thousands of OPs with varying levels of conservation have to be designed and subsequently in-silico tested for their phylogenetic specificity and sensitivity. A major bottleneck for this process is the lack of software tools that enable researchers to test multiple potential OPs for their phylogenetic specificity at once.
Here we present ProbeSpec7, a user-friendly, interactive probe specificity and sensitivity assessment tool for OPs with batch analysis support. ProbeSpec’s functionality is incorporated into the widely used ARB software8 which is freely available for non-commercial use (detailed copyright information can be found here and in the license agreement included in each tarball). To our knowledge, ProbeSpec is the only batch probe specificity assessment tool which provides interactive manipulation of specificity and sensitivity thresholds.
ProbeSpec is implemented in ARB’s PROBE_DESIGN class utilizing its prefix tree database server. ProbeSpec’s functionality is implemented in the classes ArbProbe and ArbProbeCollection (abstraction of OP sequences and import/export functionality), ArbProbeMatchWeighting (providing weighting matrices for position specific nucleotide substitutions), ArbMatchResult, ArbMatchResultSets and ArbMatchResultsManager (abstraction of OP to PT-Server sequences with given weighting matrices and maximum number of mismatches) and ArbStringCache (providing string to disk caching of match string results).
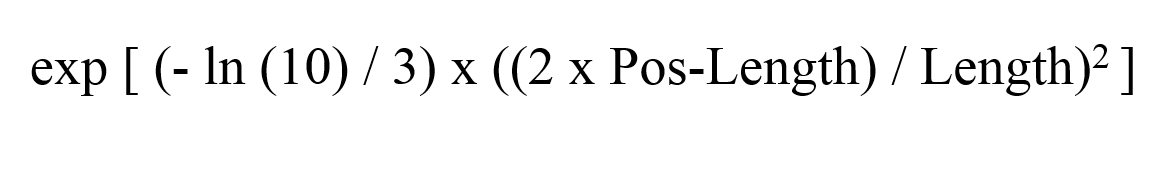
Probe specificity calculations in ProbeSpec are based on the initial mismatch penalties given by a 4×4 substitution matrix for all possible nucleotide substitutions. Additionally, each mismatch penalty is weighted based on the position of a mismatch in the probe: mismatches at the ends of an OP are less likely to affect the binding of complementary sequences than mismatches in the center of a probe. Positional weights are calculated as follows: for a mismatch at position p in a given OP sequence of length l a weight W is calculated with
where
and
The weight distribution given by (1) follows a bell curve penalizing mismatches at either end of the OP sequence less than mismatches in the center of the sequence. The user defined parameter w in equation (2) controls the spread of the weight distribution; user defined parameter b in equation (3) controls the midpoint and therefore enables the user to increase positional weights on either side of the OP sequence. For default parameters of w=1 and b=0, positional weights range from a minimum 0.1 for mismatches at the first and last nucleotide in the sequence to a maximum of 1 for mismatches at the center.
For user interaction with ProbeSpec ARB’s general user interface was extended with four new dialog windows: (i) a Probe Collection dialog, (ii) a Probe match with specificity, (iii) Match display control dialog and (iv) a Tree Marker settings dialog (Figure 1).

(A) Probe Collection dialog. (B) Tree marking settings dialog. (C) Match Display Control; (D) Match Display Control. Coloured vertical bars on the left of the main window represent (partially) matching probes.
The Probe match with specificity is the main entry point of ProbeSpec. It displays all loaded probes which can be edited, imported and exported through the Probe Collection dialog. Additionally, the Probe Collection Dialog allows the user to change the default settings for substitution penalties and positional weight parameters.
The main GUI of ARB was extended to graphically represent the probe matching results: each probe is represented by a colored vertical bar indicating a match of the OP to the specific phylogenetic group. Incomplete cover of a phylogenetic group is represented by transparency of a bar: the fewer members of a group that are covered by a given probe the higher the transparency of a bar is.
The dialogs Match Display Control and Tree marking settings enable interactive adjustment of probe match parameters such as mismatch threshold, group marked and group partially marked threshold.
ARB and the included ProbeSpec functionality can be run on any common PC, laptop or workstation. However, we recommend system specifications of at least 4GB of RAM and a dual-core processor to run ProbeSpec.
Using ProbeSpec we were able to test the specificity of 345 OP sequences against an ARB database of 20,314 bacterial and archaeal ammonia mono-oxygenase sequences on a Ubuntu Virtual Machine with 4 GB of RAM and one processor allocated in less than 30 minutes. In comparison: sequential specificity testing without ProbeSpec for a recent publication9 on the same data set took several days
For any probe development, ProbeSpec requires a phylogeny of target sequences and organisms that the OPs should match to as well as a list of potential OPs.
For an introduction to sequence analysis using ARB, please refer to the main ARB documentation at http://www.arb-home.de/documentation.html. For evaluation purposes a sub-set of the data published in Krausfeldt et al. (2017) can be found on Zenodo10. To set up ARB select the provided nitrifyers_2017_04_for_paper.arb database file on start of ARB. To be able to run ProbeSpec a PTServer has to be created from the database via the Probes tab and the PT_Server Admin option in the PT Server Admin widget. Select the loaded database and click Build server. After completion close the progress bar and the PT Server Admin widget.
Before running a batch specificity test, a probe collection, i.e., a list of probes to be tested, has to be created using the Probe Collection window where probes can be added to and removed from a collection: Open the Probe Match with Specificity window via the Probes-tab in ARB (Figure 1A) and select Edit (Figure 1B) to open the Probe Collection window (Figure 1C). To open the provided test data set use the load button and select the provided amoA70mers.xpc probe collection. Additionally, the sequence of new probes can be entered into the Target String text field. To add new OPs to the collection press Add. Probe collections can also be in this dialog.
The Probe Collection window can be used to define the specificity measures used by ProbeSpec to identify matching probes. This includes the definition of specific mismatch penalty values as well as the values for bias b and weight w (see subsection Operations in the Methods section for details).
After creation of a probe collection and configuration of the match parameters the Probe Collection window can be closed and the specificity search can be started by clicking the Match button (Figure 1B). A status dialog will appear and show the progress of the search.
The final match results are shown in the ARBs main window: each matching probe is represented by a coloured bar next to the group/clade the probe matches with the given thresholds (Figure 1A). The visualization can be configured using the two dialogs Match Display Control (Figure 1B) and Tree Display settings (Figure 1C), the latter of which can be accessed via the Marker Display Settings button on the Match Display Control widget.
Here we present ProbeSpec, to our knowledge, the first tool for batch specificity testing of OP sequences implemented in ARB. ProbeSpec offers significant time saving for projects developing and testing large oligonucleotide probe datasets for use in technologies such as qPCR and environmental microarrays.
For test and validation purposes, a sub-set of the data published in Krausfeldt et al. (2017) can be found at Zenodo, DOI: http://doi.org/10.5281/zenodo.148295810. The dataset includes a phylogeny of archaeal and bacterial amoA sequences (nitrifyers_2017_04_for_paper.arb) as well as a sub-set of 185 OPs used to create the environmental microarray.
ProbeSpec is included in the production version of ARB, available at: http://download.arb-home.de/special/manual-builds/.
Archived version of the production version directory: http://doi.org/10.5281/zenodo.14829477.
License: ARB License.
| Views | Downloads | |
|---|---|---|
| F1000Research | - | - |
|
PubMed Central
Data from PMC are received and updated monthly.
|
- | - |
Provide sufficient details of any financial or non-financial competing interests to enable users to assess whether your comments might lead a reasonable person to question your impartiality. Consider the following examples, but note that this is not an exhaustive list:
Sign up for content alerts and receive a weekly or monthly email with all newly published articles
Already registered? Sign in
The email address should be the one you originally registered with F1000.
You registered with F1000 via Google, so we cannot reset your password.
To sign in, please click here.
If you still need help with your Google account password, please click here.
You registered with F1000 via Facebook, so we cannot reset your password.
To sign in, please click here.
If you still need help with your Facebook account password, please click here.
If your email address is registered with us, we will email you instructions to reset your password.
If you think you should have received this email but it has not arrived, please check your spam filters and/or contact for further assistance.
Comments on this article Comments (0)