Keywords
weight cycling, weight loss program, high protein diet, body composition, low calorie diet, fat mass, muscle mass
This article is included in the All trials matter collection.
weight cycling, weight loss program, high protein diet, body composition, low calorie diet, fat mass, muscle mass
The prevalence of obesity worldwide has doubled from 1980 to 2014. The World Health Organization (WHO) estimated that in 2014 there were approximately 600 million people aged 18 years or more diagnosed as having obesity, which was equivalent to 13% of overall world’s population (WHO data on obesity). In Indonesia, the prevalence of obesity has also doubled from 14.8% in 2007 to 32.9% in 2014. Especially in the capital region of Jakarta, ranked fifth in the list of provinces with the highest prevalence of obese population among the 34 provinces in Indonesia, with a prevalence of 16.2% out of approximately 10 million population in 20141. Being overweight and obesity increases the risk of developing various non-communicable diseases, especially hypertension, cardiovascular disease, and other chronic diseases. Changes in metabolism at the cellular level in obese people leads to an increase in lipogenesis, which later increases the size of adipose tissue without adequate angiogenesis thus causing hypoxia and cell death. Those two conditions initiate inflammation mediators with increasing oxidative stress and further exacerbates changes in metabolism, which leads to the development of chronic diseases2.
Weight loss programs through food intake and physical activity adjustments are often prescribed to attenuate obesity. However, a considerable proportion of obese people who had previously succeeded in losing weight, failed to maintain the achieved weight-loss long-term and consequently regaining body weight. The state of alternating loss and gain in body weight is called weight cycling. Weight cycling brings about changes in body composition, namely fat mass rise and fat-free mass deprivation. Weight loss intervention towards weight cycling bearers results in unfavorable outcome upon body composition, since fat free mass will be dampened in accordance with overall body weight loss. This condition causes reductions in resting energy expenditure (REE), which precipitates further weight gain and worsening of body composition3.
Previous studies have been inconclusive on the correlation between weight cycling and body composition. A study by Oetoro et al. showed that subjects with a history of weight cycling had a worse response upon participating in low calorie standard composition diets, with higher fat mass and lower muscle mass when compared to first-encounter obesity subjects3. A study by Byrne et al. also showed that regaining body weight after successful weight loss was not accompanied by the increase of fat-free mass4. On the other hand, in a study by Prentice et al.5 and Heitmann et al.6 showed that there was no difference in fat free mass between usual obese people and obese people with weight cycling. Previous studies have been inconsistent on the results of low calorie diets with varying food composition upon obese people with weight cycling. A study by Layman et al.7, as well as study a by Parr et al.8, showed that low calorie diets with higher protein gave rise to a better body composition outcome, in which the former found that a high protein diet resulted in weight loss with better fat mass-fat free mass ratio, and the latter showed that a significant difference was seen among high protein interventions. However, a study by Luscombe et al.9 showed that high protein intake did not result in significant differences compared to high fat diet based on weight loss and decrease of chronic disease risk. A study by Farnsworth et al. also showed that there was no difference in fat mass decrease between high protein and standard protein diet10. The purpose of this study is to evaluate whether low calories with a high protein diet result in a better outcome on body composition when compared to a standard low calories diet in obese people with history of weight cycling.
This is an open-randomized clinical trial of dietary consultation for weight loss program as a part of a larger study assessing the effect of low calorie high protein diet to body composition, oxidative stress, inflammation marker and metabolic syndrome in obese with weight cycling. There are two intervention arms, both with 1000 kcal-caloric restriction, one with high protein (22–30% of total calories intake) and one with standard protein (12–20%). The allocation ratio between the two intervention group is 1:1. No major changes to the methods was made during the study (original study protocol is available in the supplementary material along with a completed CONSORT checklist; Supplementary File 1 and Supplementary File 2)
Candidates were obtained from a list of patients from the previous year, based on a medical records summary of civil workers’ health service center of the special capital region of Jakarta, from which we had basic data on gender, weight, height and BMI (Pusat Pelayanan Kesehatan Pegawai Provinsi DKI Jakarta). Identified eligible candidates were contacted by phone to invite them to participate in the study. Considering difficulties finding subjects only from medical records, respondents were also recruited from other places that have the same characteristics as civil workers of the special capital region of Jakarta. This was performed by advertising the study to the public, broadcasting via social media. Initial screening for subject recruitment was any men or women, more than 20 years old, with a body mass index ranging from 25 – 35 kg/m2.
Since the definition of weight cycling has not been established yet, different criteria are used among various previous studies. In this study, weight cycling was defined as a history of weight loss ≥2 kg and regaining the weight into or exceeding the initial body weight at least twice in the last five years. Weight cycling history was identified from self-filled questionnaires recording the history of body weight changes. This definition allowed us to pick subjects with weight cycle for intervention and control groups with homogeneous baseline characteristics, as was demonstrated by statistically insignificant differences between these two groups.
Initial screens of patients was performed via interview to determine eligibility to participate (see Supplementary File 3 and Supplementary File 4 for form used in the interview and form used to gather demographic information respectively). Subjects were excluded if they had diabetes mellitus (identified from history taking and fasting blood glucose), having a history of gastrointestinal tract resection, having hormonal disorders (such as abnormal thyroid, identified from interview), using hormonal contraception, menopause, and having kidney function disruption (identified from serum urea and creatinine levels). At the point of recruitment, most of participating subjects were living sedentary lives and were instructed to perform physical activity at their usual level during the 8 weeks of diet intervention.
This study has been approved by the Health Research Ethical Committee of the Faculty of Medicine Universitas Indonesia – Cipto Mangunkusumo Hospital (approval number 237/UN2.F1/ETIK/2017. Written informed consent for participation in the trial and publication of patient information was obtained from each patient. This study has been registered in https://clinicaltrials.gov/ with the registration ID NCT03374150.
Two weeks prior to intervention commencement, subjects which passed through initial screening were further interviewed and were measured for anthropometric data for participating subject’s selection purpose. All selected subjects were then instructed to cease all previous diet program, including the use of appetite suppressant drugs, fat absorber inhibitor drugs, as well as protein supplements. Subjects were also instructed to perform their daily activity with their usual physical activity level. Due to The Holy Month of Ramadan, the recruitment and intervention were conducted in two periods, the first one was on May – July, while the second period was on July – September of 2017.
Subjects were given nutrition consultation, diet recipes, and a logbook (examples provided in Supplementary File 5). Counseling was performed once weekly. The high protein (HP) group, as the treatment group, obtained counseling about weight loss programs by applying a low calorie-high protein diet with a diet menu composition of 22–30% protein, along with instructions for allowed cooking method. The control group receiving a standard protein (SP) proportion and were counseled about weight loss program by means of a low calorie-balanced composition diet with a menu comprised of 12–20% protein. Caloric intake and food composition for each subject were calculated according to history of daily caloric intake. During the 8 week of the diet program, subjects were instructed to reduce their daily caloric intake by 500 – 1000 kcal from their previous usual daily intake, with limitation in low calorie diet range (800–1500 kcal.day) of calorie intake. History of previous daily caloric intake were obtained from food recall of a 24 hour period by asking type of food, cooking method, and estimation of amount of food consumed by using household size based on food photo books issued by the Individual Food Consumption Survey Team, Ministry of Health of Indonesia. Subjects were asked to fill daily logbook to record daily consumption, food photographs, size, and the cooking method.
Follow up for each subject was performed once daily by person-to-person contact. Subjects were contacted everyday by cellphone texting, and telephone twice a week to ensure the subject’s compliance. After 8 weeks of intervention, subjects were invited to revisit the clinic for anthropometry and body composition measurement after completing the program.
Block randomization method with a block size of two at a time for the two intervention arms was used for the allocation of subjects into the treatment groups. The arrangement of each block for the group allocation sequence was determined through random number generation method using computer-generated random number. Even number represented the permutation of high protein-standard protein for a pair of subjects while odds number represented the opposite arrangement. The allocation sequence that will be used throughout the study was generated by the investigator before the study commenced. Envelopes each representing a particular group were arranged according to the allocation sequence and then were orderly numbered. It was given consecutively to each subject who come hence the allocation sequence was blinded from the subject. Investigator assigned the subjects to the treatment group according to the envelope he/she received
The primary outome measure is the body composition comprising weight, fat mass, fat mass percentage, muscle mass, and muscle mass percentage which, fat mass percentage, muscle mass, and muscle mass percentage. Those measures were assessed before (week 0) and post intervention (week 8) using the 8-electrode method of Bio-Electrical Impedance Analysis (BIA; SC-330 Tanita, Tokyo, Japan) Dietary and physical activity were quantified using 24 hour recall and physical activity form from the Food and Agriculture Organization of the United Nations (FAO) and WHO, respectively. Data collection occured in the In every weekly encounter with the subject, his/her daily intake and physical activity level were assessed and their body composition were measured.
The secondary outcomes were subjects’ dietary profile which consist of mean daily caloric intake, mean proportion of calories obtained from protein, and the mean days of subjects complied to the assigned dietary plan which were assessed from the participant’s logbook of daily consumption records.
In order to detect a difference between groups, we calculated that a total of 54 participants would be needed, with a two-tailed α of 0.05 and a (1-β) of 0.80 and a possible drop out of 20%. The IBM SPSS Statistics 20.0 was used to analyse the data. Paired samples t-test was used to compare the difference of anthropometric and body composition data (body weight, BMI, fat mass, fat-free mass, and muscle mass) before and after the diet program if the distribution of the data was normal based on a Shapiro-Wilk test for normality. If the data was not normally distributed, the non-parametric test used was the Wilcoxon test. Mean body composition indicator differences between the low calorie high-protein diet group and low calorie standard-protein diet group were stated to be statistically significant if P=<0.05.
To analyze the difference of mean change in body composition (weight, BMI, fat mass, fat-free mass, and muscle mass) between the two groups, an independent sample t-test was used when the data was normally distributed. Non-parametric test for this purpose was Mann-Whitney test. Statistical significance was claimed if P=<0.05.
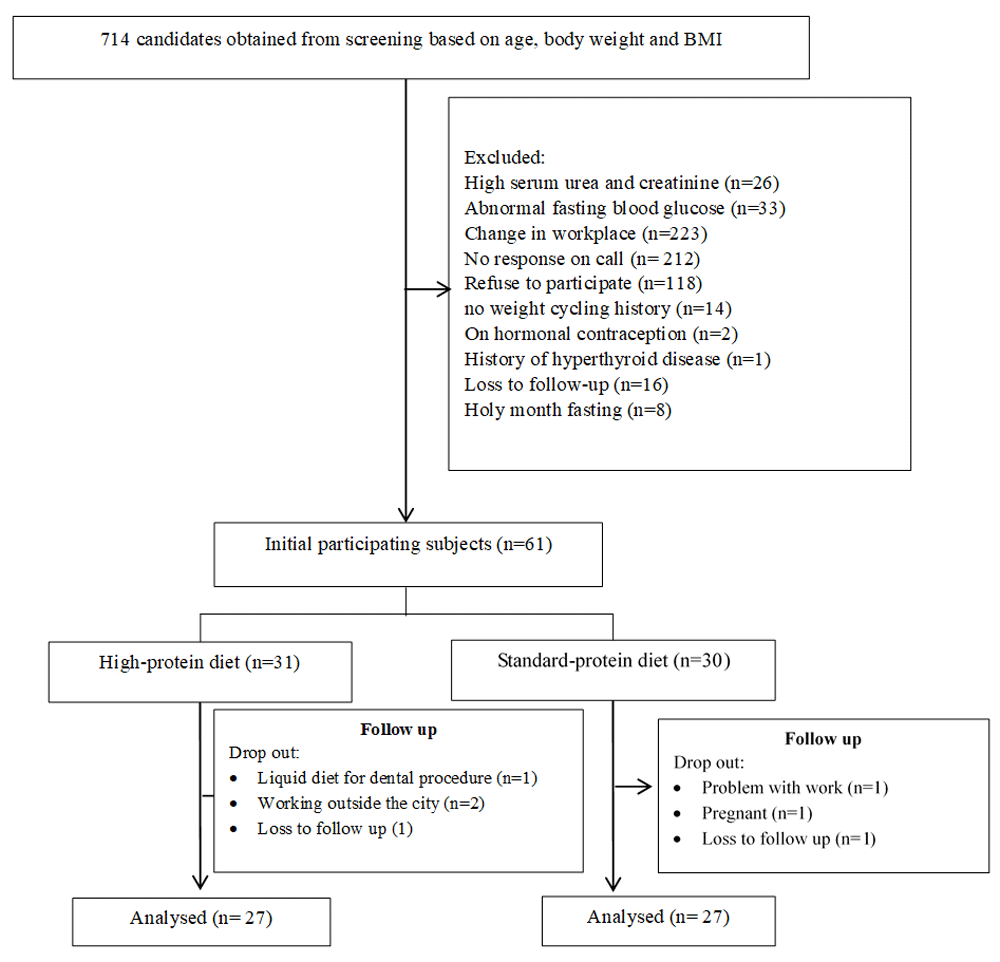
A total of 714 obese people were screened for eligibility. Fifty four participants completed the study and each were analyzed in the groups to which they were allocated as presented in the Figure 1. The characteristics of subjects participating in this study on HP group and SP group are presented in Table 1. Subject’s age, gender proportion, baseline body composition parameters, weight cycling history, daily physical activity level, usual daily caloric intake, and fasting plasma glucose did not differ significantly between both groups.
SP, standard protein intake; HP, high protein intake.
| Variables | Standard protein group (n: 27) | High Protein group (n: 27) | P-value* |
|---|---|---|---|
| Age (years) | 30.6 ± 8.37 | 34.5 ± 9.42 | 0.088m |
| Gender(n(%)) | |||
| Male | 3 (11) | 7 (26) | 0.293p |
| Female | 24 (89) | 20 (74) | |
| Education level (n(%)) | |||
| High school | 5 (18) | 0 (0) | <0.001 |
| Undergraduate/diploma | 21 (77) | 22 (81) | |
| postgraduate | 1 (5) | 5 (19) | |
| Usual daily caloric intake (kcal) | 1753.57 ± 448.95 | 1478.05 ± 577.05 | 0.969t |
| Physical activity level | 1.53 ± 0.16 | 1.58 ± 0.14 | 0.158m |
| Very low | 5 (18.5) | 0 (0) | 0.111f |
| Low/sedentary | 17 (63) | 21 (78) | |
| Moderately active | 5 (18.5) | 6 (22) | |
| Body composition profile | |||
| Weight (kg) | 78.75 ± 11.49 | 76.71 ± 12.76 | |
| Height (cm) | 161.2 ± 8.50 | 159.0 ± 8.16 | 0.407m |
| Body mass index (kg/m2) | 30.09 ± 2.82 | 29.83 ± 3.30 | 0.758t |
| Fat mass (kg) | 31.61 ± 7.93 | 28.67 ± 7.18 | 0.158t |
| Fat mass (%) | 39.92 ± 6.19 | 37.56 ± 7.09 | 0.117m |
| Muscle mass (kg) | 44.29 ± 7.13 | 45.12 ± 9.95 | 0.481m |
| Muscle mass (%) | 45.11 ± 9.95 | 57.79 ± 7.87 | 0.074m |
| Weight cycling history | |||
| Twice | 6 (22) | 5 (19) | 0.981m |
| 3 times | 14 (52) | 17 (63) | |
| 4 times | 5 (19) | 3 (11) | |
| 5 times | 2 (7) | 2 (7) | |
| Average body weight changes | 5.0 ± 2.76 | 4.7 ± 2.51 | 0.759m |
| Fasting plasma glucose | 87.80 ± 6.92 | 84.85± 6.80 | 0.574m |
| Ureum | 19.12 ± 5.61 | 23.00 ± 6.59 | 0.130m |
| Creatinine | 0.71 ± 0.17 | 0.74 ± 0.15 | 0.185m |
| Triglyceride | 112.44 ± 32.50 | 99.89 ± 49.79 | 0,111m |
Table 2 presents the data that reflects the adherence of participants to the assigned diet program according by the group. Since the proportion of caloric intake from protein was the variable of interest in this study we expected there to be a significant difference between the two groups, the proportion of carbohydrate (SP 52.3 ± 4.37, HP 41.67 ± 5.22) and fat (SP 20.63 ± 3.53, HP 24.86 ± 3.60) (Dataset 111) among both group changed accordingly and also were found to be different. In this study, adherence of the subjects from both group to the assigned diet plan was relatively poor in terms of caloric restriction and proportion of caloric intake from protein. The mean number of days in which subject complied with the assigned dietary plan with respect to amount of caloric intake in one day, and the proportion of protein was 26 for high protein, and 27 for the standard protein group out of the 56 day course of treatment.
| Variables | Standard protein group (n: 27) | High Protein group (n: 27) | P-value* |
|---|---|---|---|
| Mean caloric intake (kcal) | 991,2 ± 88,3 | 1039,2 ± 153,5 | 0,165t |
| Mean proportion of caloric intake from protein (%) | 20.23 ± 2.33 | 26,82 ± 3,55 | <0,001m |
| Number of days with diet program compliance | 27 ± 11 | 26 ± 11 | 0,711t |
As indicated in the Table 3, this study found that the changes in body composition did not differ significantly among those who performed caloric restriction with either high or standard protein diets. Generally, subjects in standard protein group underwent slightly greater changes in body composition parameters than that of the high protein group. The reduction in weight, body mass index, fat mass, fat mass percentage, and muscle mass as well as the increase of muscle mass percentage were slightly more profound in the standard protein group than high protein group, although the intergroup mean difference for all those parameters were statistically insignificant. A 500 – 1000 kcal caloric restriction for 56 days resulted in a statistically significant body composition parameters in both the standard protein and high protein group.
| Body composition parameter | Standard protein group (n: 27) | High Protein group (n: 27) | P-value* |
|---|---|---|---|
| Weight (kg) | |||
| Pre-intervention | 78,55 ± 11,18 | 76,64 ± 12,74 | |
| Post-intervention | 73,63 ± 11,46 | 72,73 ± 11,72 | |
| Pre- and post- treatment mean difference significance | <0,001p | <0,001P | |
| Change in weightT | -4,92 ± 2,57 | -3,91 ± 2,69 | 0,167 |
| Mean difference of change (95% CI) | 1,00 (-0,433 – 2,44) | ||
| Body mass index (kg/m2) | |||
| Pre-intervention | 30,02 ± 2,74 | 29,81 ± 3,31 | |
| Post-intervention | 28,22 ± 3,12 | 28,37 ± 3,28 | |
| Pre- and post- treatment mean difference significance | <0,001p | <0,001P | |
| Change in BMIT | -1,80 ± 1,00 | -1,44 ± 0,91 | 0,166 |
| Mean difference of change (95% CI) | 0,367 (-0,157 – 0,890) | ||
| Fat mass (kg) | |||
| Pre-intervention | 31,46 ± 7,69 | 28,62 ± 7,18 | |
| Post-intervention | 28,43 ± 8,65 | 25,83 ± 7,39 | |
|
Pre- and post- treatment mean difference significance | 0,001p | <0,001P | |
| Change in fat massT | -3,79 ± 1,87 | -2,79 ± 1,97 | 0,062 |
| Mean difference of change (95% CI) | 1,00 (-0,051 – 2,05) | ||
| Fat mass (%) | |||
| Pre-intervention | 39.85 ± 6.13 | 37,53 ± 7,08 | |
| Post-intervention | 37,14 ± 7,39 | 35,59 ± 7,93 | |
|
Pre- and post- treatment mean difference significance | <0,001m | <0,001P | |
| Change in fat mass percentageT | -2,71 ± 1,76 | -1,94 ± 1,62 | 0,102 |
| Mean difference of change (95% CI) | 0,767 (-0,158 – 1,691) | ||
| Muscle mass (kg) | |||
| Pre-intervention | 44.26 ± 7.11 | 45.10 ± 9.96 | |
| Post-intervention | 43.22 ± 6.73 | 44,21 ± 9,63 | |
|
Pre- and post- treatment mean difference significance | <0,001p | <0,001W | |
| Change in muscle massM | -1.04 ± 0.75 | -0,89 ± 0,75 | 0,500 |
| Mean difference of change (95% CI) | 0,148 (-0,262 – 0,558) | ||
| Muscle mass (%) | |||
| Pre-intervention | 56.54 ± 5.99 | 58,78 ± 7,06 | |
| Post-intervention | 59.11 ± 7.17 | 60,76 ± 7,72 | |
|
Pre- and post- treatment mean difference significance | <0,001p | <0,001P | |
| Change in muscle mass percentageT | 2,59 ± 1,65 | 1,97 ± 1,41 | 0,146 |
| Mean difference of change (95% CI) | -0,616 (-1,454 – 0,222) | ||
There were no harms or adverse effect reported by participants during the study. Only a few participants complained prominent hunger in the first week of the programme. The other minor complains were mild nausea and lack of energy.
Differences in baseline characteristics of subjects from high protein (HP) and standard protein (SP) group showed no statistical significance. Disparity of gender proportion within both groups, with only three men in the SP (11%) group and the seven men in HP group (26%) probably could have had an effect on the output. This in light of the discovery of Smith et al., that there was significant difference of basal and post-absorptive rate of muscle protein synthesis as well as anabolic response to feeding and exercise training between men and women with obesity in older adults12.
In this study, it was found that there were no statistically significant differences in weight, body mass index, fat mass, and muscle mass between low calories high protein diet intervention group and low calories standard protein diet. This finding contradicted the result of the study by Layman et al.7 that evaluated adult women with BMI of more than 26 kg/m2, which were divided into two groups; protein group (30% protein, 41% carbohydrate, 29% fat) and carbohydrate group (16% protein, 58% carbohydrate, 26% fat). In that study, the protein group underwent better body weight decrease with preferable fat mass/fat free mass compared to carbohydrate group.
In this study, subjects in both groups were not assigned to perform a particular exercise yet they were advised to perform their physical activity as usual, and later it was discovered that the level of physical activity had no correlation with the change in the anthropometry measurements and body composition. Meanwhile, in other studies, physical activity was shown to increase energy expenditure13,14 and helped protein synthesis15. Another marked difference between this study and the study from Layman et al.7 was that in the latter study, subjects’ compliance towards high protein intake were inevitably higher since the intake was given directly from the laboratory whereas in this study, subjects were only given intake recipes. We undertook measures to control the subjects’ compliance upon the assigned intake, with routine follow-up through daily reminder by phone and weekly meetings, yet most of subjects’ were reluctant. Moreover, we perceived that subjects in the high protein group tended to have poorer compliance than the standard protein group. It probably could have an effect on the overall result. This study were also contrary to the study by Piatti et al.15 that found that a high protein diet resulted in a better outcome of body composition even in a shorter period of intervention. Although this contradiction could be explained in part by the difference in proportion of protein over total calorie intake whereas in this study, protein made up only 30% of total calorie intake while in Piatti et al., the proportion of protein consumed was up to 45%.
In people with weight cycling, it was found that there was a disruption in protein anabolic capacity, which possibly stems from defects in amino acid transport into cell16,17. Hence, people with weight cycling need much more protein intake to increase its synthesis inside the body. A 30% protein intake in this study was possibly inadequate to compensate for the protein deficit present in people with weight cycling. We deduce that higher protein intake is required to decrease the rate of amino acid destruction since amino acid intake had already been diminished due to caloric restriction18. Moreover, the thermogenic effect of protein is so high that it will increase energy expenditure thus enhancing calories deficit. Reduction in amino acid oxidation needs to take place before nitrogen equilibrium can be achieved in the presence of efficient amino acid utilization caused by an energy deficit. Even though there are no significant difference between the two groups, the changes in anthropometry and body composition were found to be significant in pre and post intervention. Finally, this study demonstrated that total energy intake rather than protein content is the most important key in weight loss attempt19–21.
Discrepancies of results in this study from most of the other study could also be influenced by some limitations of this study. This study involving only very limited participants conducted in a relatively short period of intervention hence its power to show outcome difference among two group with small variant of protein intake was limited. The study population was representative of obese individuals with weight cycling history without any history of other disease and also considering the small sample size, these result may not be generalised to other populations. Our finding warrant further exploration on more of the obese population and with a larger sample.
In a short term weight loss program, the most important factor is caloric deficit rather than protein proportion. In obese people with weight cycling, a protein proportion of 22 – 30% among total caloric intake has not been able to affect body composition, especially muscle mass. Further research with longer intervention durations are required to discover the sufficient amount of protein which can give rise to muscle mass improvements in obese people with a weight cycling history.
Dataset 1: Harvard Dataverse. Replication Data for Comparison of low calorie-standard protein or high protein diet on body composition, malondialdehyde and glutathione, and hs-CRP level, http://dx.doi.org/10.7910/DVN/7H55FP11
Data are available under the terms of the Creative Commons Zero "No rights reserved" data waiver (CC0 1.0 Public domain dedication).
| Views | Downloads | |
|---|---|---|
| F1000Research | - | - |
|
PubMed Central
Data from PMC are received and updated monthly.
|
- | - |
Provide sufficient details of any financial or non-financial competing interests to enable users to assess whether your comments might lead a reasonable person to question your impartiality. Consider the following examples, but note that this is not an exhaustive list:
Sign up for content alerts and receive a weekly or monthly email with all newly published articles
Already registered? Sign in
The email address should be the one you originally registered with F1000.
You registered with F1000 via Google, so we cannot reset your password.
To sign in, please click here.
If you still need help with your Google account password, please click here.
You registered with F1000 via Facebook, so we cannot reset your password.
To sign in, please click here.
If you still need help with your Facebook account password, please click here.
If your email address is registered with us, we will email you instructions to reset your password.
If you think you should have received this email but it has not arrived, please check your spam filters and/or contact for further assistance.
Comments on this article Comments (0)