Keywords
Biogenetic study, EMISSION, Pinus radiata, Eucalyptus globulus Labill, Alnus acuminata, Riobamba canton
This article is included in the Climate gateway.
Biogenetic study, EMISSION, Pinus radiata, Eucalyptus globulus Labill, Alnus acuminata, Riobamba canton
The atmosphere contains many gases which, when presented in concentrations higher than normal, are poisonous to humans, animals and are harmful to plants; gases such as nitrogen oxides (NOx), sulphur (SOx), hydrocarbons, carbon monoxide (CO) and a wide variety of volatile organic compounds (VOCs) are considered primary pollutants, because they are emitted directly from a source. Secondary contaminants are formed by means of chemical reactions from the primary pollutants; ozone (O3) is found in this group1. In recent years, Ecuador has been more interested in emissions of natural origin, giving rise to inventories of volatile organic compounds nationwide, obtaining 1,855,600 tons/year in 20102. The Ministry of Environment, Ecuador (MEE) has developed emission inventories in the districts Ambato, Riobamba, Santo Domingo de los Colorados, Latacunga, Ibarra, Manta, Portoviejo, Esmeraldas and Milagro, giving a space to the biogenic emissions representing 3.3% of the total emissions in Riobamba3. Riobamba is located at an altitude of 2750 m above sea leave; it is in the Sierra Central region and constitutes the capital of Chimborazo4. The population of the rural areas of the Ecuadorian Highlands, including Riobamba, has been dedicated to agroforestry crops with commercial purposes5. Some of these plant species are exotic, which in addition to causing negative effects to the soil, emit polluting gases that react in the atmosphere, giving rise to the formation of new compounds that may have negative effects on humans6.
In this context, the objective of this study is to make an approximate quantification of the emissions of natural volatile organic compounds from the species Pinus radiata, Eucalyptus globulus L. and Alnus acuminata in the district, by the variation of plant coverings obtained based on spectral signatures, temperature analysis of the years 2014–2017 and application of the emission model proposed by Guenther.
Based on the area occupied by each species, plots of circular form are arranged with an area of 500 m2 each7 applying the equation of finite populations to obtain the sample size8:
Where: n represents the sample size; Z, 95% confidence level of = 1.96; N, study population; E, estimation error = 0.05; p, probability of success = 0.5; q, probability of failure = 0.5.
Sampling was carried out for 3 days (October 8, 9 and 10, 2018), 3750 spectral signatures of the three species under study were obtained with the Spectrum-Field Spec 4 radiometer, this in seven plots of Eucalyptus globulus L. four of Pinus radiata and four of Alnus acuminata (Table 1).
| Species | Plot number | Vegetative state | Coordinates | ||
|---|---|---|---|---|---|
| x* | y* | Altitude, m | |||
| Eucalyptus globulus L. | 1 | Small trees | 755647 | 9812023 | 3137 |
| 2 | High tress | 755397 | 9811623 | 3195 | |
| 3 | Small trees | 756075 | 9811468 | 3155 | |
| 4 | High tress | 756031 | 9811558 | 3146 | |
| 5 | High tress | 755538 | 9811849 | 3115 | |
| 6 | Small trees | 755306 | 9811364 | 3250 | |
| 7 | Small trees | 755370 | 9811303 | 3220 | |
| Pinus radiata | 1 | Small trees | 754935 | 9807413 | 3576 |
| 2 | Small trees | 754995 | 9807455 | 3549 | |
| 3 | High trees | 755735 | 9807979 | 3453 | |
| 4 | High trees | 755779 | 9808061 | 3440 | |
| Alnus acuminata | 1 | Small trees | 755796 | 9808122 | 3434 |
| 2 | Small trees | 755720 | 9808059 | 3459 | |
| 3 | Small trees | 756155 | 9811455 | 3162 | |
| 4 | Small trees | 755386 | 9811688 | 3184 | |
The spectral signatures were treated statistically with SAMS 3.2 software; for the correction of jumps, the Jump Correction tool was used, which corrects the level of reflectance in the signature. The spectra that were found out of the trend of the vegetative states of the small trees (those up to 20 cm in diameter) and high trees (those exceeding 20 cm in diameter) of the three species under study, were eliminated with the help of the software Minitab 18, obtaining the standard deviation grouped to rule out significant differences between the spectra grouped by plots.
The contact probe was used to analyze the spectral signatures of plants with the spectrum-radiometer Field Spec 4, selecting five samples distributed in a plot; each sample represents a tree, from which five leaf subsamples were taken from the canopy.
Spectral signatures were analyzed using View Spec Pro 6.2 and Minitab 18 software; the consistency of the spectral signature reflectance levels is also statistically verified using the SAMS software, discarding those that do not present a similar trend to the metadata group.
The field assessment of the normalized difference vegetation index (NDVI) is calculated from the average wavelength between 640 to 670 nm and 850 to 880 nm, and in satellite images using bands 4 and 5 of the Landsat 8 Medi satellite to Equation 29.
Where NIR is the atmospherically corrected reflectance corresponding to the near infrared and R is the atmospherically corrected reflectance corresponding to the red.
The spectral difference reflected in the NDVI is used for the comparison of forest species coverings in the years 2014–2017, obtained by a supervised classification with the maximum likelihood classifier algorithm, using as a basis Landsat 8 satellite images5,6 with a spatial resolution of 30 x 30 m per pixel. The satellite images were obtained from the portal of the United States Geological Survey (USGS) through the Global Visualization Viewer (GloVis), making a search of the satellite images of the study area (Riobamba-Ecuador) in the years 2014 and 2017 (with a maximum cloudiness of 25%), the satellite selected was Landsat 8 due to availability and good resolution per pixel. Once selected, each of the images was downloaded separately.
The calculation and the resulting maps are made with the rasterized calculator tool of the ArcGIS 10.3 software10 (QGIS is an open-access alternative), entering the bands 4 and 5 of the satellite images, extracting the values of the index of each pixel corresponding to the monitoring plots according to the vegetative state of the species.
To obtain the result, the maximum likelihood classification algorithm11 is applied using ENVI 5.3 software. This is a comparison of the effects of the satellite image with those taken as training areas, thus assigning the pixels to the class to which they most likely belong. The resulting classification was exported to shapefile format.
For the study of temperature, data from the automatic meteorological stations of: ESPOCH, UNACH, San Juan, Alao, Tunshi, Quimiag, and Urbina were used. In addition, to determine the hourly temperature, linear regression of the form ax + b was used12. These data are interpolated with the universal kriging method13, generating hourly temperature maps for the years 2014–201720.
Emissions were calculated based on the temperature schedules generated for each month. It uses the biomass density values and emission factors for monoterpenes and BVOC proposed by Guenther, described in the Underlying data. Table 1.
The time emissions of monoterpenes were calculated by means of the formulas posed by Guenther2.
Where Emon (k, time) is hourly emission of monoterpenes in each K cell (µg/h), is standard emission factor of monoterpenes associated with J category soil use (µg/g.h), FBDj is density of foliar biomass of the J class of soil use (g/m2), Ais area of each cell (900 m2) and M(T): environmental correction factor belonging to the temperature (Equation 4).
Where: β is an empirical coefficient (0.09°K-1); T is leaf temperature (equal to environmental temperature in °K); Ts is standard temperature (303 °K),
Daily emissions are obtained using Equation 5.
Monthly emissions are obtained using Equation 6.
The calculation of the annual emissions of monoterpenes is obtained through Equation 7.
These are calculated with Equation 8, which was also used previously for the calculation of monoterpenes, considering the variation of emission factors2.
Where: EBVOC (k, time) is the hourly emission of BVOC in each K cell (µg/h) and is the standard emission factor of BVOC associated with the J category of soil use (µg/g.h).
Daily, monthly and annual emissions of other volatile organic compounds are obtained by Equation 5, Equation 6 and Equation 7, respectively.
The experimental application consisted of measurements of VOC and NO2 concentrations, using the Aeroqual S-500 gas analyzer equipment between 11:00 and 15:00, due to the higher daily temperatures occurring in this range.
The analysis of the existing correlation of the meteorological variables (temperature, solar radiation and wind velocity) with VOC concentrations was performed using Pearson's product-moment correlation coefficient14. Two-way ANOVA with post hoc Turkey’s test were used for the statistical analysis of the NO2 concentrations, grouping the variables temperature and global solar radiation. For the graphical analysis, the moving average method of order 3 was applied to obtain a smoothing of the curves14. In addition, the Pearson correlation method was used to assess the linear correlation between the VOC concentrations in the plantations of each plant species with the following variables: temperature, global solar radiation and wind speed.15. Statistical analyses were performed using Minitab v18 (Minitab, Inc.).
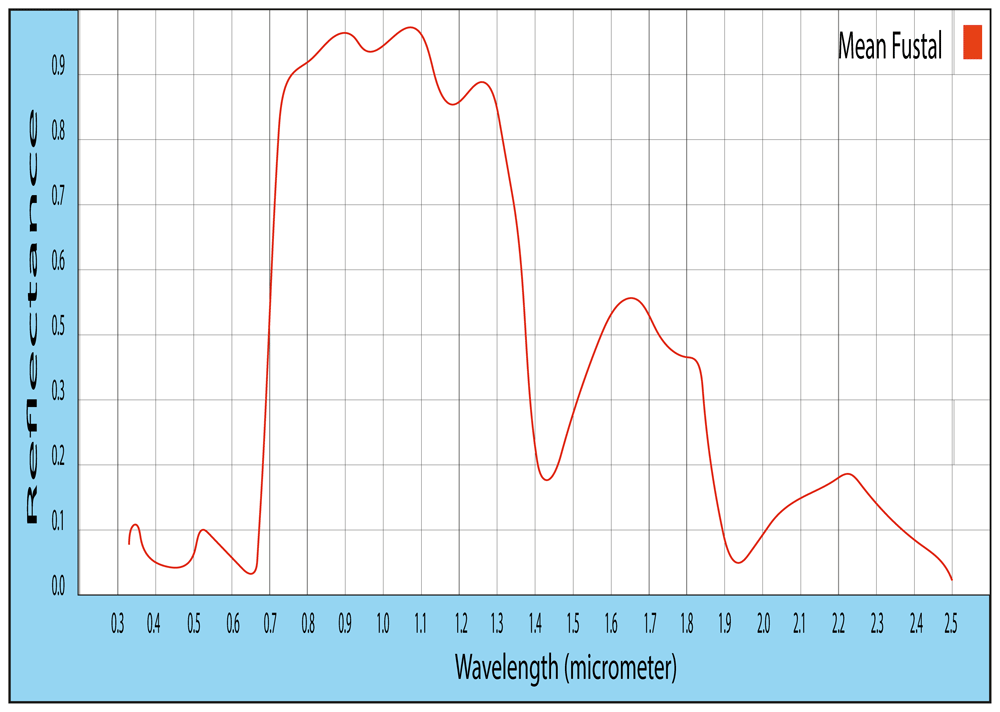
In the spectral signature of Eucalyptus globulus L., the reflectance level in the vegetative states (sapling and timber) does not differ significantly in the range comprising the NDVI; the highest peak of the sapling state has a reflectance of 72.18% and a timber of 72.27%15. This is due to the similarity in the structure of the leaves in the two vegetative states.
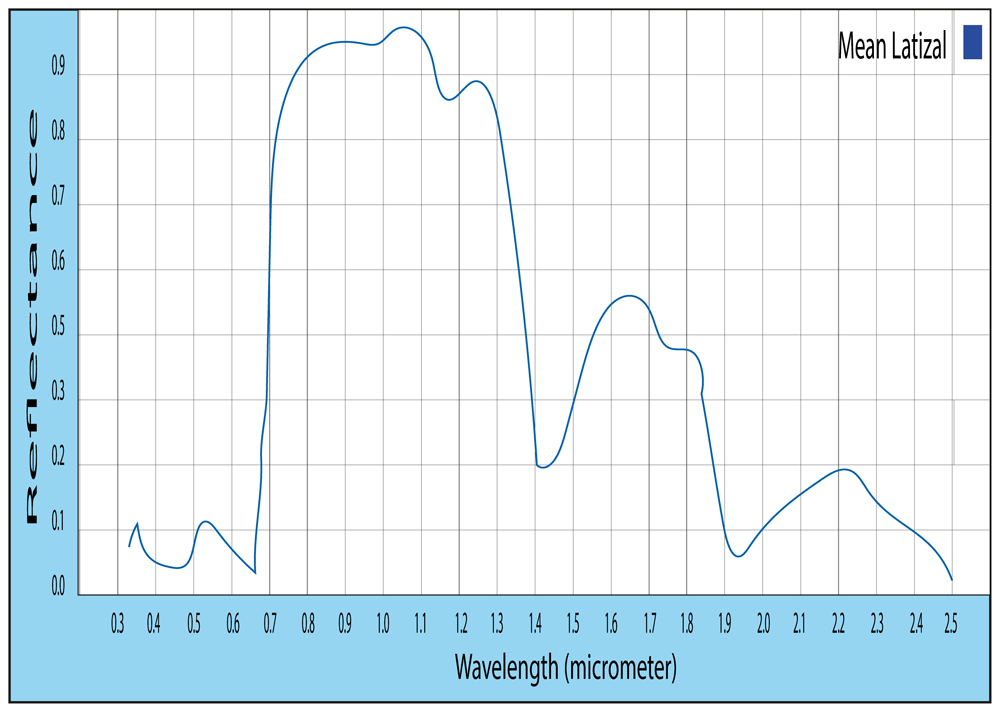
The spectral signature of Pinus radiata shows that the reflectance levels of the sapling state are slightly higher (83.82% in the highest peak), while in the timber the highest peak corresponds to 82.36% of reflectance.
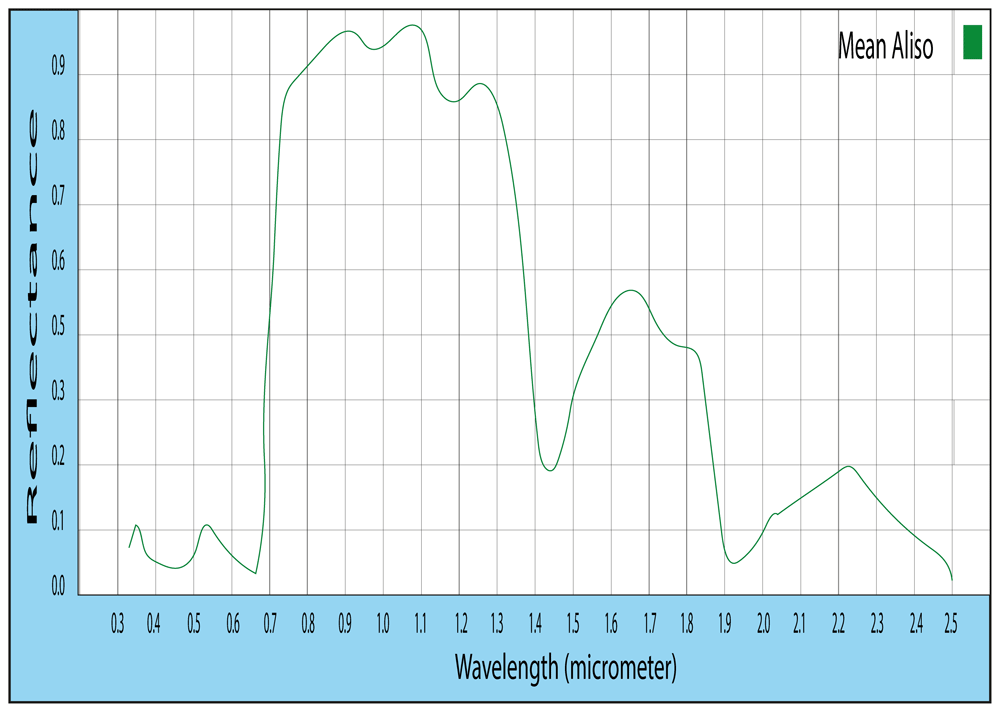
In the spectral signature of Alnus acuminata, the representative spectral signature in the sapling state shows that the highest peak has 83.13% reflectance at wavelength 880 nm, which is located in the range comprising the NDVI.
The NDVI values obtained in the field are elevated values approximated to 1, being dense and healthy vegetation16. The highest value is presented in the sapling state of Alnus acuminata (0.887) and the lower result of the index corresponds to the species of Pinus radiata (0.795), whereas in the timber state, the highest value (0.808) corresponds to Eucalyptus Globulus L. and the lowest (0.819) to Pinus radiata (see Underlying data: Table 2).
Using the information from the NDVI maps of the satellite images, it was determined that in the year 2014 the minimum value (0.303) was of Pinus radiata in the timber state, and the highest in sapling state (0.622). In the year 2017, the highest value (0.537) corresponding to Pinus radiata in timber state and the lowest (0.384) is of Alnus acuminata.
The plant coverings in the years 2014–2017 for the three forest species were obtained through a supervised classification, taking advantage of the spectral difference found in the NDVI values. The reliable results were verified by means of the maximum likelihood algorithm reflected in the confusion matrix, surpassing the value of 0.85 in the Kappa coefficient, considered an almost perfect classification according to Landi and Koch17.
The variation in the area covered by forest species is important (Figure 4, Figure 5), especially in Eucalyptus globulus L., which has suffered greater deforestation, and in the last three years it has decreased 469.22 ha, and Pinus radiata has reduced 228.11 ha in the same time. Since in the year 2014 no plantations were found; in 2017 there were 44.31 ha, located mainly in the Cacha parish due to the existing deforestation programs.
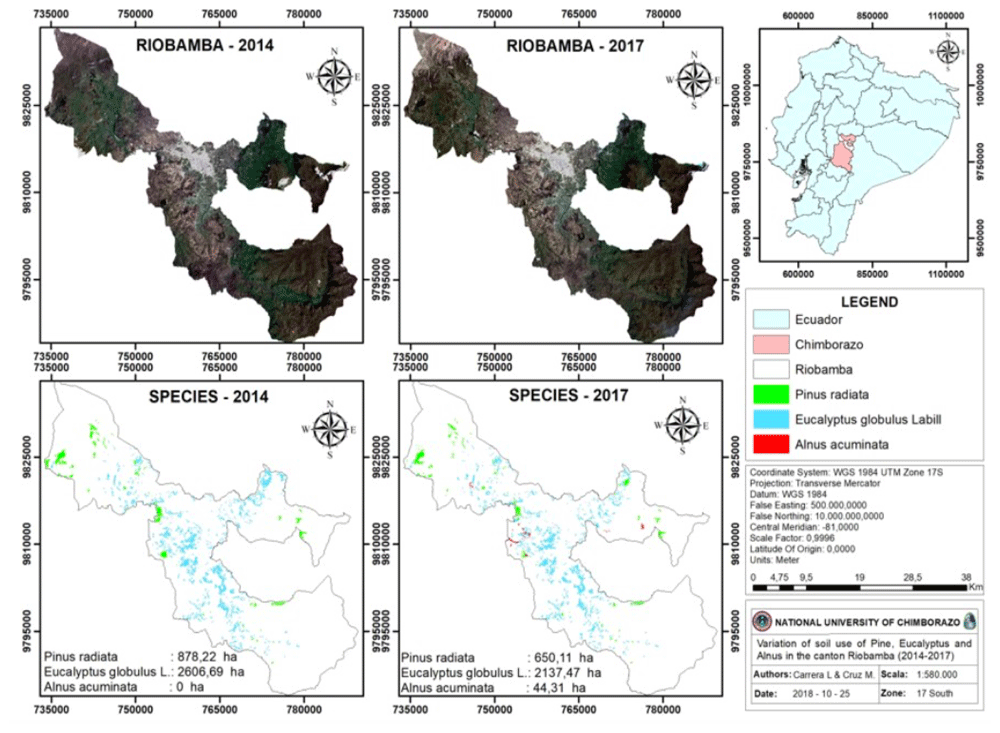
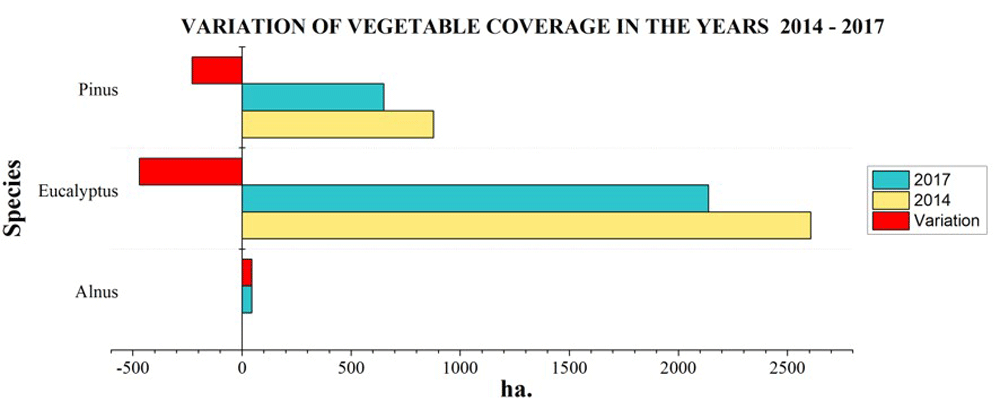
The annual gross deforestation in Riobamba shows that species planted for commercial purposes, such as Pinus radiata, contributes towards 76.04 ha/year of deforestation. Eucalyptus globulus L. is deforested by 156.41 ha/year, in contrast to Alnus acuminata, the area of which has increased by 14.77 ha/year. These values represent an important part of the average annual gross deforestation in Chimborazo16, which reaches 928 ha/year.
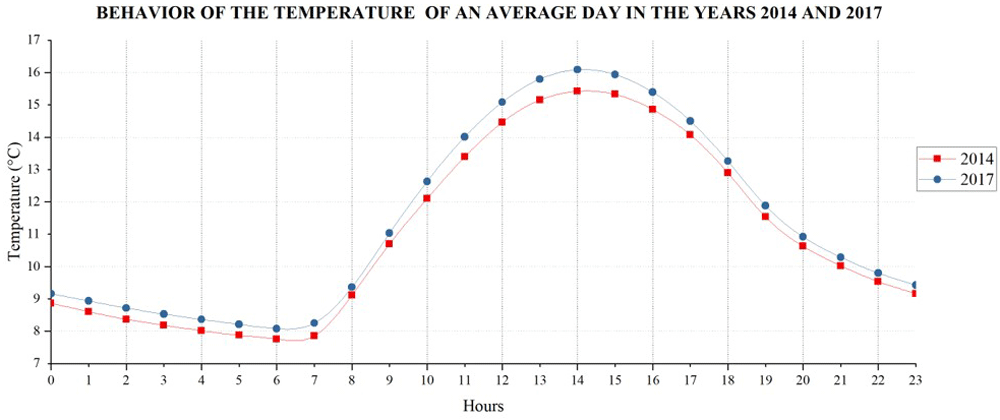
The temperature variations with respect to time obtained from geostatistical analysis (Figure 6) shows that in the year 2017 the average hourly temperatures are slightly higher than in the year 2014, emphasizing from 13:00 to 15:00 hours, time with the highest temperatures.
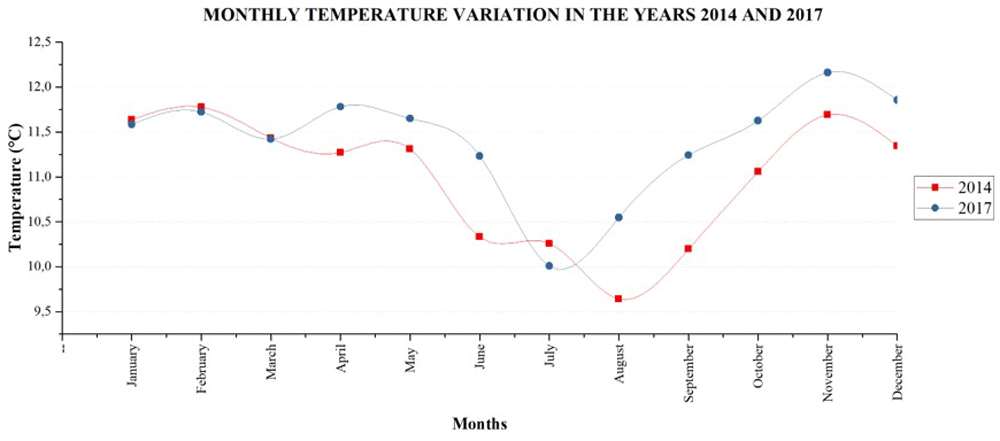
Temperature behaves similarly in the two years (Figure 7), but it is evident that in 2014 August is the month with the lowest average temperature, reaching 9.64°C, whereas, in 2017 July has the lowest average monthly temperature (10.01°C). The highest monthly average temperature values recorded in 2014 correspond to February (11.78°C); however, November 2017 has a higher value (12.16°C), thus, conditioning the emissions of natural VOC.
Monthly emissions of monoterpenes in the year 2014 were due in a greater proportion to the species of Eucalyptus globulus L. surpassing 5.40 tons, especially in February and November (Figure 8). Pinus radiata emitted monoterpenes to a lesser amount, reaching maximum emissions of 3.03 tons in November. Alnus acuminata emissions were not recorded due to the absence of plantations.
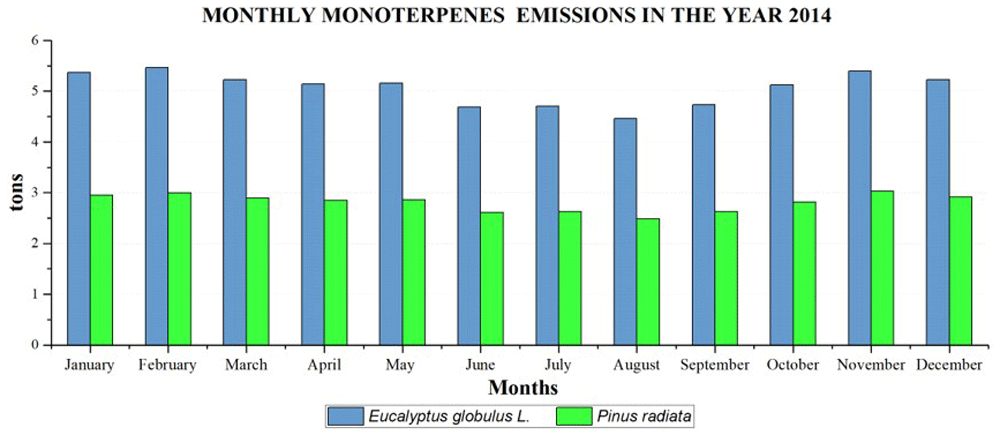
The emissions of monoterpenes in 2014 of Eucalyptus Globulus L. correspond to 60.68 ton/year and 33.67 ton/year of Pinus radiata.
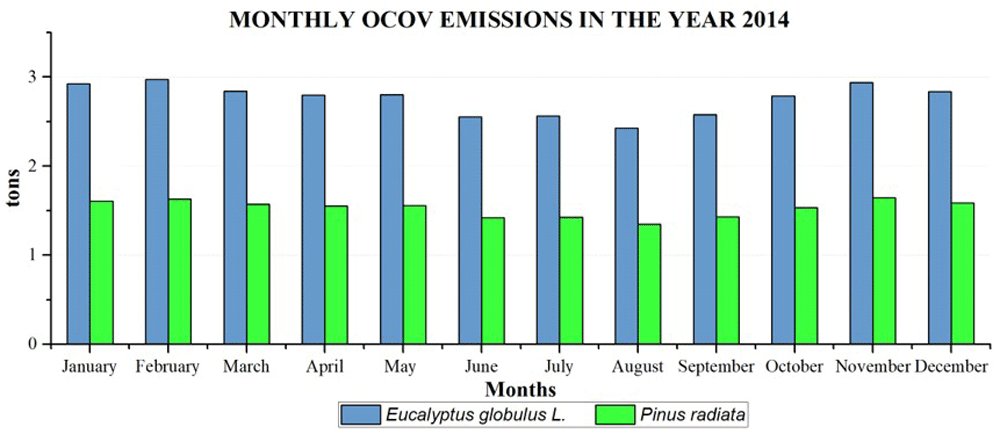
Monthly emissions of BVOC in the year 2014 follow a similar annual pattern to monoterpenes. The emissions of Eucalyptus globulus L. and Pinus Radiata emit between 2.4 and 3 tons per month, reaching a maximum of 1.65 tons in November (Figure 9). The total emissions of BVOC in 2014 by Eucalyptus Globulus L. were 33.01 ton/year and for Pinus radiata were 18.32 ton/year.
For monthly emissions of monoterpenes in the year 2017, the highest emissions are generated by Eucalyptus globulus L. (Figure 10) and correspond to the month of November (4.39 tons). The lowest by Eucalyptus globulus L. occurred in July (3.59 tons). Pinus radiata emissions do not exceed 2.29 tons per month, evidencing that Alnus acuminata species presents extremely low emissions compared to the other species, reaching maximum emissions of 0.031 tons in November.
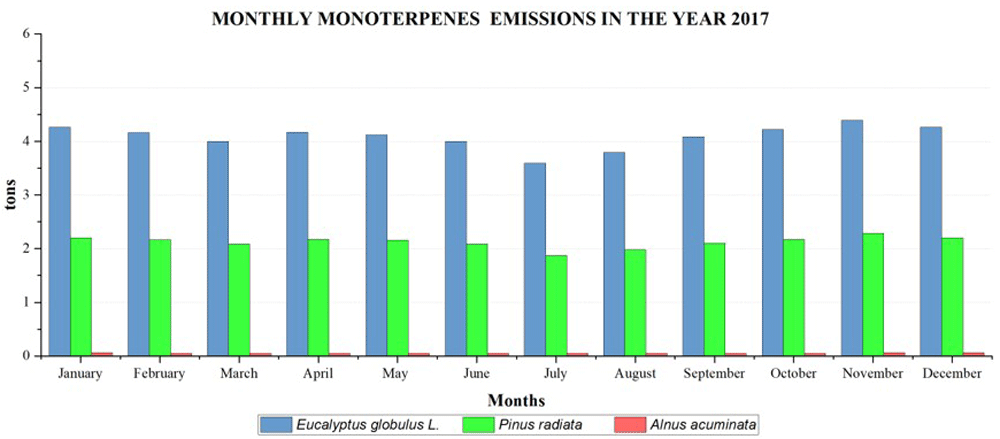
Total emissions of monoterpenes in the 2017 were reduced due to the decreased vegetal cover of each species, presenting emissions of 49.05 ton/year for Eucalyptus globulus L., 25.49 ton/year for Pinus radiata and 0.035 ton/year for Alnus acuminata; only the latter has increased, since in 2014 it was not possible to find plantations.
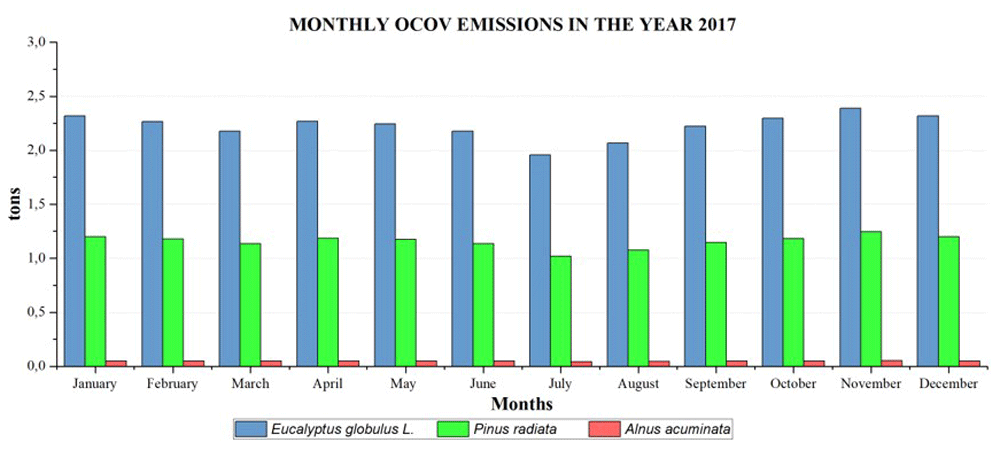
Concerning monthly emissions of BVOC in the year 2017, the highest emissions for Eucalyptus globulus L. and Pinus Radiata occur in November (2.39 and 1.34 ton), and the lowest emissions were in July (1.95 and 1.02 ton). Emissions of Alnus acuminata have increased, reaching 0.051 tons in November and 0.41 in July, being the highest and lowest monthly emissions, respectively.
The total emissions of BVOC in 2017 in Eucalyptus Globulus L. was 26.29 ton/year and in Pinus radiata was 13.87 ton/year. These two species emit larger amounts of BVOC than Alnus acuminata, which only reached 0.571 ton/year.
According to Pearson correlation coefficient analysis with a confidence level of 99%, VOC concentrations in plantations of Pinus radiata. have a positive significant linear correlation that is higher with temperature (R2=0.725) and global solar radiation (R2=0.535) (Figure 12), indicating that as temperature and radiation increase, VOC emissions also increase.
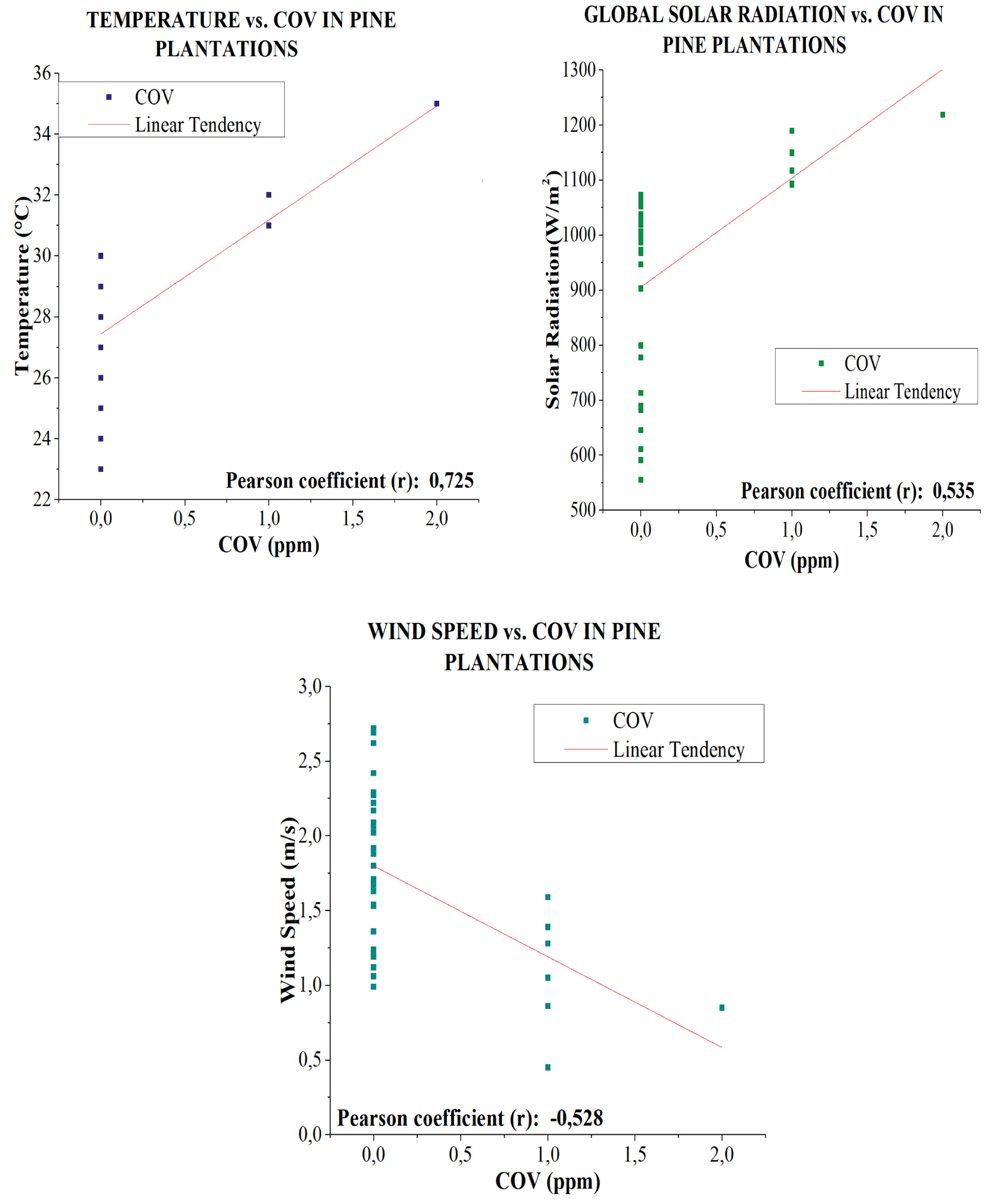
Wind velocity has a significant negative linear correlation (R2=0.528) with VOC emissions (Figure 12), i.e., when wind velocity is lower, gases tend to accumulate in the planting area, thus increasing the concentration.
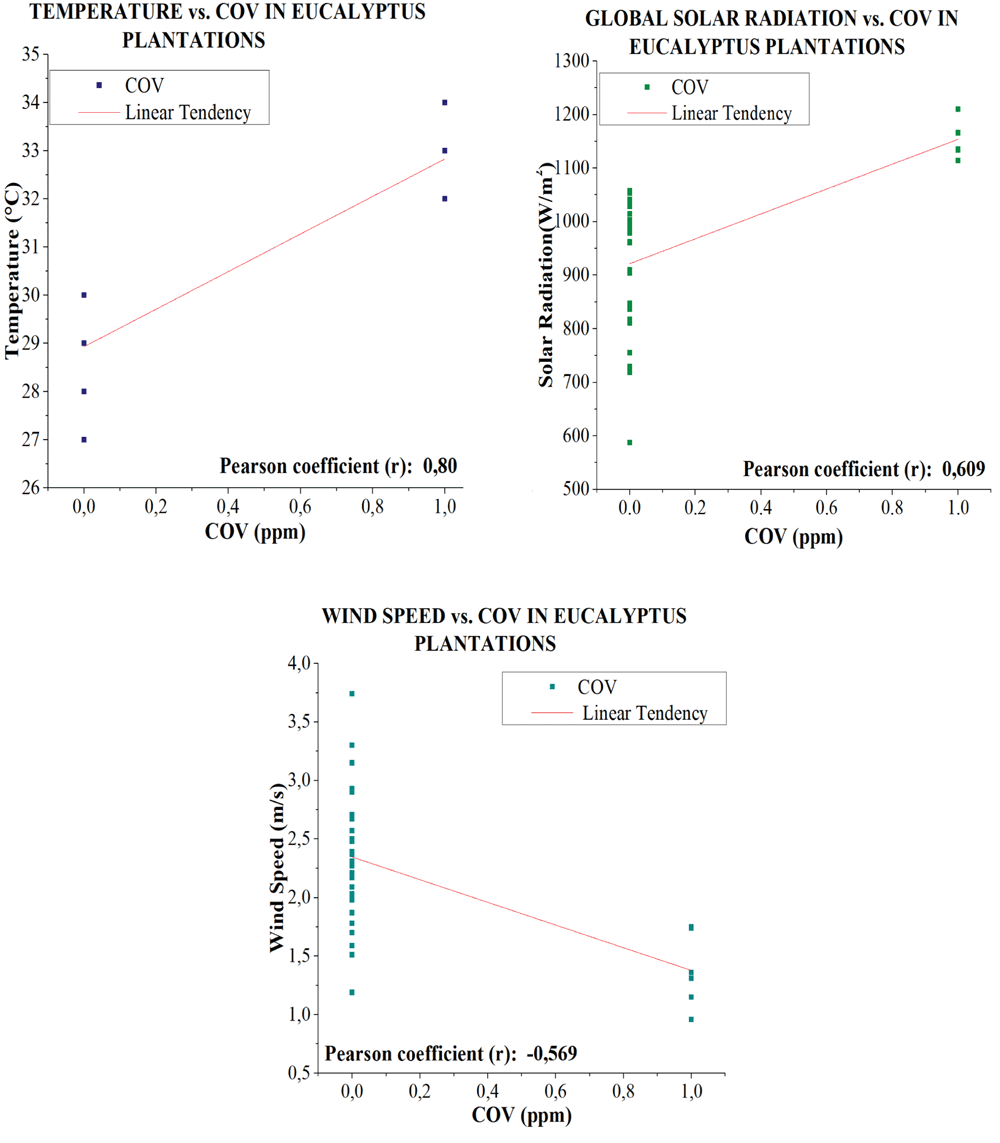
VOC concentrations in plantations in Eucalyptus globulus L. show a positive significant linear correlation with temperature variables (R2=0.80) and global solar radiation (R2=0.609), and a significant negative linear correlation with wind velocity (R2=-0.569) (Figure 13).
The linear relationship between VOC and meteorological variables is lower in Pinus radiata compared to Eucalyptus globulus L., demonstrating a lesser influence of the meteorological variables on VOC emissions in Pinus radiata plantations.
Concentrations in the air were nil; this behavior can be related to the lower presence of existing biomass and low values of emission factors, especially monoterpenes.
Two-way ANOVA showed that the average concentrations of NO2 do not differ from each other when related to the variables of temperature and solar radiation, in plantations of Pinus radiata, Eucalyptus globulus L, and Alnus acuminata (Underlying data: Table 3).
The trend between the concentrations of NO2 and the variables temperature and global solar radiation is similar in plantations of Pinus radiata, Eucalyptus globulus L., and Alnus acuminata, demonstrating the relationship between the behavior of the climatic variables and NO2 concentrations in an environment with low anthropogenic intervention.
The representative spectral signatures of each species were obtained. The reflectance values were similar in the vegetative and timber states, allowing the generalization in each species, finding that the maximum level of reflectance in Eucalyptus Globulus L. is 72.2%, in Pinus radiata is 83.8% and in Alnus acuminata is 83.1%. The spectral difference found among the species allowed the obtaining of the NDVI vegetation index, which served as a basis for an optimum dissolution among classes, identifying the exact geographical location of each plant species.
Temperature determines the emission of volatile organic natural compounds, particularly between the time range between 13:00 and 15:00. The spatial distribution of the temperature with respect to time indicated that biogenic emissions are concentrated in the central area of the parish, depending on the presence of forest plantations. In the year 2014, February was the month with higher temperatures reaching an average of 11.78°C, whereas, in the year 2017 the highest average temperature reached is 12.16°C in November. The lower average temperatures in 2014 was August (9.64°C) and in 2017 was July (10.01°C).
Emissions of monoterpenes by Eucalyptus globulus L. in 2014 were 60.68 ton/year and were 49.05 ton/year in 2017. Emissions of BVOC were 33.01 tons in 2014 and 26.29 tons in 2017. Pinus radiata emitted 33.67 ton/year of monoterpenes in 2014 and 25.49 ton/year in 2017. Emissions of BVOC in 2014 were 18.32 ton/year, and were 13.87 ton/year in 2017. In 2017, Alnus acuminata emitted 0.035 tons/year of monoterpenes and 0.571 tons/year of BVOC. Eucalyptus globulus L. is the species with the highest emissions in both years due to the greater number of plantations, followed by Pinus radiata and Alnus acuminata. At the general level, Eucalyptus globulus L. and Pinus radiata record a decrease in emissions in 2017 when compared with 2014, which is linked to deforestation; unlike Alnus acuminata, which exhibited a small increase in plantations due to existing reforestation plans, so increased in emissions in the same way.
Figshare: Raw data for Biogenetic study of the emissions of species: Pinus radiata, Eucalyptus globulus Labill and Alnus acuminata in Riobamba canton, Ecuador, https://doi.org/10.6084/m9.figshare.8081216.v121
This project contains the following underlying data:
- Spreadsheet containing raw toxicity data for biomass density and emission factors for monoterpenes and OCOV (Table 1), calculated values of the Normalized difference vegetation index (Table 2) and analysis of variance for NO2 concentrations (Table 3)
Figshare: Raw data for NVDI calculation, https://doi.org/10.6084/m9.figshare.8323670.v122
Figshare: Temperatures for each plot and each month, https://doi.org/10.6084/m9.figshare.8323688.v123
Figshare: Monoterpenes/BVOC, https://doi.org/10.6084/m9.figshare.8323715.v124
Figshare: Categories of Soil Use, https://doi.org/10.6084/m9.figshare.8323799.v125
Figshare: VOC and NO2 levels for each plot, https://doi.org/10.6084/m9.figshare.8323832.v126
Data are available under the terms of the Creative Commons Attribution 4.0 International license (CC-BY 4.0).
| Views | Downloads | |
|---|---|---|
| F1000Research | - | - |
|
PubMed Central
Data from PMC are received and updated monthly.
|
- | - |
Provide sufficient details of any financial or non-financial competing interests to enable users to assess whether your comments might lead a reasonable person to question your impartiality. Consider the following examples, but note that this is not an exhaustive list:
Sign up for content alerts and receive a weekly or monthly email with all newly published articles
Already registered? Sign in
The email address should be the one you originally registered with F1000.
You registered with F1000 via Google, so we cannot reset your password.
To sign in, please click here.
If you still need help with your Google account password, please click here.
You registered with F1000 via Facebook, so we cannot reset your password.
To sign in, please click here.
If you still need help with your Facebook account password, please click here.
If your email address is registered with us, we will email you instructions to reset your password.
If you think you should have received this email but it has not arrived, please check your spam filters and/or contact for further assistance.
Comments on this article Comments (0)