Keywords
Cone beam CT, linear measurements, accuracy, direct measurements, field of view, stitched images.
Cone beam CT, linear measurements, accuracy, direct measurements, field of view, stitched images.
A new co-author has been added:
Mostafa Mohamed El Dawlatly MSc., MOrth RCS(Ed), PhD, who was involved in setting the measuring protocol on the skulls, taking the study photos and in writing the article manuscript.
To read any peer review reports and author responses for this article, follow the "read" links in the Open Peer Review table.
The use of cone beam computed tomography (CBCT) machines in dentistry started in the second half of the 1990s1. Now, CBCT is extensively used in the dental field for implant planning, in endodontics, maxillofacial surgeries and orthodontics2.
In the field of orthodontics, analysis of cephalometric radiographs requires accurate identification of specific landmarks for precise measurements between these landmarks3. As a consequence, the small field of view (FOV) CBCT systems available in small clinics cannot yet satisfy the needs of maxillofacial surgeons or orthodontists4. Thus, visualizing all of these landmarks on the same scan is not always possible5.
In order to compensate for this shortcoming, small FOV images can be scanned and then fused together to produce a single large FOV image. However, there are few data to show whether this fused image is as precise as a single image of the whole area of interest4,6.
Therefore, the aim of the current study was to assess the diagnostic accuracy of stitched CBCT linear measurements versus direct measurements on skulls.
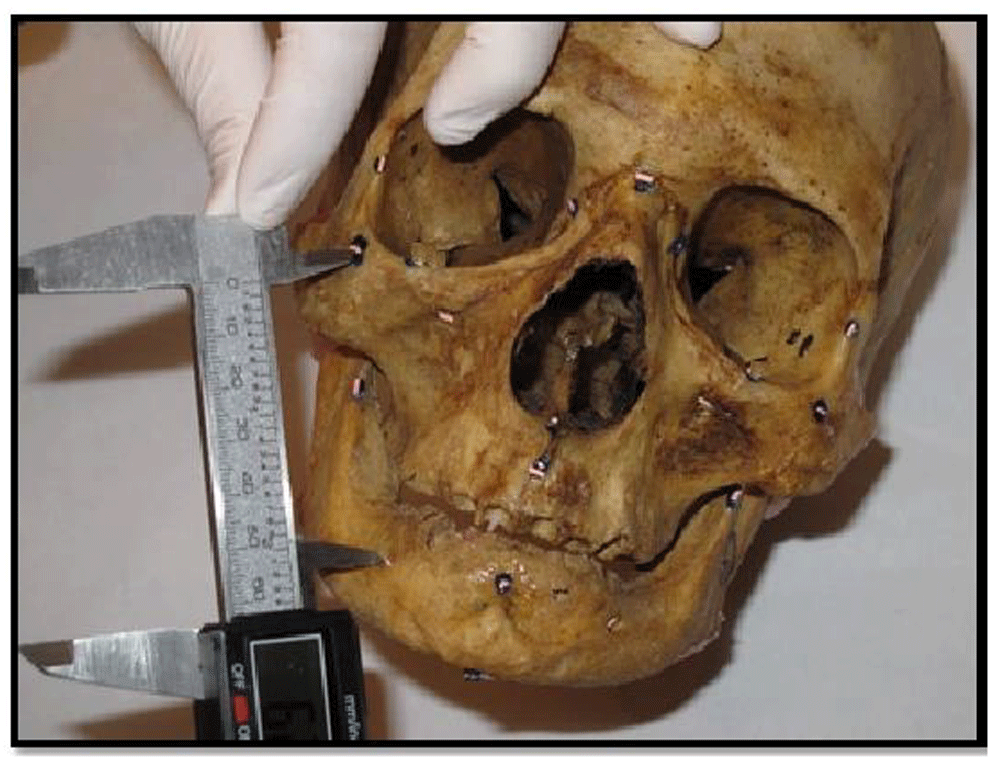
The current study was conducted on nine dry human skulls obtained from the Anatomy department, Faculty of Medicine, Cairo University to avoid the exposure of living humans to unnecessary radiation doses. 26 anatomical landmarks were identified on each skull (Table 1). Gutta percha cones (GE16121542, META BIOMED) were glued and used as radiopaque markers (Figure 1–Figure 3).
22 linear measurements were taken and recorded using a high precision sliding digital caliper (6400192, Allendale Electronics Ltd, Hertfordshire, UK). Ten measurements in the cranio-caudal plane (Table 2), two measurements in the antero-posterior plane (Table 3), and ten measurements in the medio-lateral plane (Table 4). 22 direct linear measurements were measured and were considered to be the gold standard in the study (Figure 4–Figure 6).
| ANS-PNS | Anterior nasal spine to posterior nasal spine. |
| AR(R)-PR(R) | Right anterior ramus to right posterior ramus. |


For soft tissue simulation, the skulls were covered with 20 layers of pink modelling wax (1mm thick each) (Tenatex eco, Kemdent) to achieve an average of 14–16 mm wax thickness7.
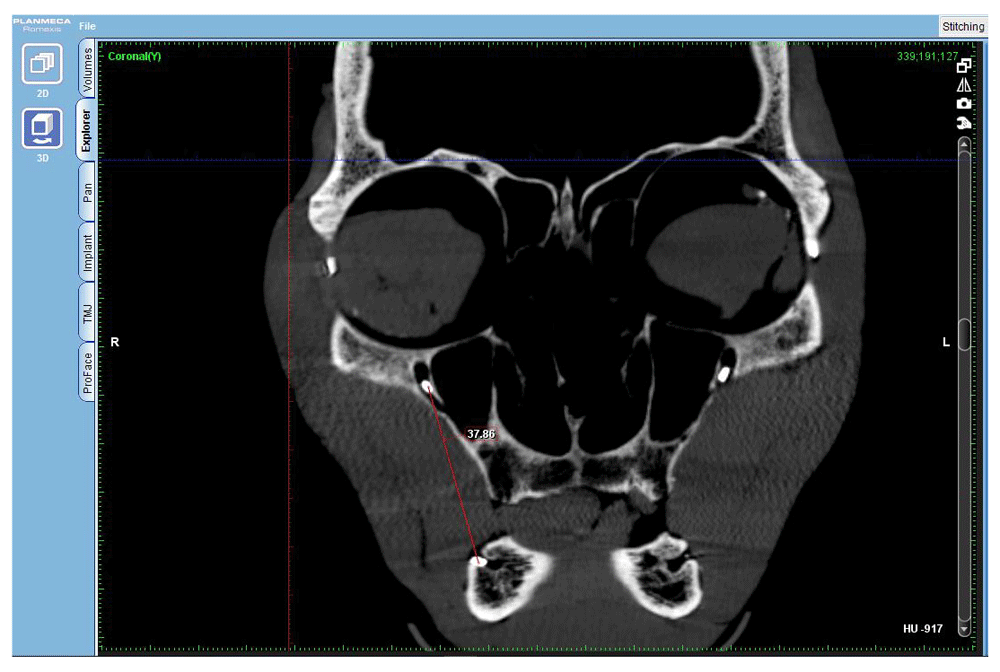
The skulls were stabilized in the Planmeca ProMax 3D Mid CBCT machine using a wooden stand passing through the foramen magnum and were oriented using the laser beams (Figure 7). Three consecutive FOVs were scanned: two scans each of the size 160 ×60 mm (single arch) for the mandible and the maxilla separately (Figure 8 and Figure 9) and one scan with a FOV size 200 ×100 mm for the upper third of the face (Figure 10). Each one of the three FOVs was scanned separately using a voxel resolution 0.2 mm, 90 kVp and 10 mA, then stitching was performed using Romexis software (Planmeca Romexis Viewer Launcher 4.5.0.R) creating one large volume (Figure 11). After completion of the stitching procedure the linear measurements were obtained from the stitched CBCT images for a later comparison with the gold standard (Figure 12 and Figure 13).


Statistical analysis was performed on SPSS (version 17). For assessment of the agreement between all measurements with the reference method, Dahelberg error (DE), and Relative Dahelberg Error (RDE) were used together with Intra-class Correlation Coefficients (ICC) including the 95% confidence limits of the coefficient calculated assuming analysis of variance two-way mixed model ANOVA with absolute agreement on SPSS. To measure and quantify the size of the differences, Bland and Altman 95% confidence Limits of Agreements (LOA) were applied.
The results of the current study showed that, the difference between the mean of the direct linear measurements and the mean of the linear measurements conducted on the stitched CBCT images ranged from (-0.25 mm to 0.5 mm), the positive and negative values indicating that there was no obvious pattern of over or underestimation in the stitched CBCT measurements.
N – Nasion, ANS - Anterior nasal spine, PNS - Posterior nasal spine, A – A point, B – B point, Me – Menton, ZYF - Zygomatic foramen, Co – Condyle, GO – Mandibular gonion, MOR – Medial orbital wall, LOR – Lateral orbital wall, ORF – infra-orbital foramen, GP – Greater palatine foramen, MF – Mental foramen, AR – Anterior ramus, PR – Posterior ramus, R – right, L - left
Mean absolute difference of all measurements was (0.11± 0.12 mm). Bland and Altman Lower limit of agreement ranged from (-0.92 mm to -0.06 mm). Bland and Altman Upper limit of agreement ranged from (0.1 mm to 1.24 mm).
The absolute Dahlberg error between direct linear measurements and linear measurements on stitched CBCT images ranged from (0.07 mm to 0.41 mm). The relative Dahlberg error ranged from (0.2% to 1.8%). Moreover, Intra-class Correlation Coefficient (ICC) ranged from (0.97 to 1.0). (Table 5).) indicating excellent agreement.
The smaller the scan FOV, the higher the spatial resolution of the image8. Stitching of small CBCT images to create a large image can be very useful to collect the needed cranio-maxillofacial data with small FOV machines9. Increasing the FOV can be done by automatically fusing up to three small FOVs to obtain a larger FOV10.
CBCT ‘‘Stitching’’ option could be useful but whether it is precise enough to obtain accurate and reliable measurements remains doubtful11. Assessing the accuracy of stitched CBCT measurements is infrequently mentioned in current literature, as in the studies conducted by Kopp and Ottl; 2010, Kim et al.; 2012, Egbert et al.; 2015, and Srimawong et al.; 20155,8,10,12.
The results of the current study showed that the relative Dahlberg error ranged from 0.2% to a maximum of 1.8%. Consequently, the error was considered small and clinically non-significant as the measurement error in craniofacial imaging is considered clinically acceptable up till the value of 5%13,14.
The results of the current study go in agreement with the study performed by Srimawong et al.; 2015 on 10 dry human mandibles12. Their results showed that, the mean absolute differences between direct measurements and stitched CBCT measurements for vertical and horizontal distances were (0.27±0.24 mm) and (0.34±0.27 mm), respectively. Their results showed that the stitched CBCT measurements were highly accurate comparable to the direct measurements.
In support of the present results, Egbert et al.; 20158 research revealed that the mean difference between the direct linear measurements and the stitched CBCT measurements was 0.34 mm with a 95% confidence interval of (0.24 to 0.44 mm). They concluded that the precision of stitched CBCT measurements allow accurate construction of implant surgical stents.
Moreover, the results of Kopp and Ottl; 201010 further agree with those obtained from the current study. They used an automated method to increase the FOV of CBCT images by stitching three small FOV volumes to obtain a larger FOV one. They concluded that, the stitching software was accurate in the obtained linear measurements.
On the same line of agreement, a study was performed by Kim et al.; 20125 to investigate whether images of skulls obtained by both manual and automatic stitching of three CBCT images, provided accurate measurements as those obtained by multidetector computed tomography (MDCT). The results showed that the mean difference between automatically stitched CBCT images and the reference images ranged from (-0.8944 mm to -1.0628 mm).
Stitched CBCT linear measurements were highly comparable to the direct skull measurements. However, a percent of error should be expected from CBCT-derived measurements.
Underlying data is available from Open Science Framework
OSF: Dataset 1. Accuracy of Linear Measurements Obtained from Stitched Cone Beam CT Images Versus Direct Skull Measurements https://doi.org/10.17605/OSF.IO/SUTWK15
| Views | Downloads | |
|---|---|---|
| F1000Research | - | - |
|
PubMed Central
Data from PMC are received and updated monthly.
|
- | - |
Competing Interests: No competing interests were disclosed.
Is the work clearly and accurately presented and does it cite the current literature?
Yes
Is the study design appropriate and is the work technically sound?
Yes
Are sufficient details of methods and analysis provided to allow replication by others?
Yes
If applicable, is the statistical analysis and its interpretation appropriate?
Yes
Are all the source data underlying the results available to ensure full reproducibility?
Yes
Are the conclusions drawn adequately supported by the results?
Yes
Competing Interests: No competing interests were disclosed.
Reviewer Expertise: dental implantology, biomaterial in tissue regenneration.
Is the work clearly and accurately presented and does it cite the current literature?
Yes
Is the study design appropriate and is the work technically sound?
Yes
Are sufficient details of methods and analysis provided to allow replication by others?
Yes
If applicable, is the statistical analysis and its interpretation appropriate?
Yes
Are all the source data underlying the results available to ensure full reproducibility?
Partly
Are the conclusions drawn adequately supported by the results?
Partly
References
1. Jobe RP, Laub DR: Combined surgical reconstruction of the maxilla and mandible for vertical disproportion.Plast Reconstr Surg. 1970; 46 (3): 252-5 PubMed Abstract | Publisher Full TextCompeting Interests: No competing interests were disclosed.
Alongside their report, reviewers assign a status to the article:
| Invited Reviewers | ||
|---|---|---|
| 1 | 2 | |
|
Version 2 (revision) 02 Mar 20 |
read | |
|
Version 1 07 Feb 19 |
read | read |
Provide sufficient details of any financial or non-financial competing interests to enable users to assess whether your comments might lead a reasonable person to question your impartiality. Consider the following examples, but note that this is not an exhaustive list:
Sign up for content alerts and receive a weekly or monthly email with all newly published articles
Already registered? Sign in
The email address should be the one you originally registered with F1000.
You registered with F1000 via Google, so we cannot reset your password.
To sign in, please click here.
If you still need help with your Google account password, please click here.
You registered with F1000 via Facebook, so we cannot reset your password.
To sign in, please click here.
If you still need help with your Facebook account password, please click here.
If your email address is registered with us, we will email you instructions to reset your password.
If you think you should have received this email but it has not arrived, please check your spam filters and/or contact for further assistance.
Comments on this article Comments (0)