Keywords
Arabidopsis, plastid rhomboid proteins, alternative splicing, short RNA transcript production
Arabidopsis, plastid rhomboid proteins, alternative splicing, short RNA transcript production
The rhomboid protein gene system in Arabidopsis is complex with 13 transcribed genes encoding both “active” and “inactive” rhomboid protein types (Knopf & Adam, 2012; Koonin et al., 2003; Tripathi & Sowdhamini, 2006). A recent survey of the databases indicates at least 22 entries for Arabidopsis (Powles & Ko, 2018). These entries encompass the same range of rhomboid types as that observed in other organisms (Lemberg & Freeman, 2007). One intriguing aspect about these different rhomboids is that they appear to operate simultaneously, such as in the Arabidopsis plastid compartment. In Arabidopsis, there are four distinct plastid rhomboid genes predicted - two encoding “active” types (At1g25290 and At5g25752) and two encoding “inactive” forms (At1g74130 and At1g74140). This number is further increased by alternative splicing, as reported for At1g25290 and At1g74130 (Powles et al., 2013; Sedivy-Haley et al., 2012). Alternative splicing of At1g25290 transcripts introduced variant forms with and without a putative cyclin-binding RVL motif (Sedivy-Haley et al., 2012). For At1g74130, alternative splicing generated three variants with different carboxyl segments, changing from a predicted seven to a six transmembrane structure (Powles et al., 2013). These three At1g74130 variants exhibited different functionalities, such as their interactions with the Tic40 substrate and the yeast mitochondrial rhomboid protease Rbd1 and Mgm1 in live cell contexts, and their abilities in sensitizing cells to antimicrobial drugs (Powles et al., 2013; Powles & Ko, 2018). These different functionalities are especially interesting since one potential role of At1g74130 appears to be in the early stages of tissue development and plastid biogenesis (Sedivy-Haley et al., 2011).
The picture emerging for the Arabidopsis plastid rhomboids suggests that alternative splice variants are involved in regulatory type activities. Such a phenomenon is observed in other organisms, such as for the human rhomboid gene RHBDD2, as an example (Abba et al., 2009). The levels of the two alternatively spliced RHBDD2 mRNAs were elevated in breast cancer cell lines (Abba et al., 2009). In terms of other regulatory roles, rhomboid proteins themselves are often associated with regulatory activities in different organisms and in a range of cellular pathways, such as development, mitochondrial membrane remodeling, protein transport, quorum sensing, and stress response (see examples in Adrian & Freeman, 2012; Jeyaraju et al., 2013; Lemberg, 2013; McQuibban et al., 2003; Sedivy-Haley et al., 2011; Sekine et al., 2012; Stevenson et al., 2007; Thompson et al., 2012; Urban, 2006; Yan et al., 2008). The possibility of alternative splicing contributing further to these different types of regulatory activities is thus intriguing and warrants investigation.
It is now clear that to understand how the plastid rhomboid system works, it is necessary to identify all potential rhomboid variants in play. This study was thus designed to examine the splicing activities of At1g74140, a close relative to At1g74130 and located tandemly next to At1g74130. An analysis of the At1g74140 transcript population would help uncover potential modes of operation for this gene and its possible role in Arabidopsis plastids.
Growth chambers were used to propagate the plants employed in this study. The cultivation conditions for the Arabidopsis line CS60000 (“wild-type”) were derived from information posted on the Arabidopsis Biological Resource Center (Ohio State University) website (http://abrc.osu.edu) (Arabidopsis Biological Resource Center, RRID:SCR_008136) (Alonso et al., 2003). The growth chamber parameters used were: 21°C; 70% humidity; and a 16:8 hour light:dark photoperiod using 150–200 μmol·m-2·s-1 of fluorescent and incandescent lighting. Seeds were cold stratified for 3 days before transfer to growth chambers. All plants were subjected to a regime of daily watering and weekly fertilization.
The genomic DNA entries used for At1g74130 and At1g74140 are of the tandem genes located on chromosome 1 (Chromosome 1 NC_003070.9). The accession numbers used for the At1g74140 cDNA work were: NM_001124127.1, NM_001084350.2, NM_106074.2, NM_001036203.1, and NM_001084351.2. The accession numbers used for the At1g74130 cDNA entries were NM_106073.5 and NM_202412.1 (NCBI, RRID:SCR_006472; NCBI BLAST, RRID:SCR_004870).
Procedures and optimization details related to the analysis of transcript structure were the same as those described by Sedivy-Haley et al. (2012). Briefly, all plant tissues destined for RNA extraction were collected between 11:00 and 13:00 h during the light period to equalize the circadian effects. Total RNA was isolated and treated with DNase using Qiagen kits (RNeasy kit and RNase-free DNase set, Qiagen, Hilden, Germany) (QIAGEN, RRID:SCR_008539). Transcript structure was studied using Qiagen PCR kits (One-Step RT-PCR kit, Qiagen, Hilden, Germany) (QIAGEN, RRID:SCR_008539) and a set of exon-exon specific DNA primers. A summary of the DNA primers used is provided in the Extended data: Table S1. The RT-PCR steps and cycle timings used were as recommended by the manufacturer, Qiagen, without modifications. The RT-PCR assays were all conducted with 20 ng of total RNA with cycles between 35 and 40 to visualize lower level products. The temperature used was 55°C. Prior optimization RT-PCR assays were conducted with varying temperatures, cycles, and total RNA amounts. All assays were conducted using an Eppendorf Mastercycler for microplates. PCR products were resolved by running samples in standard 4% (w/v) Tris-borate – EDTA polyacrylamide gels. The DNA markers used were purchased from Frogabbio (Toronto, Ontario, Canada).
There are currently four genes predicted for plastidial rhomboid proteins in Arabidopsis (Kanaoka et al., 2005; Knopf & Adam, 2012; Koonin et al., 2003; Tripathi & Sowdhamini, 2006). Three are located in chromosome 1 and one in chromosome 5. Our previous work on the transcript structures of At1g25290 and At1g74130 revealed alternatively spliced variants, two for At1g25290 and three for At1g74130 (Powles et al., 2013; Sedivy-Haley et al., 2012). The other rhomboid gene in chromosome 1, At1g74140, is highly similar to At1g74130 and located downstream from At1g74130. At1g74130 is located between nucleotide positions 27873611 and 27876033, and At1g74140 occupies 27876905 to 27879780. The overall exon-intron structures of At1g74130 and At1g74140 are similar, each with 8 exons and 7 introns (Figure 1A). Although the exon lengths are similar, there appear to be substantial differences in the lengths of the middle introns 3, 4, and 5 (Figure 1A). A comparison of the translated products from the available At1g74130 and At1g74140 cDNA entries or sequences (five and three, respectively) also indicated a high degree of similarity with a few gaps (Figure 1B). The differences in intronic composition may thus be reflective of the roles of the two genes and this notion continues to be the case when examining the outcomes of the At1g74140 transcript structure analysis below.
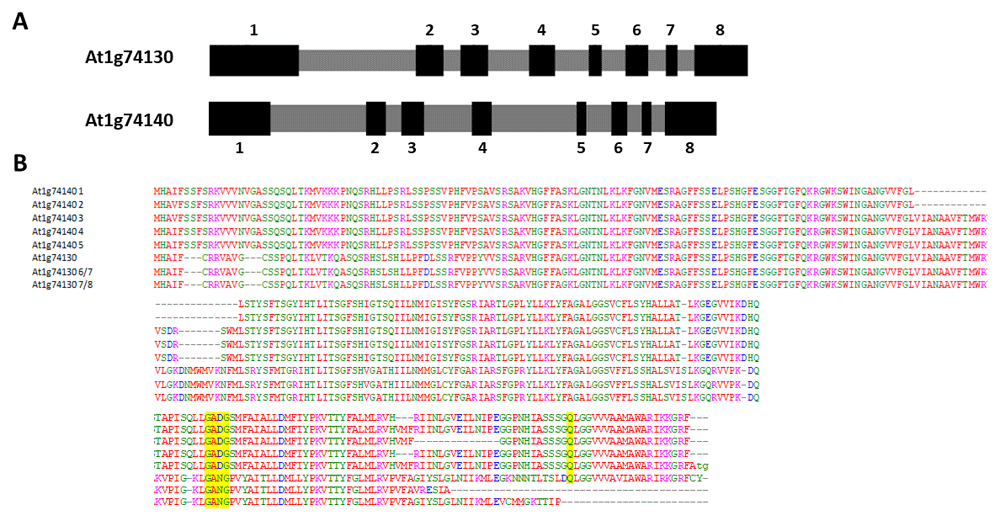
(A) A schematic comparison of the related gene structures (using information derived from the entry Chromosome 1 NC_003070.9). Exons are in depicted black and numbered sequentially. Introns are depicted in gray. (B) A comparison of the amino acid sequences derived from five At1g74140 variants and three At1g74130 variants (The accession numbers for the At1g74140 variants were: NM_001124127.1, NM_001084350.2, NM_106074.2, NM_001036203.1, and NM_001084351.2. The accession numbers for the At1g74130 variants were NM_106073.5 and NM_202412.1, and from Powles et al., 2013). Gaps are denoted by hyphens. The yellow highlighted amino acids indicate the residue locations for part of the active site.
For the analysis of At1g74140 transcripts, the overall RT-PCR strategy and primer pairs used were designed to map alternative splicing activities in the context of transcript populations (Table S1 summarizes the details of the exon-exon specific primers used). These primers should allow detection of the many differently spliced exonic structures in the transcript population, along with changes to levels of neighboring exons represented in the resulting products. Such modulations in RT-PCR product levels should be indicative of different transcript splicing activities. This approach was employed to characterize alternatively spliced variants in our previous studies on At1g25290 and At1g74130 (Powles et al., 2013; Sedivy-Haley et al., 2012).
A combined RT-PCR strategy, stepped and laddered primer pairs, was used to characterize the different structures that existed in the transcript population. The outcomes were sorted and summarized schematically in Figure 2–Figure 4 along with the corresponding primer strategies. The various RT-PCR results used for the construction of Figure 2–Figure 4 are presented in Figure 5–Figure 10. The presence or absence of each exon and their relative levels were surveyed and compiled. These exon specific RT-PCR outcomes are sorted and organized schematically as black lines in Figure 2 (below the gene map). The weight of the black lines, for example, thick versus thin, represents relative RT-PCR product levels. From this summation map of the stepped RT-PCR strategy, we were able to observe missing exon-exon products as well as unbalances in the relative levels of neighboring exon-exon products. Products primed from the start region of exon 1 and forward region of exon 8 were not detected. Products primed from the latter end of exon 1 to exon 7 were present, but exhibited changes to their relative levels, even if the neighboring RT-PCR products were expected to be comparable with respect to size and RT-PCR assay parameters.
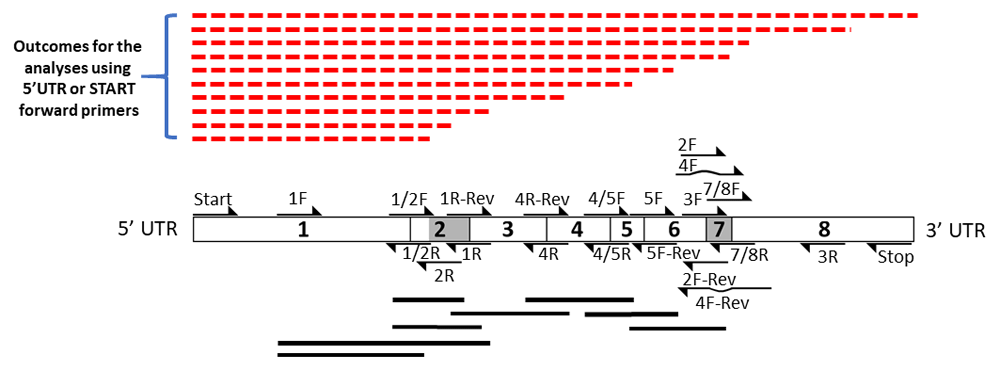
The results summarized in this figure are presented in Figure 5 through Figure 10 and Figures S1 to S3. Primer pairs focused on exon-exon borders are summarized as black solid lines. Primer pairs focused on 5’UTR and START are summarized separately as red lines. The weight of the lines reflects relative levels of resulting RT-PCR products. A hatched red line represents the absence of a predicted RT-PCR product. The At1g74140 gene structure and map of priming sites are provided schematically.
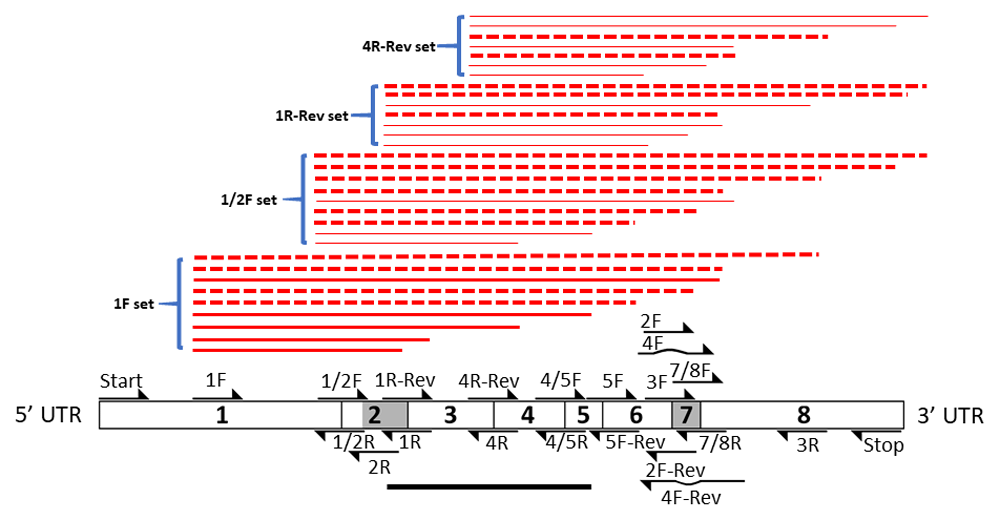
The results summarized are presented in Figure 5 through Figure 10 and Figures S1 to S3. The primer pair focused on exons 3 to 5 is represented as a black solid line. Primer pairs focused on the exon 2 region are summarized separately as red lines. The weight of the lines reflects relative levels of resulting RT-PCR products. A hatched red line represents the absence of a predicted RT-PCR product.
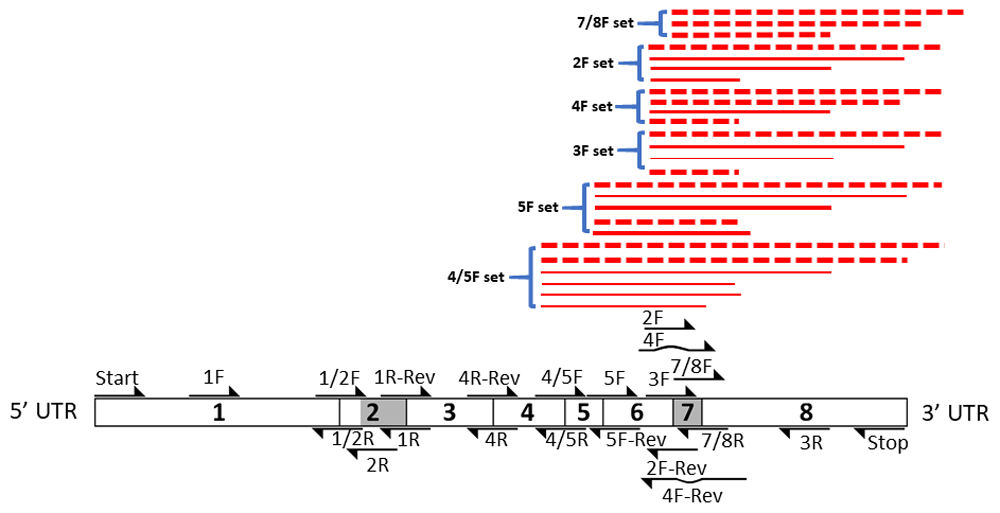
The results summarized are presented in Figure 5 through Figure 10 and Figures S1 to S3. Primer pairs focused on the exon 7 region are summarized as red lines. The weight of the lines reflects relative levels of resulting RT-PCR products. A hatched red line represents the absence of a predicted RT-PCR product.
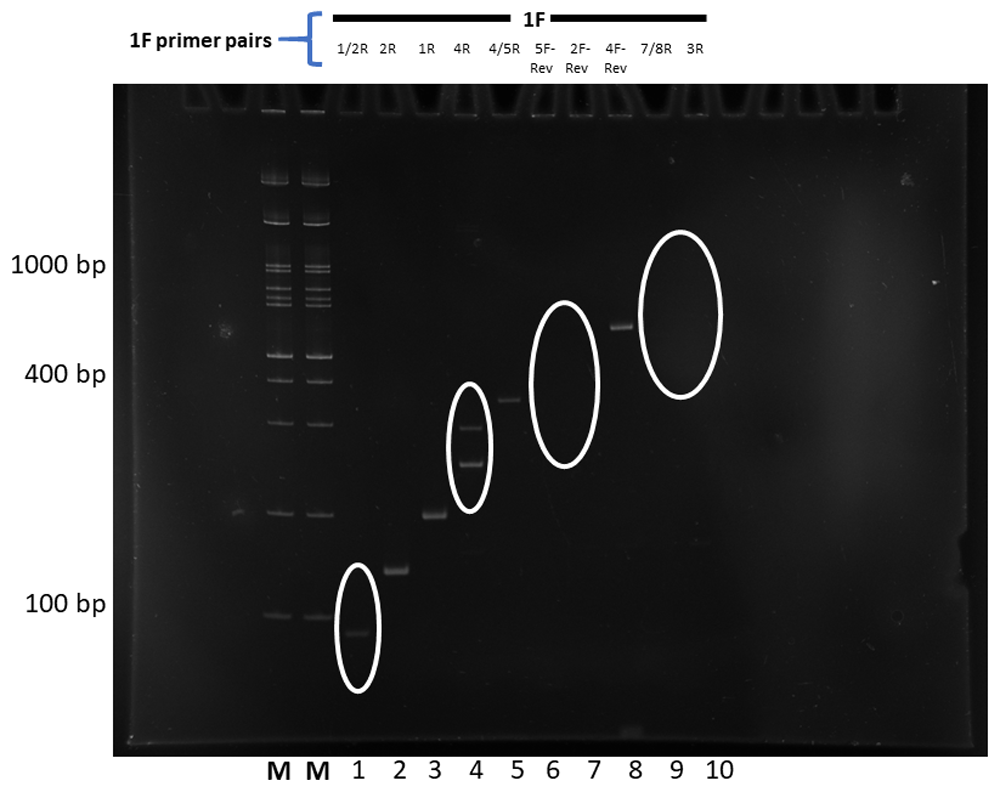
The forward 1F primer used is depicted above the reverse primers. Changes to splicing predictions are outlined elliptically. The relative size markers used are labelled M for the Froggabio 100 base pair ladder.
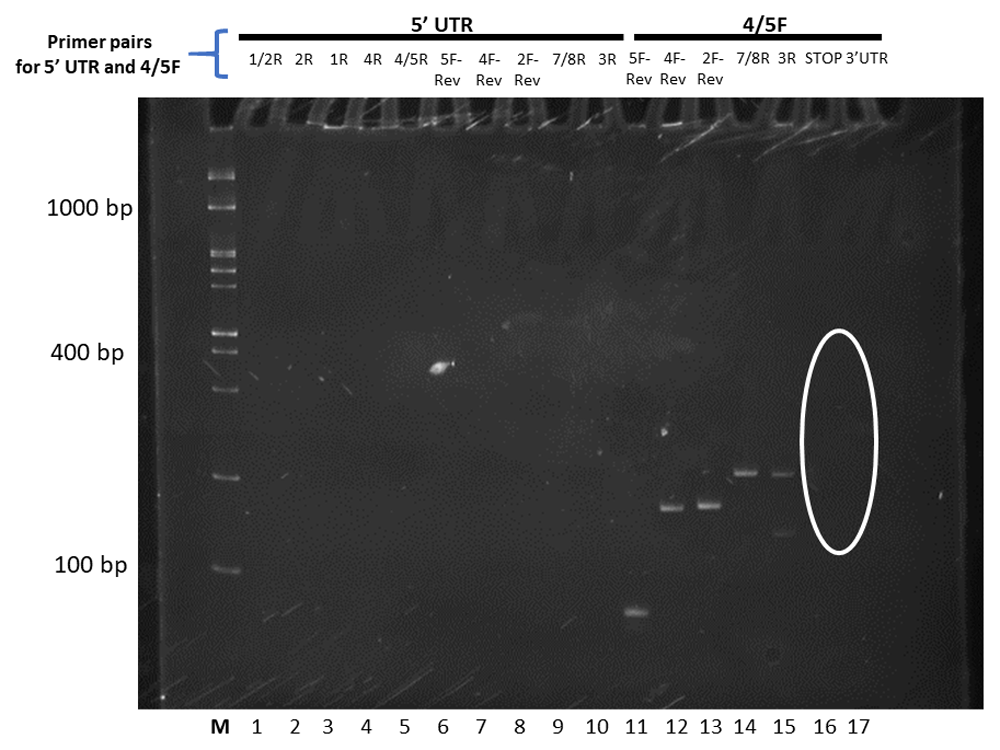
The forward primer used is depicted above the reverse primers. Changes to splicing predictions are outlined elliptically. The relative size markers used are labelled M for the Froggabio 100 base pair ladder.
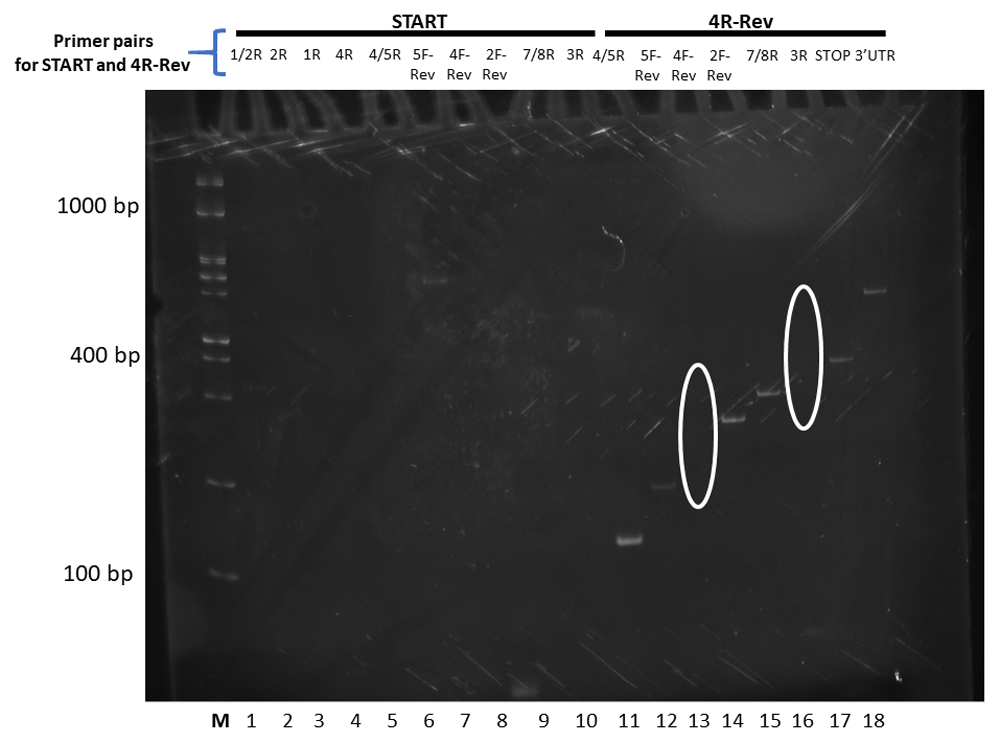
The forward primer used is depicted above the reverse primers. Changes to splicing predictions are outlined elliptically. The relative size markers used are labelled M for the Froggabio 100 base pair ladder.
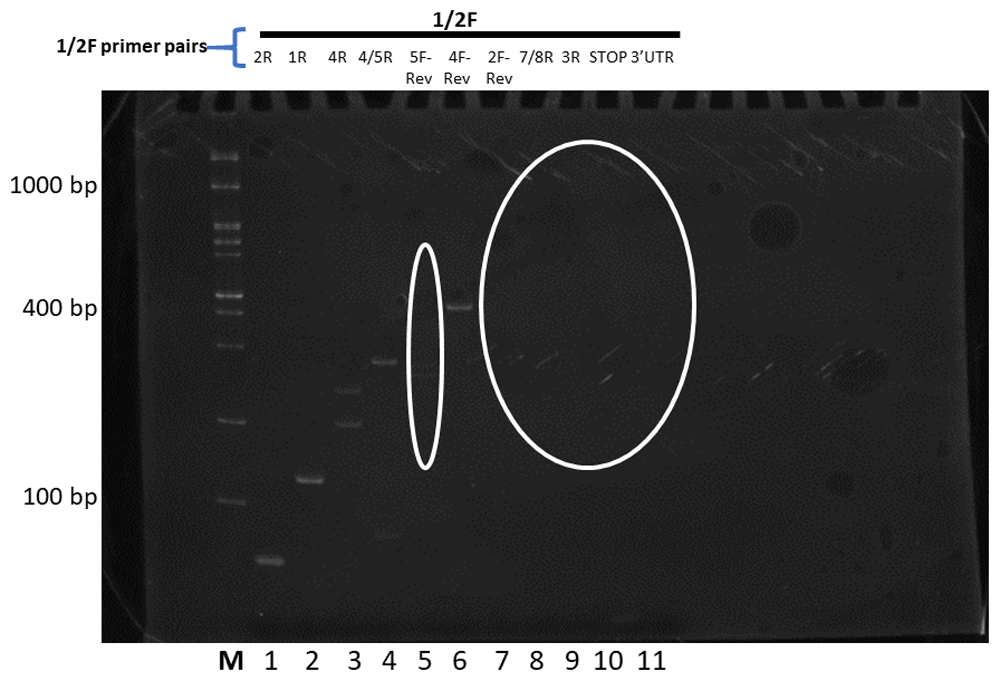
The forward primer used is depicted above the reverse primers. Changes to splicing predictions are outlined elliptically. The relative size markers used are labelled M for the Froggabio 100 base pair ladder.
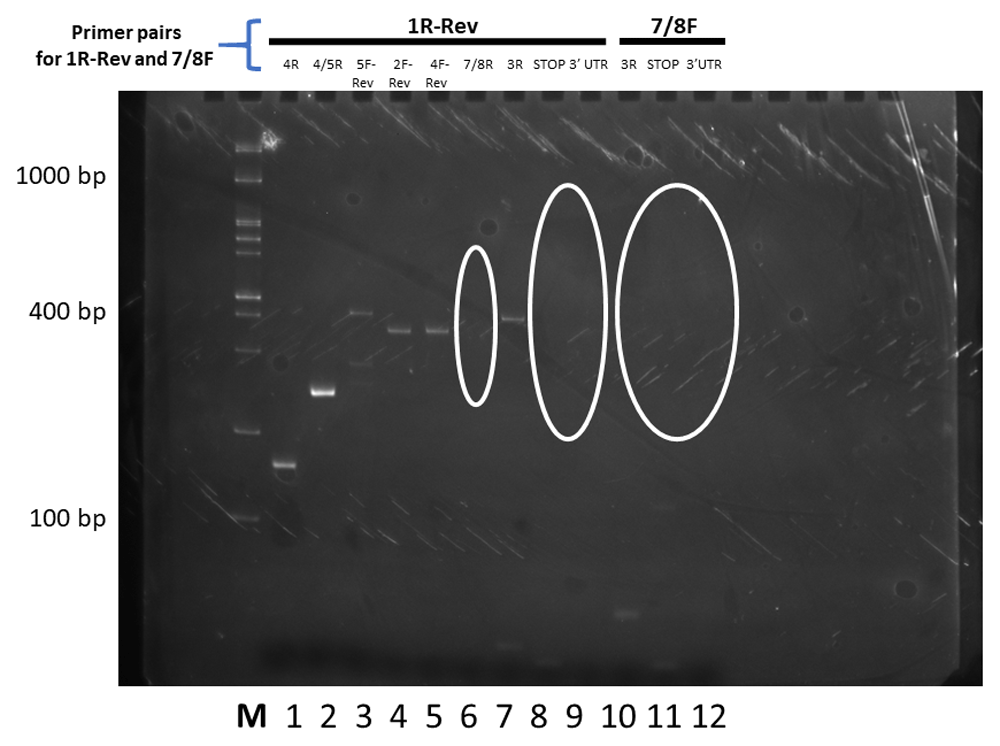
The forward primer used is depicted above the reverse primers. Changes to splicing predictions are outlined elliptically. The relative size markers used are labelled M for the Froggabio 100 base pair ladder.
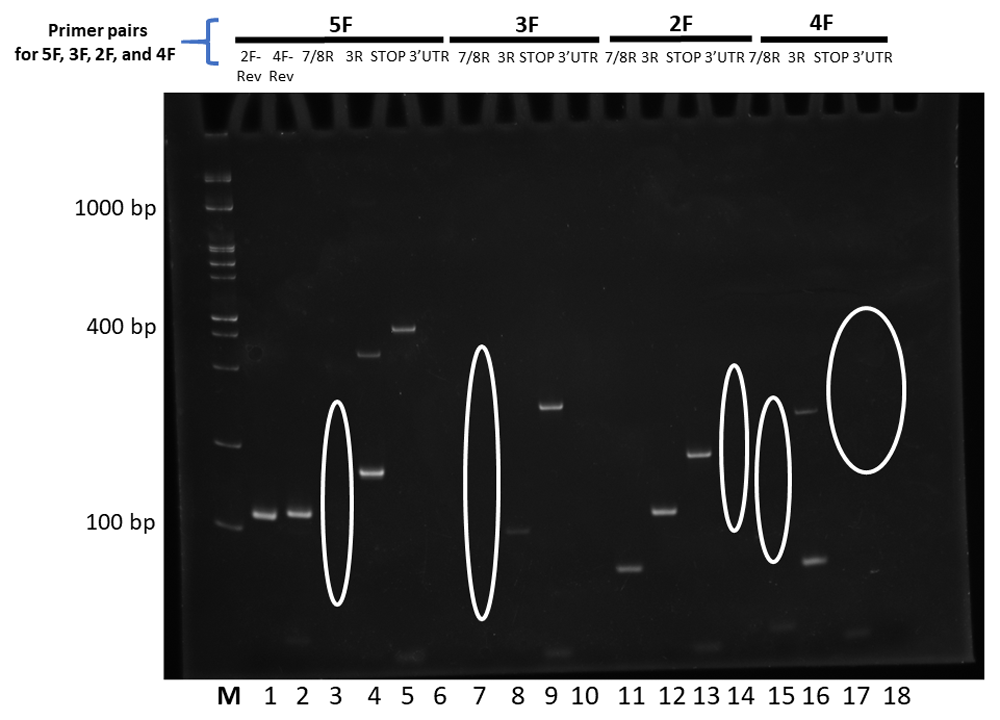
The forward primer used is depicted above the reverse primers. Changes to splicing predictions are outlined elliptically. The relative size markers used are labelled M for the Froggabio 100 base pair ladder.
The outcomes were next sorted and organized as sequential sets of laddered primers in the 5’ to 3’ direction. Different splicing activities were detected by the appearance or disappearance of different-sized RT-PCR splice products, and by changes in the levels of RT-PCR products derived from neighboring exons (the red lines in Figure 2–Figure 4). The overall patterns generated indicate that At1g74140 transcripts were not processed as predicted. Primers derived from the 5’UTR, or the start of exon 1, or the end of exon 8, or 3’UTR, did not consistently result in RT-PCR products that spanned the entire open reading frame. Products that did arise with the exon 8 or 3’UTR primers were lower than the levels observed for many of the products generated by the other primer pairs. This pattern is different from the closely related At1g74130 (Powles et al., 2013; Sedivy-Haley et al., 2012). The overall pattern displayed for At1g74140 indicates a high level of alternative splicing activity with extensive discontinuity in the resulting products.
The high level of discontinuity appears to originate mainly from two regions, from sequences spanning exon 2 and exon 7 (Figure 3 and Figure 4). Both regions appear to separately and in combination contribute to the observed discontinuity phenomenon. Signs indicating splicing discontinuity manifest as disappearances of predicted RT-PCR products and lower levels of predicted products as a result of re-distribution into differently spliced transcript sub-populations. These occurrences are represented as red lines in Figure 3 and Figure 4 (hatched for missing, solid for present, and thickness for lower relative levels). The patterns, when considered together, suggest that the sequence spanning the 5’end of exon 1 to approximately exon 6 is frequently separated from the latter section spanning approximately from exon 6 to exon 8. The resulting products from the two regions appear to be distributed into different transcript sub-populations.
The Arabidopsis rhomboid system consists of at least 13 expressed full-length genes for active and inactive types that work in different cellular locations (Knopf & Adam, 2012; Koonin et al., 2003; Lemberg & Freeman, 2007; Tripathi & Sowdhamini, 2006). Of these 13 genes, two are for active plastidial types (At1g25290 and At5g25752) and two are for inactive plastidial types (At1g74130 and At1g74140) (Knopf et al., 2012; Sedivy-Haley et al., 2011; Sedivy-Haley et al., 2012; Thompson et al., 2012). The number of plastid rhomboid variants are further increased by alternative splicing, such as that reported for At1g25290 (Sedivy-Haley et al., 2012) and At1g74130 (Powles et al., 2013). It is thus important to characterize the status of all rhomboid forms before studying the plastid rhomboid system. This particular study focuses on a close relative of At1g74130, At1g74140.
The various RT-PCR outcomes obtained in this study, together, uncovered a complex, atypical alternative splicing pattern for At1g74140. In contrast to the alternative splicing patterns of At1g25290 and At1g74130 where each generated defined variants, the splicing activities of At1g74140 produced an array of shorter, spliced transcripts derived from different exonic stretches of the gene sequence. Unlike its close relative At1g74130, spliced At1g74140 transcripts that span the entire gene sequence were not produced at our level of detection and are thus not represented as a significant pool in the transcript population. This outcome suggests that the function of At1g74140 was likely not based on the full length of the gene as for At1g74130, but on many shorter stretches. It is not known at this juncture if the different shorter, spliced transcripts are functional at the translational level. The shorter, spliced transcripts themselves are more likely to represent functional entities, such as microRNAs or RNA interference.
The complex splicing pattern of At1g74140 appears to be triggered predominantly by two regions, the stretch spanning exon 2 and the stretch spanning exon 7. Many of the spliced products predicted to span exon 2 and/or 7 were absent or produced in lower than expected relative levels. The lowering of relative levels is also due to the splitting of the one predicted pool into several pools with different spliced transcript variants. A preliminary analysis of sequences and RT-PCR products from the two regions revealed microRNA possibilities, but this is being further investigated in depth at this point.
Despite our limited understanding of the roles played by splice variants, we have witnessed the employment of alternative splicing as a mechanism for diversifying plastid rhomboid protein function in Arabidopsis. Alternative splicing is used to create protein variants with changes to functionality for At1g25290 and At1g74130. Here in this report, the data provide evidence that another Arabidopsis plastid rhomboid gene, At1g74140, carries the potential to function through its alternatively spliced short transcript products. This function could be in the form of shorter translational products and/or short RNAs. This potential is quite different from its close relative At1g74130. Preliminary studies with different developmental tissues indicate that some of the alternatively spliced short transcript products fluctuate between mature and young tissues, hence the short transcripts appear to bear functional significance (see Underlying data: Figures S1-S3). For now, the role(s) played by the short transcripts of At1g74140, although intriguing they may be, awaits elucidation.
Zenodo: Splicing patterns of the Arabidopsis organellar rhomboid At1g74140 change during development from young to mature leaf tissues, https://doi.org/10.5281/zenodo.3533891 (Ko et al., 2019a).
This project contains the following underlying data:
Figure S1. RT-PCR results for various primer combination set 1 and the two developmental stages analyzed.
Figure S2. RT-PCR results for various primer combination set 2 and the two developmental stages analyzed.
Figure S3. RT-PCR results for various primer combination set 3 and the two developmental stages analyzed.
Zenodo: Splicing patterns of the Arabidopsis organellar rhomboid At1g74140 - Table S1 for primers used in the RT-PCR assays, https://doi.org/10.5281/zenodo.3534013 (Ko et al., 2019b).
Data are available under the terms of the Creative Commons Attribution 4.0 International license (CC-BY 4.0).
| Views | Downloads | |
|---|---|---|
| F1000Research | - | - |
|
PubMed Central
Data from PMC are received and updated monthly.
|
- | - |
Is the work clearly and accurately presented and does it cite the current literature?
Partly
Is the study design appropriate and is the work technically sound?
Partly
Are sufficient details of methods and analysis provided to allow replication by others?
Partly
If applicable, is the statistical analysis and its interpretation appropriate?
Not applicable
Are all the source data underlying the results available to ensure full reproducibility?
Yes
Are the conclusions drawn adequately supported by the results?
No
Competing Interests: No competing interests were disclosed.
Reviewer Expertise: transcriptome
Is the work clearly and accurately presented and does it cite the current literature?
Partly
Is the study design appropriate and is the work technically sound?
No
Are sufficient details of methods and analysis provided to allow replication by others?
Partly
If applicable, is the statistical analysis and its interpretation appropriate?
Not applicable
Are all the source data underlying the results available to ensure full reproducibility?
Partly
Are the conclusions drawn adequately supported by the results?
No
Competing Interests: No competing interests were disclosed.
Reviewer Expertise: Gene expression, alternative splicing regulation in plants.
Alongside their report, reviewers assign a status to the article:
| Invited Reviewers | ||
|---|---|---|
| 1 | 2 | |
|
Version 1 18 Nov 19 |
read | read |
Provide sufficient details of any financial or non-financial competing interests to enable users to assess whether your comments might lead a reasonable person to question your impartiality. Consider the following examples, but note that this is not an exhaustive list:
Sign up for content alerts and receive a weekly or monthly email with all newly published articles
Already registered? Sign in
The email address should be the one you originally registered with F1000.
You registered with F1000 via Google, so we cannot reset your password.
To sign in, please click here.
If you still need help with your Google account password, please click here.
You registered with F1000 via Facebook, so we cannot reset your password.
To sign in, please click here.
If you still need help with your Facebook account password, please click here.
If your email address is registered with us, we will email you instructions to reset your password.
If you think you should have received this email but it has not arrived, please check your spam filters and/or contact for further assistance.
Comments on this article Comments (0)