Keywords
influenza, cilia, airway epithelial cells
This article is included in the University College London collection.
influenza, cilia, airway epithelial cells
Influenza viruses cause annual epidemics that are associated with considerable morbidity and mortality1,2. The infectivity of influenza virus depends on the proteolytic cleavage of the haemagglutinin (HA) protein by host serine proteases3. The proteases are thought to be secreted by differentiated airway epithelial cells that are considered to be the main target for human influenza virus4–6. However, the cytopathogenesis of influenza virus, particularly in the earliest stages of infection, remains largely unknown.
We have previously used human ciliated epithelial cells in culture to evaluate the effects of bacteria and viruses7–11, observing ciliary function in real time using high-speed video photography. Work using ciliated epithelial models to investigate other viruses has provided significant insight into the pathophysiology of infection4–6,12–14. For example, respiratory syncytial virus (RSV) has been shown to be trophic for human ciliated cells10,14, inducing ciliary dyskinesia10, enhancing bacterial attachment10,15, and producing an inflammatory response early in the infectious process11.
The primary aim of this study was to evaluate the effect of influenza virus infection, either by aerosol or by liquid immersion, on ciliary function and inflammation of differentiated primary human nasal epithelial cells.
Human nasal epithelial cells were obtained from healthy control subjects (n=9). Subjects had not experienced a symptomatic upper respiratory tract infection in the preceding 6 weeks. Primary ciliated epithelium was obtained by brushing the inferior nasal turbinate and cultured to air-liquid interface as previously described10.
Type-2 alveolar basal epithelial cells (A549) cells (American Type Culture Collection (ATCC), Manassas, VA) were grown in RPMI medium (Gibco) with 10% heat-inactivated foetal calf serum (Sigma), 100 U/ml penicillin, 10 μg/ml streptomycin (pen/strep) and fungizone. Madin-Darby canine kidney (MDCK) (ATCC, Manassas, VA) cells were grown to in Dulbecco's modified eagle medium (DMEM) with 10% foetal calf serum, and pen/strep as above.
Human influenza virus A/Puerto Rico/8/34 (H1N1) (PR8) was grown in fertilized chicken eggs. Eggs were infected at day 9, incubated at 37°C for 2 days and virus harvested in the allantoic fluid at day 11. Allantoic fluid was harvested from uninfected chicken eggs for use as a negative control. Virus stocks were titred by plaque assay using MDCK cells grown to 90% confluence in 96-well dishes. Cells were washed with PBS and infected with serial dilutions of the virus in DMEM for 1 h at 37°C. The inoculum was removed and cells were incubated with 200 μl DMEM (medium containing 1.4% BSA, 2 μg/ml of trypsin and 1x penicillin/streptomycin antibiotics (VX15140122, Fisher)) at 37°C, 5% CO2 for 2-3 days. Virus plaques were visualized by staining with 1:200 mouse H36-4.5-2 anti-HA antibodies (in-house monoclonal provided by A. Easton) and an Alexa-594 labelled secondary anti-mouse antibody diluted 1:250 (A-11062, Invitrogen, UK).
Influenza aerosols were generated from a 1 ml suspension containing 1010 plaque-forming units (PFU)/ml using a Pari-Therm nebuliser (PARI Respiratory Equipment Inc, Midlothian, VA, USA). This was connected to a viable impactor (6-stage Microbial sampler, Westech Scientific Instruments, Upper Stondon, Bedfordshire, UK) to collect and fractionate the aerosolised influenza virus particles by aerodynamic size (Figure 2A) as described previously16. Particles were impacted into separate Petri dishes containing 20 ml of medium (RPMI Media 1640, Life Technologies, Grand Island, NY, USA) with added penicillin (50 μg/ml), streptomycin (50 μg/ml) and Fungizone (1 μg/ml).
Quantification of viable influenza virus in the fractionated aerosolized particles was performed using MDCK cells seeded into 96 well plates. Triplicate wells were exposed to 200 μl of a log dilution series of the impacted air sample at 37°C in 5% CO2 for 2 hours. The sample was removed using two washes with DMEM and incubated at 37°C for 48 hours. Influenza virus was detected as above by direct immune-fluorescent staining. The number of immune-fluorescent plaques per well were counted and the total PFU in each sample calculated.
This was performed using the traditional method of liquid immersion cells with fluid containing virus or using our bespoke aerosolisation system (Figure 1). Frozen aliquots of influenza virus were thawed immediately prior to use and diluted in BEBM basal medium (Lonza, CC3171) to 1x10⁵ PFU/ml. Prior to infection, the basolateral culture medium was removed and the apical surfaces of ALI cultures were rinsed with medium. Next, 200 µl of viral suspension (multiplicity of infection (MOI) of ~0.1 (based on an estimate of 5x10⁵cells/ALI well)) in BEBM was directly applied to the apical surface for 1 hour and then removed. We also delivered the virus using a bespoke nebulisation system (Figure 1A), which allows aerosols to be delivered to the surface of ciliated cells in culture under direct vision using an inverted microscope (Figure 1B). We generated influenza aerosols from suspensions containing doses of 105, 106 or 107 PFU/ml using the Pari-Therm nebuliser. The nebulised virus was then delivered directly to the Transwell inserts via a static-free stainless-steel pipe to negate the effect of static charge on the aerosolised particles generated. Delivery to the cells in culture was via a stainless-steel t-piece at the end of the steel pipe. Both ends were clear to both reduce any pressure effects on the ciliated cultures and to allow real-time observation by high-speed video photography. The entire system was encased in a heated (37°C) Perspex chamber, to mimic body temperature and to prevent the spread of the biological agents. The Pari-Therm was chosen as it warms the aerosols to approximately 32°C thus reducing the possible negative cellular effects of cold aerosol landing on the cells. Cultures were exposed to influenza aerosols for 1 minute. The nebuliser was then switched off and the cultures left for 1 hour. All cultures were maintained at 37°C. Control wells received nebulised allantoic fluid without virus in BEBM. Cells were then washed three times with BEBM to remove unbound virus and the infections were allowed to continue for up to 24 hours. At this time the apical surface of the cells was rinsed and the wash was stored at -80°C for plaque assay and cytokine analyses. Cells were fixed overnight at 4°C with 4% paraformaldehyde in phosphate buffered saline (PBS) for immunostaining.
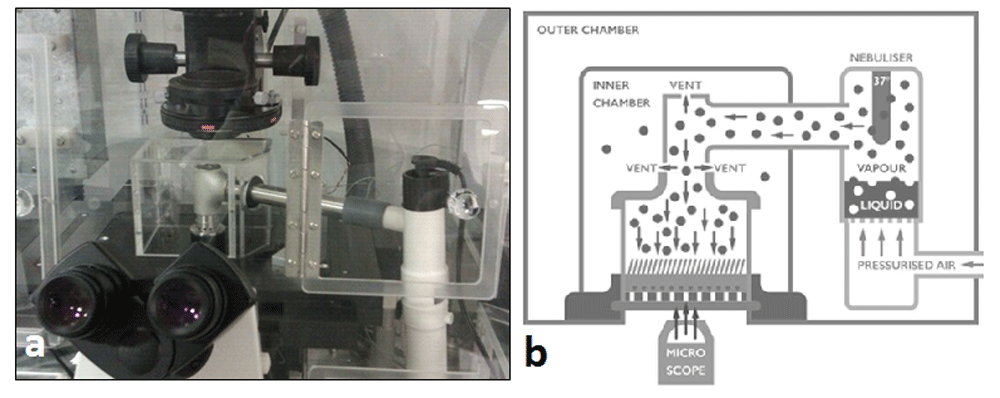
(A) Photograph and (B) diagram of the cell culture aerosolisation system. Aerosol generated in the Pari-Therm by compressed gas is heated by an internal heater to 32°C and transported via aluminium tubing, to reduce static attraction of particles, to cell cultures grown at an air-liquid interface. Vents at the top and base of the ‘t-piece’ were incorporated to reduce the pressure effect of the compressed gas used to power the nebuliser on the cells in culture. The open top vent allowed continual observation, with high-speed video imaging, during nebulisation. The cells were contained in an inner chamber heated to 37°C to prevent leakage of biological aerosols in to the atmosphere. The nebuliser and inner chamber were surrounded by an outer Perspex chamber, heated to 37°C to help stabilise experimental temperature and to prevent cooling of the aerosolised aerosol as it passed from the nebuliser to the cells in culture.

(A) A549 cells infected with aerosolised influenza virus. Cells were stained with an antibody specific for influenza virus HA antigens (red). Nuclei were stained using Hoescht (blue). No influenza virus was found after 24 hours in the control wells. (B) Quantification of the amount (PFU/ml) of viable influenza particles collected by the different stages of the six-stage viable impactor (Westech) used in this study. The impactor consists of six stages allowing fractionation of the particles into the following aerodynamic size ranges: 7 µm and above (Stage 1); 4.7-7 µm (Stage 2); 3.3-4.7 µm (Stage 3); 2.1-3.3 µm (Stage 4); 1.1-2.1 µm (Stage 5); 0.65-1.1 µm (Stage 6). The nebuliser was loaded with a dose of 2 ml of 2×10⁴ HAU/ml ~ 1010 influenza A/PR/8 virus particles and run for 10 minutes. Viable virus was quantified by plaque assay using MDCK cells. All data the mean average of n=3 impactor runs. (C) Efficiency of liquid immersion system (LIS) verses aerosol (ALI) flu delivery on to Transwell inserts containing MDCK cultures grown at an air-liquid interface. Cells were stained with an antibody specific for influenza virus HA antigens (red) and the whole well was imaged for infected cells, a reduction in fluorescence indicates a reduction in the number of infected cells. These images indicate a 10-fold loss in viral progeny when virus was aerosolised compared to liquid immersion infections (n=3). Arrows indicate infected cells. (D) The viral titre (PFU/ml) of apical supernatants collected from MDCK cells infected with aerosolised or liquid immersion preparations of influenza A/PR/8 virus for 24 hours (n=3). Clear squares represent the aerosol method, filled squares represent the liquid immersion method. Values represent the mean (± SD).
Cultures were placed in an incubation chamber at 37°C for 30 minutes and were observed via an inverted microscope system (Nikon TU1000, UK). Beating cilia were recorded using a digital high-speed video camera (Lake Image Systems, USA) at a rate of 250 frames per second using an x40 objective as previously described17. Ciliary dyskinesia was defined as ciliated cells that displayed uncoordinated motile cilia or those that beat with a stiff, flickering or twitching motion. The dyskinesia index was calculated as the percentage of dyskinetic ciliated cells relative to the total number of motile ciliated cells.
Chemokines and cytokines were measured using a 96-well multispot assay (Meso Scale Discovery, Maryland, USA) as described previously10. The lower limit of detection was 1 pg/ml.
Cells were fixed with 4% (w/v) paraformaldehyde in phosphate-buffered saline (PBS) overnight at 4°C. Following fixation, cells were washed three times with PBS, blocked with 3% (w/v) BSA in PBS for 10 minutes, and washed again three times with PBS. All subsequent antibody incubations were carried out in PBS containing 1% (w/v) BSA. Reagents used for immunofluorescence in this study were anti-influenza virus HA mouse monoclonal antibody H36-4.5-2 (40 µg/ml) as above and 1:50 anti-β-tubulin III rabbit monoclonal antibody (ab52623, Abcam). Subsequent incubations were performed as described previously10. High resolution optical sections were obtained using a Leica TCS SP5 confocal microscope using a 63x oil objective (numerical aperture, 1.4). Images acquired by confocal microscopy were rendered by Imaris Software v7.2 (Bitplane AG).
Images obtained using a 20x objective were used to quantify the level of anti-β-tubulin III staining by mean fluorescence intensity using NIS Elements Software (Nikon Instruments, Kingston, UK).
Statistical analysis was performed using GraphPad Prism 5 (GraphPad, San Diego, CA, USA). Any difference in the ciliary activity observed for control and influenza virus was determined using paired t-tests. Within-group comparisons of the magnitude of chemokine/cytokine release were conducted using a Wilcoxon signed ranks test. Between-groups comparisons were performed using the Mann–Whitney U-test.
Ethical approval was obtained from the University of Leicester Committee for Research Ethics (Leicester, UK). All adult subjects provided informed written consent.
Work with embryonated hen’s eggs was approved by the University of Warwick Animal Welfare and Ethical Review Body carried out under a licence approved by the UK Home Office as required by the Animal Scientific Procedures Act (1986).
The Pari-therm nebuliser generated infectious influenza virus aerosol particles that ranged from 0.65 to >7 µm in size (Figure 2B). A substantial proportion (84%) of infectious influenza virus was contained in particles less than 4.7 µm, a particle size where inhalation into the lower respiratory tract is likely. The total number of infectious influenza virus particles produced by the nebuliser was 2x10⁹ PFU indicating an approximate 5-fold loss in viral viability or infectivity from the inoculum (1010 PFU). Raw PFU data are available on Figshare18
We found that nebulising 1×10⁸ PFU for 1 minute resulted in 105 PFU landing on the membrane growth area of an empty Transwell (no cells). This aerosol inoculum (MOI of approximately 0.2) was shown to result in approximately 20% of infected epithelial cells being virus-positive after 24 h. In separate wells, cells were infected via liquid immersion using a viral inoculum of MOI of 0.2. This was to confirm that any effects were due to the amount of virus landing on the cells, rather than any difference in the ability of the virus to infect (Figure 2C). This data showed that the nebuliser was required to contain a virus preparation that was ten-fold higher than that delivered in the immersion system. This was reflected in the amount of virus released by these infected cells into the apical fluid after 24 h infection (Figure 2D).
Effect of influenza virus infection on ciliary function. We found that influenza virus infection significantly reduced the proportion of epithelial cells with motile cilia (Table 1). Using the standard liquid immersion method, the number (median (IQR)) of ciliated epithelial cells per field significantly reduced (P<0.05) as early as 18 hours post-influenza virus infection (20 (11-39) cells/4.2 mm2) compared to the uninfected controls (27 (27-37) cells/4.2 mm2). After 24 hours infection this reduced to less than half (16 (11-29) cells/4.2 mm2) that detected in the uninfected controls (33 (27-40) cells/4.2 mm2). Despite this reduction in the numbers of cells with motile cilia, the ciliary beat frequency of the motile cilia on other ciliated cells in culture was unaffected by influenza virus infection over the 24-hour study period. The median (IQR) ciliary beat frequency of motile cilia on influenza virus infected nasal ciliated cells was indistinguishable after 24 hours (14.7 (9.7-15.2) Hz) from the uninfected controls (14.0 (11.7-15.7) Hz) (P=0.87). The cilia that remained motile following influenza virus infection showed no evidence of ciliary dyskinesia. The median (IQR) dyskinesia index was the same after 24 hours (0% (0%-5%)) as the uninfected controls (0% (0%-0%)) (P=0.87). Raw data on ciliary activity are available on Figshare19.
Data expressed as median (IQR).
| Delivery method | Time p.i. (h) | Ciliary beat frequency (Hz) | Motility index* | Dyskinesia index (%)† | |||
|---|---|---|---|---|---|---|---|
| Control | Virus | Control | Virus | Control | Virus | ||
| Liquid immersion (n=45 sample area) | 0 | 15.0 (11.6-18.7) | 14.5 (12.7-18.1) | 26.7 (24.4-45.9) | 28.9 (17.8-49.5) | 0.0 (0.0-1.4) | 0.0 (0.0-7.4) |
| 4 | 14.7 (13.1-15.1) | 12.5 (12.0-13.1) | 26.7 (22.2-40.4) | 24.4 (16.5-31.3) | 0.0 (0.0-4.2) | 2.0 (0.0-5.6) | |
| 18 | 14.0 (13.1-14.0) | 12.3 (10.8-13.4) | 26.7 (26.7-36.7) | 20.0 (11.1-38.5)‡ | 0.0 (0.0-0.0) | 2.1 (0.0-4.8) | |
| 24 | 14.0 (11.7-15.7) | 14.7 (9.7-15.2) | 33.3 (26.7-40.0) | 15.6 (11.1-28.9)‡ | 0.0 (0.0-0.0) | 0.0 (0.0-5.0) | |
| Aerosol (n=35) | 0 | 15.0 (10.2-16.9) | 15.8 (15.2-16.3) | 10.6 (6.8-18.4) | 14.0 (5.2-22.8) | nd | nd |
| 24 | 15.5 (13.1-17.3) | 16.6 (15.4 -17.6) | 6.9 (2.2-10.5)‡ | 7.8 (4.0-10.4)‡ | 3.5 (2.8-4.5) | 3.5 (0.8-4.8) | |
*Motility index, number of motile ciliated cells per sample area of ~4200 µm2 (n=2-9 donors). †Dyskinesia index, percentage of dyskinetically beating cilia amongst all cilia examined n=3 donors. ‡ Significant difference from time point 0 (P<0.05) using a Wilcoxon signed ranks test. nd, not done; p.i., post-infection.
Infection of ciliated epithelial cells by aerosolised influenza virus results in similar cytopathology as standard method. Human ciliated airway epithelial cells infected with aerosolised influenza A virus resulted in similar levels of cytopathology (cells rounding, lifting off and tight junctions detected) as those immersed in the same concentration of influenza virus. The number (median (IQR)) of motile ciliated epithelial cells per field reduced two-fold to 7.8 (4.0-10.4) cells/4.2 mm2) compared to the pre-infection level (14.0 (5.2-22.8) cells/4.2 mm2). The ciliary beat frequency (CBF) of the remaining motile ciliated epithelial cells exposed to aerosolised inoculum of influenza A virus (16.6 (15.4-17.6) Hz) remained unchanged from pre-infection level (15.8 (15.2-16.3) Hz) and the uninfected control of 15.5 (13.1-17.3) Hz. These values do not account for cilia on cells that have become static.
The concentration of inflammatory mediators detected in the apical fluid of cell cultures subjected to the aerosol delivery of the control and influenza virus preparations resulted in significantly lower levels of inflammatory mediators after 24 hours compared to the liquid immersion system (Table 2). In addition to lower concentrations, the two systems produced a different cytokine response to influenza virus infection. Among the ten cytokines measured, influenza virus infection by liquid immersion caused a significant (P<0.05) downregulation of IL-6 secretion to a median (IQR) of 333 pg/ml (107-1304) from 548 pg/ml (418-1525) in control uninfected cells. However, the aerosol delivery of influenza virus resulted in an upregulation of IL-6 to 1297 pg/ml (1107-1371) from 968 pg/ml (700-1235) in control uninfected cells. The same trend was seen with another anti-inflammatory cytokine IL-13, which showed significant upregulation in the aerosol group from the control 50 pg/ml (48-53) to 65 pg/ml (55-65) following infection, compared to a downregulation in the liquid immersion group from 70 pg/ml (65-76) to 55 pg/ml (22-76), respectively.
| Chemokine/cytokine (pg/ml) | Liquid immersion (n=7) | Fold Change | Aerosol delivery (n=3) | Fold Change | |||
|---|---|---|---|---|---|---|---|
| Control | Influenza | Control | Influenza | ||||
| Th1 | IFN-γ | 100 (76-143) | 66 (40-122) | 0.7 | 10 (9-11) | 10 (9-11) | 1.0 |
| IL-1β | 49 (34-57) | 36 (26-44) | 0.7 | 12 (11-14) | 13 (11-14) | 1.1 | |
| IL-2 | 18 (17-27) | 19 (12-21) | 1.1 | 3 (2-4) | 3 (3-4) | 1.0 | |
| IL-12p70 | 21 (12-25) | 16 (8-32) | 0.8 | 4 (4-4) | 4 (3-5) | 1.0 | |
| TNFα | 133 (105-147) | 110 (61-152) | 0.8 | 12 (11-14) | 11 (9-16) | 0.9 | |
| Th2 | IL-4 | 9 (7-13) | 6 (5-12) | 0.7 | 3 (2-3) | 3 (2-3) | 1.0 |
| IL-5 | 36 (30-42) | 38 (22-43) | 1.1 | 0 (0-0) | 0 (0-0) | 1.0 | |
| IL-6 | 548 (418-1525) | 333 (107-1304)* | 0.6 | 968 (700-1235) | 1297 (1107-1371) | 1.3 | |
| IL-10 | 71 (37-80) | 26 (20-77) | 0.4 | 2 (2-3) | 3 (2-4) | 1.5 | |
| IL-13 | 70 (65-76) | 55 (22-76) | 0.8 | 50 (48-53) | 65 (55-65)* | 1.3 | |
| CCL11 | Eotaxin | 409 (307-477) | 435 (408-457) | 1.1 | 17 (14-20) | 20 (19-21) | 1.2 |
| CCL4 | MIP-1β | 33 (17-54) | 37 (33-52) | 1.1 | nd | nd | 1.0 |
| CCL26 | Eotaxin-3 | 6593 (3932-11580) | 5516 (4564-8620) | 0.8 | nd | nd | 1.0 |
| CCL17 | TARC | 295 (227-415) | 339 (302-368) | 1.1 | nd | nd | 1.0 |
| CCL2 | MCP-1 | 8299 (4949-15839) | 7135 (5515-14,185) | 0.9 | 309 (254-364) | 631 (539-686)* | 2.0 |
| CCL22 | MDC | 20545 (9986-23,181) | 22,812 (20,342-30,853)* | 1.1 | nd | nd | 1.0 |
| CCL13 | MCP-4 | 94 (42-134) | 274 (95-337) | 2.9 | 13 (12-14) | 18 (16-20)* | 1.4 |
| CXCL8 | IL-8 | 594 (506-989) | 887 (692-1190)* | 1.5 | 65,523 (44,759-86,287) | 109,039 (86,701-113,242) | 1.7 |
| CXCL10 | IP-10 | 698 (433-974) | 4140 (823-19,884) | 5.9 | 112 (105-120) | 781 (718-1236)* | 7.0 |
Among the nine chemokines measured, ciliated epithelial cells exposed to a liquid immersion inoculum of influenza virus resulted in a significant upregulation of CCL22 from a median (IQR) uninfected control of 2,0545 pg/ml (9986-23181) to 22812 pg/ml (20,342-30,853) (Table 2), whereas exposure to a aerosolised inoculum and control solution resulted in undetectable levels of this chemokine. MCP-1 and MCP-4 both showed a significant (P<0.05) increase following aerosolised delivery, but this was not significantly altered in the group exposed to the liquid immersion inoculum. However, both delivery systems show similar CXCL8 and CXCL10 responses to influenza virus, where production increased approximately 1.5-fold and 6.5-fold, respectively. In the liquid immersion delivery system, median (IQR) CXCL8 increased from 594 pg/ml (506-989) in the uninfected control cells to 887 pg/ml (692-1190). The aerosol delivery system resulted in much higher concentrations of CXCL8 from 65,523 pg/ml (44,759-86,287) in the uninfected control cells to 109,039 pg/ml (86,701-113,242) compared to the liquid immersion system. CXCL10 increased from 698 pg/ml (433-974) in the uninfected control cells to 4140 pg/ml (823-19884). MIP-1β, Eotaxin-3, TARC and MDC were unable to be detected in the apical fluids of cells exposed to aerosolised medium or virus, but liquid immersion the membrane with medium alone caused levels to exceed 30 pg/ml, 3500 pg/ml, 290 pg/ml and 20,000 pg/ml, respectively. Raw data from measurement of inflammatory mediators are available on Figshare20.
The distribution of influenza HA antigen on human ciliated epithelial cells. We have previously shown that RSV preferentially infects ciliated cells and this infection progresses with viral antigen being displayed on the cell surface, leading to viral antigen moving into the ciliary shaft after 24 h1,2. To determine whether influenza virus follows a similar pattern of viral antigen spread we used immunofluorescent staining to detect influenza virus haemagglutinin (HA) and ciliary (β-tubulin III) antigens on infected cells. We found a high level of influenza virus HA antigen accumulated on the distal ends of the cilia (ciliary tips) (Figure 3A, panel A) and the apical cell surface of ciliated cells (Figure 3A, panel B). We observed the co-localisation of influenza virus and anti-β-tubulin III, indicating virus HA antigen is displayed on the ciliary axoneme (Figure 3A, panel C). Notably, we found that cells either displayed viral antigens only on the ciliary tips or the full length of the ciliary axoneme. In cells where the apical membrane (cell surface) showed evidence of viral antigen, antigen was always present over the full length of the ciliary axoneme suggesting spread of antigen from the tip to the base of the cilium. Raw mean fluorescence intensity values are available on Figshare
(A) Immunolocalisation of influenza virus HA protein and cilia proteins on the surface of infected ciliated epithelial cells grown at air-liquid interface. Panel A: ciliated cell displaying viral antigen on the ciliary tips but not on the shaft of the cilia and not on the apical cell surface (virus indicated by the arrow a). Panel B: influenza virus infected ciliated epithelial cells 24 h post-infection showing viral antigen displayed on the surface of the cell (red) and the ciliary axoneme (yellow in merge). Panel C: Z-projection ofinfluenza virus infected ciliated epithelial cells 24 h post infection showing viral antigen displayed on the ciliary shaft (yellow in merge).Panel D: denuded ciliated cells displaying viral antigen on the surface of the cell and fragments of ciliary β-tubulin III staining (indicated by arrow b). Cells were co-stained with antibodies against β-tubulin III to detect the axonemal microtubules (FITC) and an antibody specific for influenza virus HA antigens (Alexa-594). Nuclei were stained using Hoescht (blue in merge). Merged images are shown where green indicates β-tubulin III protein, red indicates influenza HA and yellow indicates areas of influenza-tubulin antigen co-localisation. All images show the maximum intensity projection. Scale bars, 5 µm. (C) Quantification of tubulin staining on the surface of control (uninfected) and influenza virus infected ciliated epithelial cell cultures grown at air-liquid interface. Values represent the mean (and SD) fluorescence intensity of tubulin staining from 10 images (approx. 200 cells per image). **P<0.01 vs control.
A number of cells were seen with partial and in some cases almost complete loss of cilia (Figure 3A, panel D). In these cells fragments of β-tubulin III staining was seen the surface of the cell indicating that the cilia may have been lost from infected ciliated cells. To determine whether cilia were lost as a result of influenza infection, we compared the level of anti-β-tubulin III, a marker of cilia, (as measured by fluorescence intensity) in control and infected cultures. This showed that influenza infection resulted in significantly (P<0.01) less anti-β-tubulin III staining compared to uninfected cultures (Figure 3C).
To our knowledge, this study shows for the first time that human ciliated epithelial cells from the upper airway are a target of influenza virus infection and suggests infection is primarily seen in ciliated cells. Previous studies have indicated ciliated cell tropism by influenza virus in the lower airway of humans and ferrets4–6. Our study demonstrated that not only are nasal ciliated cells also a target, but early influenza virus infection causes a significant decrease in the number of cells with motile cilia. At 24 hours after influenza infection the number of motile cilia present in the epithelial cultures reduced to under half that seen in uninfected control cells. Such loss could be due to cilia being cleaved from the cell surface, cells being destroyed or cells undergoing apoptosis21 or the ciliated cells being shed from the surface. Confocal images suggested loss of cilia from the apical surface of ciliated cells was at least in part responsible for the reduction in cilia. Infected cells with no detectable cilia had evidence of small amounts of anti-β-tubulin III staining at their surface, suggesting cilia had been cleaved, supporting the indication of tropism of influenza for ciliated cells4–6. To further confirm the loss of ciliary axonemes following influenza infection we compared the levels of anti-β-tubulin III staining in infected and control wells. The levels were significantly reduced in infected wells, again supporting our finding that the number of cilia had decreased. These results are consistent with findings of reduced mucociliary transport in tracheal cultures and the tracheas in animals infected with influenza virus12,22,23. It is possible that in vivo, this rapid reduction in the number of motile ciliated cells may reduce mucociliary clearance early in the infective process, predisposing the respiratory tract to colonisation and infection by bacteria.
Increased ciliary dyskinesia is a common finding during infection of ciliated cells with bacteria and viruses such as RSV,6,10,24. However, influenza virus infection did not increase ciliary dyskinesia or reduce the ciliary beat frequency of the cilia that remained motile. Longer time courses are needed to determine the degree of further ciliary loss and to determine if ciliary function is affected.
We also found that influenza virus interacts with the ciliary tips and ciliary axonemes. In a number of images in our study influenza appeared to be present on the tips of cilia without the underlying cell being infected indicating that the virus may initially bind to the ciliary tip. On other cells, the ciliary tips and the top part of the ciliated shaft showed presence of antigen, with no antigen present on the rest of the ciliary membrane or cells surface, suggesting that virus may use the cilium as an entry point to the cell. Previous reports suggest that influenza virus budding occurs at the tips of the microvilli rather than the cilia themselves13. Some cells showed antigen on the ciliary membrane and on the cell surface. However, no cells showed antigen on the cell surface without antigen being present on the full length of the ciliary membrane. As discussed above, cells without cilia where antigen was present also showed staining with anti-β-tubulin III, suggesting they had previously been covered by cilia. These findings suggest a novel infective route by which influenza binds to the ciliary tips and enter the cell at that point with infection spreading down into the cell resulting in ciliary loss. The initial attachment to the ciliary tips rather than the cell surface, is consistent with the work of Button and colleagues25 who have shown that particles greater than 40 nm are unable to penetrate between cilia to reach the surface of the ciliated cells. Influenza virus particles are between 80 to 120 nm in diameter26 and would not be expected to easily penetrate this barrier. It will be important to investigate if other strains and subtypes of influenza virus show differences in their tropism for ciliated epithelial cells.
Influenza virus is thought to be spread by aerosols made when infected individuals cough, sneeze or talk27. However, all human and in vitro studies to date have delivered infectious virus to subjects in solution. We aimed to determine whether there were any differences in the response of ciliated airway epithelial cells to influenza virus delivered in suspension compared to the aerosolised form. We first validated the method so that the cells received the same dose whether delivered by aerosol or by liquid immersion. We found that the infectious nature of the virus was not altered by aerosolisation and, accounting for virus loss, we detected the same level of cytopathology and cell tropism as we reported using the liquid immersion method. However, we observed a significant difference in the type of inflammatory response. In the liquid immersion system, we found that influenza virus infection resulted in a significant downregulation of the anti-inflammatory cytokine IL-6 compared to the uninfected control cells. Notably, this was not accompanied by significant upregulation of pro-inflammatory mediators and no other cytokine tested showed any change in levels. Using the aerosol delivery method, we found that another anti-inflammatory cytokine IL-13 significantly increased. This was accompanied by an increase in IL-6, although this increase was not statistically significant, most likely due to a type two error associated with the low number of repeats. This data indicates that aerosol delivery of influenza virus may lead to an anti-inflammatory Th2 cytokine response
We also detected a huge difference between the aerosol and liquid immersion methods in regard to the baseline concentrations of all nine chemokines we tested, with some up to 20,000 times higher in one method than the other. In all but one chemokine tested (CXCL8), liquid immersion the epithelium with medium resulted in much higher concentration of chemokine production after 24 hours compared to the aerosol delivery method. MIP-1β, Eotaxin-3, TARC and MDC were not detected in the apical fluids of cells exposed to aerosolised medium or virus, but was detected when cells were infected by liquid immersion the membrane. This could indicate that liquid immersion the membrane removes or dilutes key feedback mechanisms that exist to regulate expression of these chemokines (or the carrier fluid in greater amounts is more toxic or liquid immersion means they are no longer exposed to air).
Despite these differences in the baseline levels of chemokines, the response to infection in both models followed the same trend. Both increased secretion of the interferon gamma-induced protein 10 (CXCL10) and the neutrophil recruitment chemokine CXCL8 following influenza virus infection. This is consistent with our previous findings of viral infection in this model10 and suggests that the response of the infected epithelium is to recruit neutrophils to aid the host antiviral response. Although we did not detect a significant change in CXCL8 secretion using the aerosol system, our data analysis were limited by the number of biological repeats (n=3) and the natural variation in response we have previously reported from different donors10.
In summary, we have presented evidence that the influenza virus is tropic to ciliated cells of the upper respiratory tract and interacts directly with the tips and ciliary axoneme of motile cilia. Subsequent infection of the cell results in loss of cilia. We also show that the route of infection (via large or small droplet size) can impact on the type of inflammatory response produced by the cells within the first 24 hours. Further investigations using our unique aerosol delivery system should begin to address the mechanisms behind this.
Figshare: Ciliary activity (raw data for ciliary beat frequency/motility). https://doi.org/10.6084/m9.figshare.780380619.
Figshare: Confocal dataset (raw confocal z-stack of infected epithelial cells). https://doi.org/10.6084/m9.figshare.780355728.
Figshare: MFI of B tubulin with influenza infection (mean fluorescence intensity values for β-tubulin). https://doi.org/10.6084/m9.figshare.780354829.
Figshare: chemokine/cytokine/NO multispot assay (raw data for chemokine/cytokine/NO assay). https://doi.org/10.6084/m9.figshare.780354520.
Figshare: Viable Impactor results (raw pfu/ml of nebulised influenza A virus). https://doi.org/10.6084/m9.figshare.780353918.
Data are available under the terms of the Creative Commons Attribution 4.0 International license (CC-BY 4.0).
| Views | Downloads | |
|---|---|---|
| F1000Research | - | - |
|
PubMed Central
Data from PMC are received and updated monthly.
|
- | - |
Provide sufficient details of any financial or non-financial competing interests to enable users to assess whether your comments might lead a reasonable person to question your impartiality. Consider the following examples, but note that this is not an exhaustive list:
Sign up for content alerts and receive a weekly or monthly email with all newly published articles
Already registered? Sign in
The email address should be the one you originally registered with F1000.
You registered with F1000 via Google, so we cannot reset your password.
To sign in, please click here.
If you still need help with your Google account password, please click here.
You registered with F1000 via Facebook, so we cannot reset your password.
To sign in, please click here.
If you still need help with your Facebook account password, please click here.
If your email address is registered with us, we will email you instructions to reset your password.
If you think you should have received this email but it has not arrived, please check your spam filters and/or contact for further assistance.
Comments on this article Comments (0)