Keywords
ChIP-seq, functional annotation, epigenetics
This article is included in the Bioconductor gateway.
ChIP-seq, functional annotation, epigenetics
The field of epigenetic research studies the process by which heritable changes in gene expression occur without underlying alterations in the DNA sequence. Epigenetics plays a key role in human biology, and dysregulation in epigenetic processes is associated with the pathogenesis of cancer and many other diseases. Epigenetic mechanisms have been demonstrated to be necessary for biological programs that are important for a variety of health and disease outcomes. Understanding the impact of epigenetic architecture on the accessibility of gene promoters and its effect on gene expression patterns is therefore critical for linking chromatin biology to clinical indications. One way to measure such events involves investigating histone modifications, namely post-translational modifications to histones (referred to as chromatin marks) that regulate gene expression by organizing the genome into active regions of euchromatin, where DNA is accessible for transcription, or inactive heterochromatin regions, where DNA is more compact and less accessible for transcription1.
Chromatin marks come in a variety of different shapes and sizes, ranging from the extremely broad to the extremely narrow2–6. This spectrum depends on a number of biological factors ranging from qualitative characteristics such as tissue-type7 to temporal aspects such as developmental stage8. Depending on the peak caller used, computational factors such as the variance observed in peak coordinate positions (peak start, peak end) – both in terms of length distribution of peaks as well as the total number of peaks called – is an issue that persists even when samples are run at identical default parameter values9,10. This variance becomes a factor when annotating peak lists genome-wide with their nearest genes as peaks can be shifted in genomic position (towards 5’ or 3’ end) or be of different lengths, depending on the peak caller employed. In total, the combined effect of these factors exerts a unique influence over the functional annotation and understanding of genomic variability, which ultimately complicates the study of epigenetic regulation of biological function.
Prior software in the chromatin immunoprecipitation-sequencing (ChIP-seq) functional annotation arena (e.g., ANNOVAR11, GREAT12, PAVIS13, ChIPpeakAnno14, ChIPseeker15, annotatr16, HOMER17, and BEDTools18) has focused exclusively on distance-minimizing algorithms between peaks and the transcriptional start site (TSS) regions of their nearest genes. In contrast, geneXtendeR significantly expands this definition to include n-dimensional annotation, whereby a user can investigate second-closest, third-closest, . . . , nth -closest genes to any given peak (or set of peaks), thereby focusing on and prioritizing the biology over simply the raw numbers (in base pairs). Detailed expositions of these new methods and their implications on the interpretation of results from data analyses are presented as case studies in the geneXtendeR package vignette.
geneXtendeR19 makes functional annotation of ChIP-seq data more robust and precise, regardless of peak variability attributable to parameter tuning or peak caller algorithmic differences. Since different ChIP-seq peak callers produce differentially enriched peaks with large variance in peak length distribution and total peak count, annotating peak lists with their nearest genes can often be a noisy process where an adjacent second or third-closest gene may constitute a more viable biological candidate, e.g., during cases of linked genes that are located close to each other. As such, the goal of geneXtendeR is to robustly link differentially enriched peaks with their respective genes, thereby aiding experimental follow-up and validation in designing primers for a set of prospective gene candidates during qPCR.
The key algorithm in the geneXtendeR R/Bioconductor package19 is the extension algorithm, implemented in the C programming language for performance and efficiency. The process of “extending" refers to performing sequential iterative gene-feature overlaps after adding to the gene-span a user-specified region upstream of the start of the gene model and a fixed (500 bp) region downstream of the gene, resulting in assigning to a gene the features that do not physically overlap with it but are sufficiently close. This process is repeated multiple times across a range of extension parameters set by the user and a series of visualizations are returned as output to help users hone in on the optimal functional annotation. This is in contrast to most past and present epigenetic analyses, in both ChIP-seq20 and ATAC-seq21 studies, that assign gene body definitions (e.g., assigning a default 2 kbp as the cutoff for gene-proximal peaks) ad hoc before mapping the peaks to genomic features. Figure 1 shows why such a practice may be limiting.
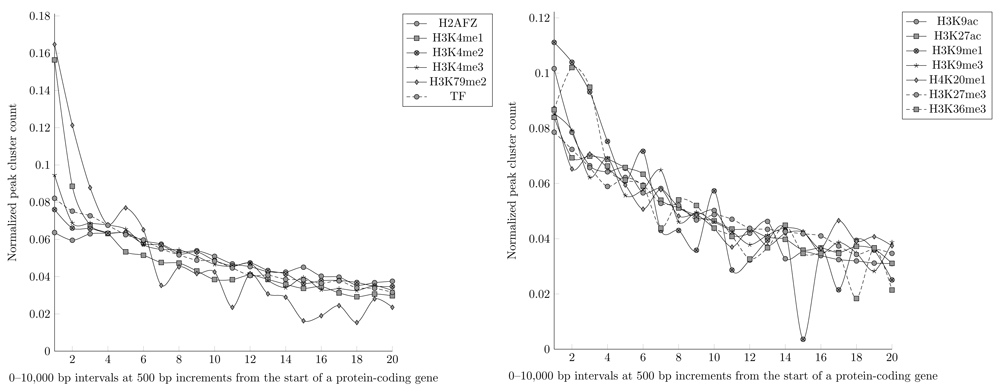
Large-scale computational geneXtendeR analysis using hg19 reference genome of 198 histone modification and 547 transcription factor ChIP-seq datasets from ENCODE. To make data directly comparable to each other, the y-axis represents a normalized count of peak clusters (number of peak clusters in a specific interval divided by the total number of peak clusters across all 0-10 kbp intervals for a given chromatin mark or TF), where a peak cluster is defined as a genomic locus harboring at least 5 overlapping peaks. The x-axis, which is segmented into 20 discrete regions (“1" = 0-500 bp interval, “2" = 500-1000 bp interval, ..., “20" = 9500-10000 bp interval), represents a genomic distance (in bp) of the closest protein-coding gene to each respective peak cluster. A steady decline in peak cluster count at further upstream intervals is detected for all (broad and narrow) chromatin marks as well as transcription factors, i.e., peak clusters do not congregate proximally within any specific region of intervals (e.g., 0-2000 bp) of their respective protein-coding genes, as there is a large number of peak clusters that reside further upstream of their nearest gene. For instance, in the 9500-10000 bp interval alone, there are 1043 peak clusters for the H2AFZ chromatin mark, 569 peak clusters for the H3K4me1 chromatin mark, and 716 peak clusters across all transcription factor ChIP-seq datasets. However, there are certainly exceptions like the H3K9me1 chromatin mark, which has only 1 peak cluster in the 7000-7500 bp interval (see the big dip at x-axis=15 in the right-hand panel) and only 7 peak clusters in the 9500-10000 bp interval (see S1_Appendix and S2_Appendix for reproducible code and data).
From a performance standpoint, the extension algorithm is optimized to handle the computational complexity inherent to performing compute-intensive n-dimensional annotation. This ultimately aids in efficiently capturing cis-regulatory and proximal-promoter element relationships between ChIP-seq peaks and the genes they are (dys-)regulating, as described in further detail in the vignette. All of geneXtendeR’s source code is implemented in the C and R programming languages and shipped within a standalone R/Bioconductor package release that is publicly available for download from either Bioconductor or GitHub. Within its codebase, geneXtendeR leverages the AnnotationDbi22, BiocStyle23, data.table24, dplyr25, GO.db26, networkD327, RColorBrewer28, rtracklayer29, SnowballC30, testthat31, tm32, and wordcloud33 libraries.
Figure 2 summarizes the key steps of a sample workflow. For an end-to-end example of a comprehensive biological workflow and case-study, please refer to the vignette. An earlier version of this article can be found on bioRxiv (doi: https://doi.org/10.1101/082347).
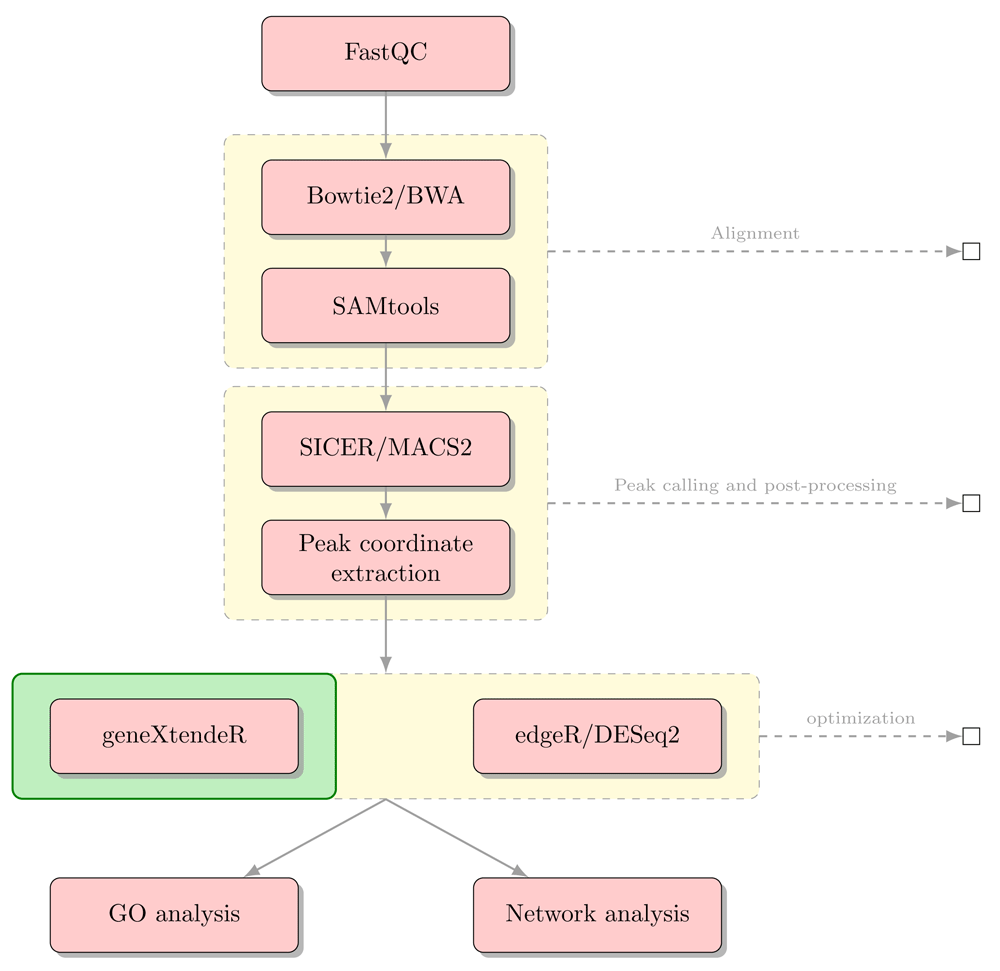
Sample biological workflow using geneXtendeR in combination with existing statistical software to evaluate the role of ChIP-seq peak significance during functional annotation tasks (see description of hotspotPlot() function in package vignette). It is not uncommon for significant peaks to be located thousands of base pairs away from their nearest genes, suggesting that sequences under these respective peaks may further be extracted and analyzed for the presence of known regulatory elements or repeats (e.g., using software programs like TRANSFAC, MEME/JASPAR, or RepeatMasker) or for investigating potential enhancer effects.
First, we tested geneXtendeR19 on all publicly available transcription factor and histone modification ChIP-seq datasets in ENCODE. After downloading and analyzing data from the ENCODE ChIP-seq Experiment Matrix (hg19)34, our large-scale analysis (Figure 1) indicated that ChIP-seq peaks do not concentrate within any specific upstream extension (e.g., 2000 bp) of their nearest protein-coding genes. This observation that ChIP-seq peaks drop off gradually with genomic distance from the start of a gene (first exon) suggests that there is no good general guideline cutoff for capturing proximal histone modifications (e.g., prior studies20,21 have used 2000 bp) or transcription factor binding peaks. There are still hundreds of peak clusters that reside in proximal promoter regions that are 2000–3000 bp away from their nearest protein-coding genes and in distal regions beyond 3 kbp, making ad-hoc decisions like 2 kbp cutoffs too general to be of broad utility across specific use cases. When applying geneXtendeR to both proximal and distal transcription factor (TF) binding peaks for all cell types, we observed some cell type-dependent and TF-dependent peak aggregation dynamics in intervals ranging from 0 to 10 kbp (Figure 3). Similarly, examining distal peaks in representative plots of different chromatin marks in different cell types indicated that peaks indeed aggregate in a cell type and chromatin mark-dependent manner (Figure 4). S1_Appendix35 and S2_Appendix36 provide downloads to the complete compendium of all proximal/distal datasets analyzed from ENCODE.
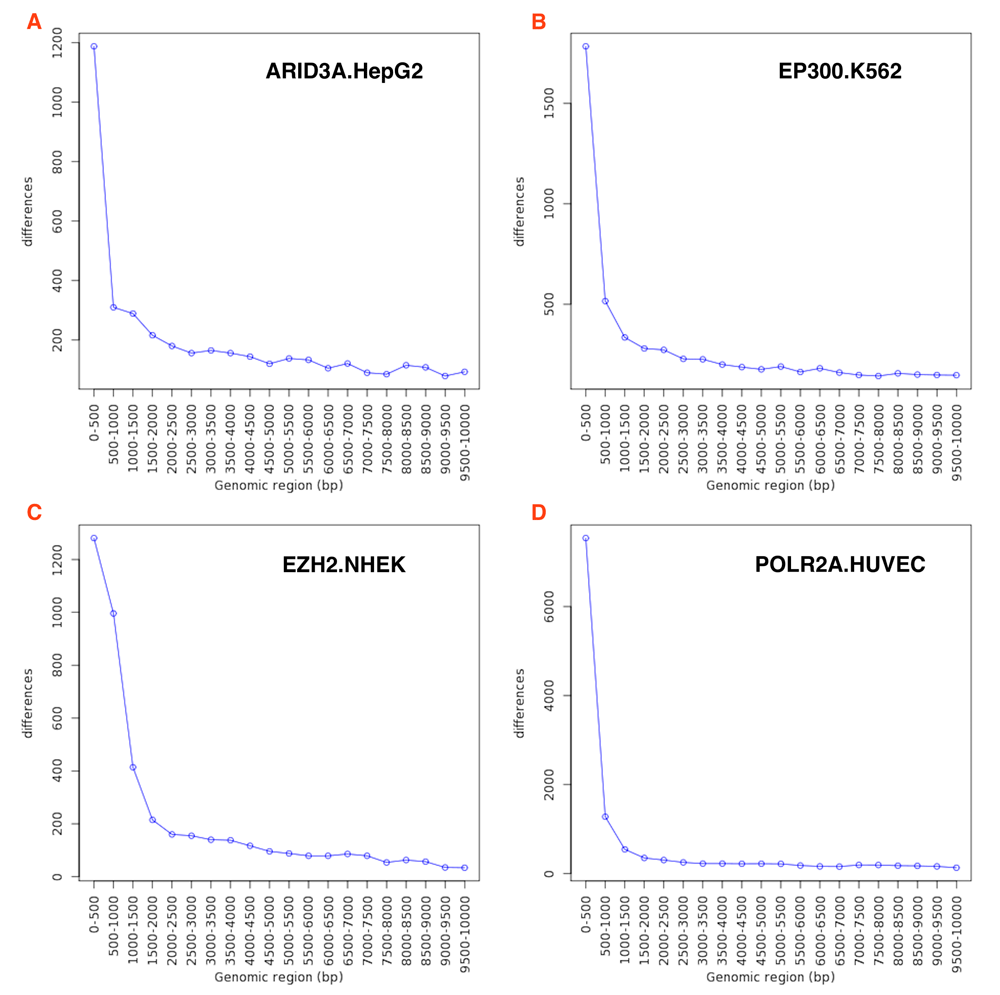
Running geneXtendeR on 547 human transcription factor (TF) ChIP-seq datasets obtained from ENCODE shows that many peaks tend to reside within 500 bp upstream of their respective protein-coding genes yet, depending on the identity of the transcription factor (e.g., EP300) and the specific cell type (e.g., K562), there may be more or less peaks located further upstream and, therefore, a generalized upstream cutoff is not applicable.
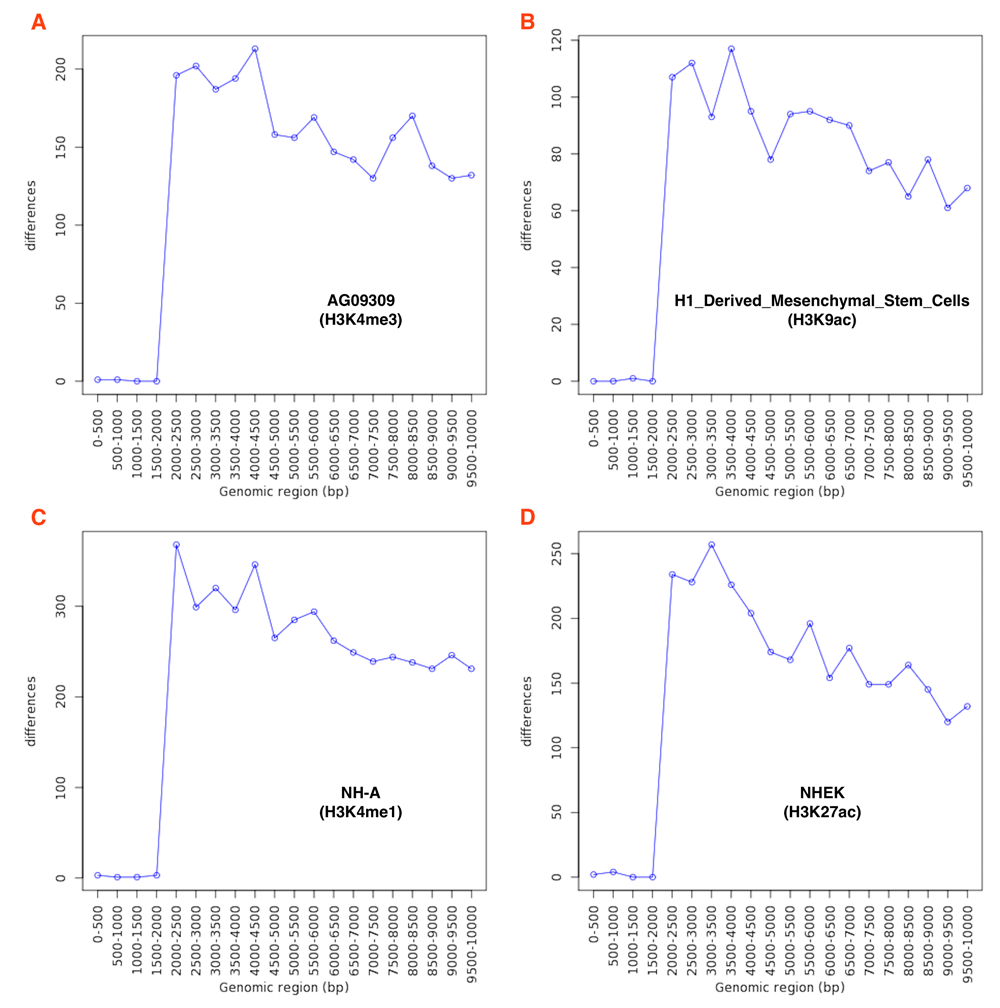
Running geneXtendeR on 198 human histone modification ChIP-seq distal peak datasets obtained from ENCODE reveals that most distal peaks are not congregating within any specific upstream region of their respective protein-coding genes (here we define “distal” as only those peaks that are more than 2000 bp away from their nearest gene). Additional comprehensive analyses (see S1_Appendix and S2_Appendix35,36) were run for proximal peaks (≤ 2000 bp) as well as the complete set of peaks (proximal + distal) from all 198 histone modification ChIP-seq datasets, and similar patterns were observed.
We then focused our attention on using geneXtendeR to perform an end-to-end analysis of a published histone modification ChIP-seq dataset37 deposited in the Gene Expression Omnibus under accession number GSE83979. At the peak-calling stage (Figure 2) we ran two different peak callers (SICER38 and CisGenome39) producing two highly variable peak length profiles even at default run parameters (Supplementary Figure 1). Despite the stark difference in peak profiles, geneXtendeR consistently identified the same top two gene candidates, highlighting its utility for robust functional annotation even in the face of extreme peak variability. Details are discussed in the package vignette.
We followed up this computational analysis by performing n-dimensional annotation of the GSE83979 dataset to provide an expanded view of the gene neighborhood around each individual peak – effectively annotating every peak n times (once for the closest gene, once for the second-closest gene, etc.) and grouping the results into a tabular summary format. We show in the vignette how the second-closest gene may be a preferable candidate for experimental follow-up/validation, especially if the first-closest gene is putative/predicted, while the second-closest gene is known to play a role in a similar biological process based on previously published literature.
The cell-type and TF/chromatin mark-specific complexity apparent in Figure 3 and Figure 4 motivated the design and implementation of user-friendly functions that can calculate ratios of statistically significant peaks to total peaks in various genomic intervals (see hotspotPlot() documentation in geneXtendeR vignette). Similarly, users can transform peaks into merged peaks (see peaksMerge()). geneXtendeR also allows users to explore gene ontology differences at various extensions (see diffGO()) as interactive network graphics (see makeNetwork()) or word clouds (see makeWordCloud()). Furthermore, users can investigate mean (average) peak lengths within any genomic interval (see meanPeakLengthPlot()), showing how average peak broadness can change at different upstream extensions, or examine the variance of peak lengths within a specific genomic interval (see peakLengthBoxplot()). It is also possible to examine unique genes and their associated ChIP-seq peaks between any two upstream extension levels (see distinct()). For example, Figure 5 displays all unique genes (and their respective gene ontologies) that are associated with peaks located between 2–3 kbp across the genome. geneXtendeR also allows users to examine the distribution of peak lengths across the entire peak set (see allPeakLengths()), a function that is useful for visualizing the length distribution of all peaks from a peak caller. These functions (and more) are all explored in detail within the package vignette. After a user has explored the peak coordinates data using these functions to determine the optimal alignment of peaks to a GTF file, the peaks file can be functionally annotated with the annotate() function or one of its counterparts (gene_annotate() or annotate_n()) for n-dimensional annotation.

All unique genes (and their respective gene ontologies (GO)) that are associated with peaks located in promoter-proximal regions between 2–3 kbp genome-wide. Put another way, these are all gene-GO pairs associated with peaks that are distinct between 2000 and 3000 bp upstream extensions across the genome. Orange color denotes gene names, purple color denotes GO terms. A user can hover the mouse cursor over any given node to display its respective label directly within RStudio. Likewise, users can dynamically drag and re-organize the spatial orientation of nodes, as well as zoom-in and out of them for visual clarity.
We have successfully applied geneXtendeR19 during the analysis of a histone modification ChIP-seq study investigating the neuroepigenetics of alcohol addiction40, where geneXtendeR was used to determine an optimal upstream extension cutoff for H3K9me1 enrichment (a commonly studied broad peak) in rat brain tissue based on line plots of both significant peaks and total peaks. This analysis helped us to identify, functionally annotate, and experimentally validate synaptotagmin 1 (Syt1) as a key mediator in alcohol addiction and dependence40. This analysis is explored in detail in the package vignette. Taken together, geneXtendeR’s functions are designed to be used as an integral part of a broader biological workflow (Figure 2).
We present an R/Bioconductor package, geneXtendeR19, that goes beyond the typical nearest-to-gene analyses commonplace to most standard computational ChIP-seq workflows. geneXtendeR offers n-dimensional functional annotation and the ability to investigate the effect of variable-length gene bodies when mapping peaks to genomic features, thereby serving as a next-generation model of peak annotation to nearby features in modern bioinformatics workflows. geneXtendeR therefore represents a critical first step towards tailoring the functional annotation of a ChIP-seq peak dataset according to the details of the peak coordinates (chromosome number, peak start position, peak end position) and their surrounding genomic features.
A variety of different publicly available datasets were used to test geneXtendeR. From ENCODE, a large-scale computational analysis using the hg19 reference genome was performed on 198 histone modification and 547 transcription factor ChIP-seq datasets. These transcription factor and histone modification ChIP-seq datasets in ENCODE are publicly available.
In addition, geneXtendeR was tested on a histone modification ChIP-seq dataset37 deposited in the Gene Expression Omnibus under accession number GSE83979.
Zenodo: S1 Appendix. geneXtendeR analysis on 547 human TF ChIP-seq ENCODE datasets. https://doi.org/10.5281/zenodo.264670235
Zenodo: S2 Appendix. geneXtendeR analysis on 198 human histone modification ChIP-seq ENCODE datasets. https://doi.org/10.5281/zenodo.264670736
Extended data are available under the terms of the Creative Commons Zero "No rights reserved" data waiver (CC0 1.0 Public domain dedication).
Software available from: https://bioconductor.org/packages/geneXtendeR/
Source code available from: https://github.com/Bohdan-Khomtchouk/geneXtendeR
Archived source code as at time of publication: https://doi.org/10.5281/zenodo.264669619
License: GNU General Public License-3
BBK conceived the study, designed the algorithms, implemented the code, performed the analyses, and wrote the manuscript. WCK and DJVB assisted with implementation and analysis. CW supervised the study.
This work was supported by the American Heart Association (AHA) Postdoctoral Fellowship grant #18POST34030375 (Khomtchouk). This work was also partially supported by the Stanford Training Program in Aging Research grant (NIH/NIA T32-AG0047126) and the Army Research Office (ARO), National Defense Science and Engineering Graduate (NDSEG) Fellowship, 32 CFR 168a – both awarded to BBK from 2014–2018. The content is solely the responsibility of the authors and does not necessarily represent the official views of the American Heart Association, National Institutes of Health, or Department of Defense.
The funders had no role in study design, data collection and analysis, decision to publish, or preparation of the manuscript.
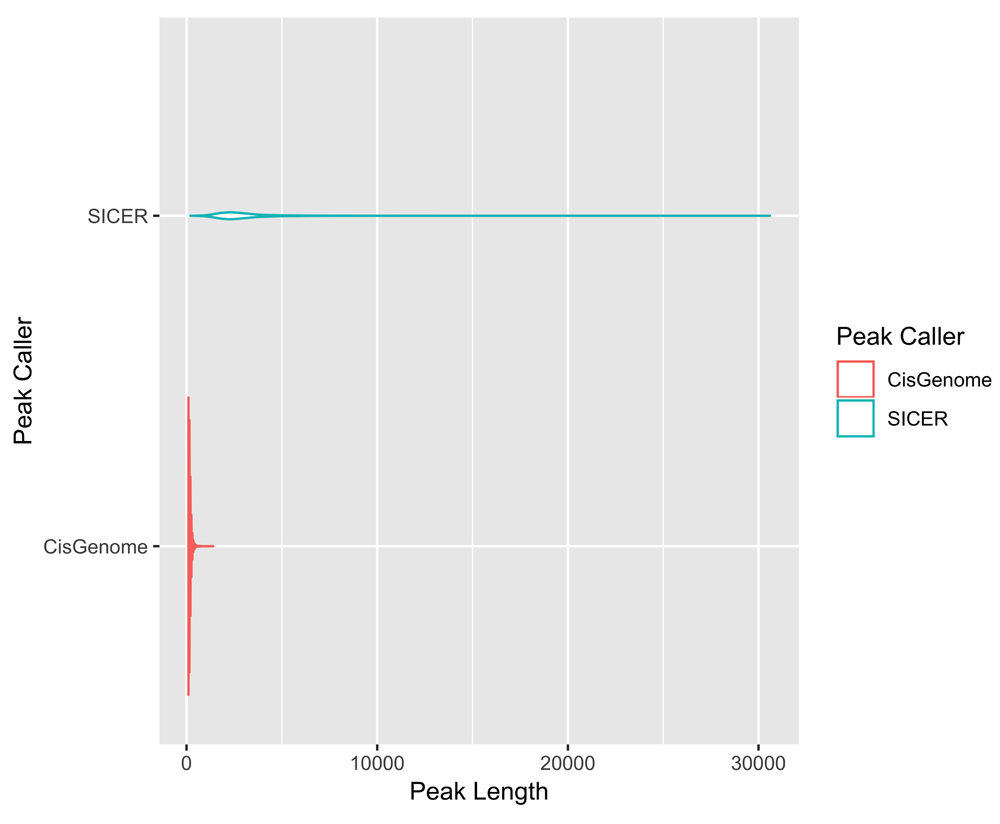
Violin plot showing the differences in peak length distributions of the same ChIP-seq data (available through the Gene Expression Omnibus database, accession identifier GSE83979) analyzed with two separate peak callers (SICER and CisGenome) – despite significant differences in peak lengths generated by the two callers (i.e., peak variability), geneXtendeR’s gene_annotate() function can still robustly call top gene candidates consistently, as explained in the geneXtendeR package vignette.
| Views | Downloads | |
|---|---|---|
| F1000Research | - | - |
|
PubMed Central
Data from PMC are received and updated monthly.
|
- | - |
Is the rationale for developing the new software tool clearly explained?
Yes
Is the description of the software tool technically sound?
Yes
Are sufficient details of the code, methods and analysis (if applicable) provided to allow replication of the software development and its use by others?
Yes
Is sufficient information provided to allow interpretation of the expected output datasets and any results generated using the tool?
Yes
Are the conclusions about the tool and its performance adequately supported by the findings presented in the article?
Partly
Competing Interests: No competing interests were disclosed.
Reviewer Expertise: Genomics
Is the rationale for developing the new software tool clearly explained?
Yes
Is the description of the software tool technically sound?
Yes
Are sufficient details of the code, methods and analysis (if applicable) provided to allow replication of the software development and its use by others?
Yes
Is sufficient information provided to allow interpretation of the expected output datasets and any results generated using the tool?
Partly
Are the conclusions about the tool and its performance adequately supported by the findings presented in the article?
Partly
Competing Interests: No competing interests were disclosed.
Reviewer Expertise: Bioinformatics, epigenetics, epigenomics, chromatin remodeling, chromatin structure
Is the rationale for developing the new software tool clearly explained?
Yes
Is the description of the software tool technically sound?
Partly
Are sufficient details of the code, methods and analysis (if applicable) provided to allow replication of the software development and its use by others?
Yes
Is sufficient information provided to allow interpretation of the expected output datasets and any results generated using the tool?
Partly
Are the conclusions about the tool and its performance adequately supported by the findings presented in the article?
Partly
Competing Interests: No competing interests were disclosed.
Reviewer Expertise: Biostatistics, computational biology, clinical trials, epidemiology, statistical computing.
Alongside their report, reviewers assign a status to the article:
| Invited Reviewers | |||
|---|---|---|---|
| 1 | 2 | 3 | |
|
Version 1 02 May 19 |
read | read | read |
Provide sufficient details of any financial or non-financial competing interests to enable users to assess whether your comments might lead a reasonable person to question your impartiality. Consider the following examples, but note that this is not an exhaustive list:
Sign up for content alerts and receive a weekly or monthly email with all newly published articles
Already registered? Sign in
The email address should be the one you originally registered with F1000.
You registered with F1000 via Google, so we cannot reset your password.
To sign in, please click here.
If you still need help with your Google account password, please click here.
You registered with F1000 via Facebook, so we cannot reset your password.
To sign in, please click here.
If you still need help with your Facebook account password, please click here.
If your email address is registered with us, we will email you instructions to reset your password.
If you think you should have received this email but it has not arrived, please check your spam filters and/or contact for further assistance.
Comments on this article Comments (0)