Keywords
emergency department, hypertension, health disparities
emergency department, hypertension, health disparities
The emergency department (ED) has emerged as the primary portal for entry to the hospital for most patients with acute health care problems and acute manifestations of underlying chronic diseases, including hypertension1. According to the Center for Disease Control and Prevention, a striking 45% of U.S. adults have been diagnosed with high blood pressure, defined as a systolic blood pressure (SBP) of at least 130 mmHg or a diastolic blood pressure of at least 80 mmHg2. In addition, studies have demonstrated an increase in emergency department utilization for hypertension. One study reports that from 2006 to 2012, U.S. emergency departments saw a 30% increase in the proportion of adult visits related to hypertension and a 16% increase in the proportion of adult ED visits with a primary diagnosis of hypertension1. Hypertension is not only a known risk factor for cardiovascular disease, but an estimated 1-2% of hypertensive patients will develop a hypertensive crisis, which can lead to a variety of critical conditions, including stroke, heart attack, heart and kidney failure3.
Despite known recommendations to repeat blood pressure values above 140/90 and refer to outpatient facilities for follow up care4, the protocol for when to admit patients presenting to the ED with high systolic blood pressure is currently undefined. Nevertheless, patients with significantly raised SBPs are routinely admitted into the hospital for administration of anti-hypertensive drugs and monitoring. In this retrospective study, using the National Hospital Ambulatory Medical Care Survey, we investigated the odds of admission for patients with various degrees of elevated systolic blood pressure. We hypothesized that increasing systolic blood pressure increases the likelihood of hospital admission. In addition to the severity of SBP, we elucidated the effect of race/ethnicity on admission. Finally, our sensitivity analysis assessed the odds of admission for a subpopulation of patients presenting to the ED with a primary complaint of chest pain.
Data for this study was extracted from the raw data from the National Hospital Ambulatory Medical Survey (NHAMCS). This cross-sectional database collects information annually from a representative sample of emergency departments, outpatient clinics, and ambulatory surgery centers, excluding federally associated medical centers, military and veterans’ hospitals5. Further details regarding the methods for sampling and including visits are available at the NHAMCS website, maintained by the United States Centers for Disease control. The website also provides code for extracting the raw data into common statistical packages. We included all adult (age 18 and older) visits from 2014.
Our pre-specified hypothesized biological relationship that presenting systolic blood pressure is related to the likelihood of hospital admission was based on the positive correlation between elevated SBP and cardiovascular disease (CVD). Although many indicators of heart disease have been identified, studies show that systolic hypertension is one of the leading risk factors6. Thus, it follows that patients with high SBP are more likely to be admitted into the hospital. We were also interested in how race/ethnicity modified this relationship. In addition, we believed a priori, that some very low and very high blood pressures represented different conditions (shock and hypertensive crisis, respectively).
For all analyses, we used the SURVEY functions of SAS (version 9.3) to account for the complex survey design when determining point estimates and standard errors. In the first step of our analysis, we plotted the probability of admission based on 10 mm Hg intervals of presenting systolic blood pressures (≤70, 71–80, etc.). In addition, we wished to determine the functional form of this relationship to see if we should include this as a linear predictor or apply some transformation. We then created a stratified plot by race ethnicity. Our plan was to visually inspect this stratified graph for an area of interest for multivariable models. After determining the area of interest, we excluded patients with very high and very low blood pressures. We characterized baseline visit, demographic, patient medical, and hospital level variables by reported race/ethnicity (including how many visits are represented in the data set).
In order to adjust for patient, hospital and regional related factors, we pre-specified a series of nested, logistic regression models that predicted the likelihood of admission. In the first model (Model 1), we included only race-ethnicity categorically as a predictor along with continuous systolic blood pressure. In addition, we scaled the variable to be equivalent to a 10 mm Hg increase in systolic blood pressure by dividing the observed SBP by 10. We used the odds ratio estimates in the first model to determine which race/ethnic groups to combine to determine whether we would have multiple groups, or two categories (non-Hispanic white versus all other) based on similar odds ratios. We pre-specified that we would either exclude or collapse race/ethnic categories with low numbers in the dataset. In subsequent models, we evaluated whether the point estimate for the odds ratio for admission based on race/ethnicity changed substantially with the addition of potentially confounding variables. In the second model (Model 2), we added the patient level variables that we believed a priori had a relationship with admission (age, sex, hypertension history, and insurance).
In the third model (Model 3), we added visit level variables describing the reason for presentation and the perceived acuity (immediacy with which patient should be seen, whether visit is related to injury/trauma or other, mode of arrival [ambulance vs other]). In the fourth and final model, we added hospital level characteristics (size, teaching status, region, urban vs rural, and hospital ownership). We pre-specified that if there was no evidence of confounding by the 10% rule (that the odds ratio for the covariate estimate for race/ethnicity did not change more than 10% when accounting for confounders) that we would accept that model for evaluating interactions (i.e. if adjusting for patient, visit, and hospital level predictors did not change the observed relationship between race and admission then we would use model 1.) We planned to determine whether an interaction term of race/ethnicity*blood pressure was significant at the p=0.05 level, and if it was we would report that as our final model.
We did not pre-specify a sample size, and focused on effect size estimation within a single year of NHAMCS data.
NHAMCS analyses have not been validated using the complex survey packages in the open source statistical package R. However, the SAS datasets we created from the NHAMCS data can be imported into R using the haven package.
Since it is possible that patients with different race/ethnic backgrounds may describe symptoms differently and have different thresholds for using the emergency department, we repeated the entire above analysis plan, but we limited the included population to patients with a chief complaint of chest pain. Chest pain is among the most common complaints in the ED and several potential causes of chest pain are the end result of long-standing hypertension.
In total, 23,844 observations were included in this study, representing approximately 140 million ED visits. We restricted our cohort to patients 18 years or older who had systolic blood pressures in the range concurrent with the positively linear aspect of the relationship between SBP and admission into the hospital. This cohort represented 13,119 encounters representing 80 million visits. Within this cohort, 1774 encounters (13.5%) were admitted to the hospital, representing 9.2 million visits. The mean age of this subpopulation was 45.4 years with a standard deviation of 0.44 year. 55.5% of these patients were female [95% CI (53.9, 57.1)], while 44.5% were male [95% CI (42.9, 46.1)]. In addition, 59.6% of patients identified as non-Hispanic White, 24.9% as non-Hispanic Black, 12.9% as Hispanic, and 2.7% as Other. Private insurance was the primary health care payer (29.2%) followed closely by Medicaid insurance (23.9%). Approximately 22% of patients had Medicare as primary insurance, and another 14% were self-pay. We provide the statistical package output and data files at the University of Michigan Deep Blue Institutional Repository (see underlying data7).
The unstratified graph between SBP and admission to the hospital demonstrates an initial negative relationship at the lower extremes of blood pressure (Figure 1). This association, however, becomes positive beginning with the categories of SBP that represent values ranging from 110 mmHg to greater than 200 mmHg. We decided to narrow our analysis to this positively linear aspect of the relationship (SBP categories 2-8), in accordance with our hypothesis that elevated systolic blood pressures warrant admission to the hospital for intervention and further monitoring and our a priori belief that extremely low or extremely high blood pressures would have high admission probability and not inform the modeling.
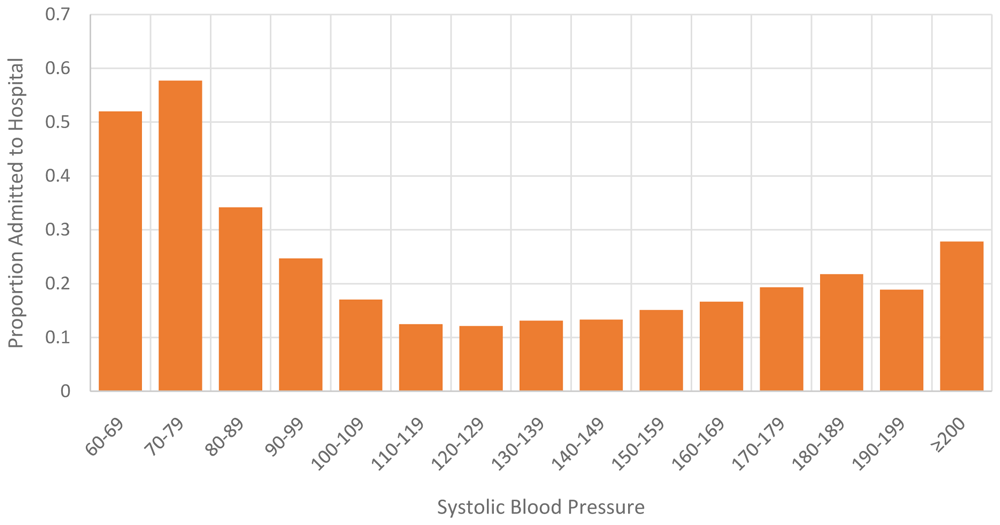
Proportion of adult patients admitted to hospital from the emergency department, based on triage blood pressure.
Figure 2 shows the relationship between SBP and hospital admission stratified by race. The graph indicates that the rate of hospital admission for non-Hispanic Whites is generally higher for the same systolic blood pressure values than non-Hispanic Blacks, Hispanics, and those who identified as Other. Patients in the Other category were admitted to the hospital at the second highest rate, followed by non-Hispanic Blacks and Hispanics. Rate of hospital admission notably clusters around the same frequency among the last three race groups for elevated SBP. At these elevated blood pressures, a prominent gap between the last three racial groups and non-Hispanic Whites is quite evident.
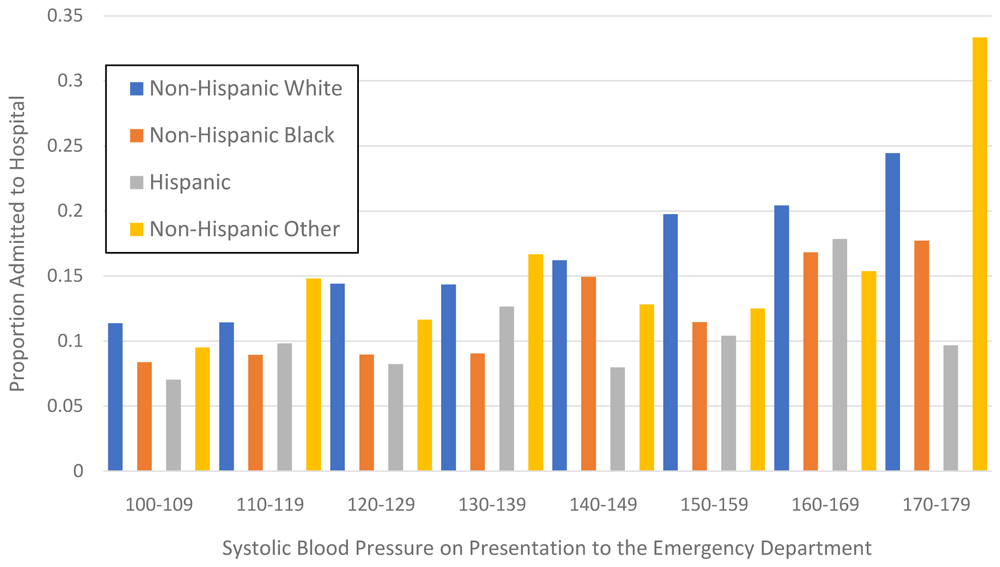
Proportion of adult patients admitted to hospital from the emergency department by race and ethnicity, based on triage blood pressure within the region of interest for blood pressure.
Our unadjusted logistic regression model is represented in Table 1. The odds ratio of this primary model is 1.12 (95% CI: 1.06, 1.18), which indicates that the odds of being admitted into the hospital is 1.12 times higher for every 10 mmHg increase in systolic blood pressure. In Model 1, we included race/ethnicity, for which we created a new, binary variable where non-Hispanic Black and Hispanic were binned together, and non-Hispanic White was the reference group. After holding systolic blood pressure constant, non-Hispanic Whites have approximately 1.9 times greater odds of being admitted than non-Hispanic Black or Hispanic patients [OR = 1.88, 95% CI (1.45, 2.42)]. Model 2 includes the two aforementioned variables as well as individual and visit factors we believed a priori may influence the odds of admission. These variables included age, sex, insurance type (a manually created binary variable in which private insurance, Medicare, Medicaid/CHIP, worker’s compensation, and other was coded as insured = 1), history of hypertension, arrival by ambulance, visit due to injury/trauma, overdose, poisoning, or some other adverse effect of medical care, and triage level. Counterintuitively, this model suggests that the odds of hospital admission decrease by about 5% with every 10-mmHg increase in SBP everything else held constant [OR = 0.96 95% CI (0.91, 1.005)]. Meanwhile, the odds of hospital admission for non-Hispanic Whites continues to be 1.5 times higher than the two minority groups [OR = 1.53, 95% CI (1.18, 1.98)]. In our fourth and final model, we combined the individual and visit level variables with hospital-level factors, including region, urbanicity, and whether the patient was seen by a resident, nurse practitioner, or physician’s assistant. Table 1 demonstrates the odds ratio estimates for this model and shows that elevated SBP continues to have lower odds [OR = 0.956, 95%CI (0.909, 1.005)] of admission and that non-Hispanic Whites have greater odds of being admitted [OR = 1.54, 95% CI (1.179, 2.007)] into the hospital than their non-White counterparts.
Results of the models predicting hospital admission. Model 0 used only SBP to predict hospital admission, Model 1 added in race and ethnicity, Model 2 added in age, sex, hypertension history, and insurance, and Model 3 additionally adjusted for hospital-level factors, including region, urbanicity, and whether the patient was seen by a resident, nurse practitioner, or physician’s assistant.
In the third phase of our study, we repeated the above analysis with a subgroup of the study population comprised of those with a chief complaint of chest pain (Table 2). The odds ratio for the unadjusted model was 1.2 [95% CI (1.03, 1.41)], indicating that the odds of hospital admission are 1.2 times greater for every 10-mmHg increase in SBP in patients with chest pain. The odds ratio for hospital admission in Model 1 is the same as in the unadjusted model. Although more attenuated than in the first part of our analysis, non-Hispanic Whites continue to have greater odds of being admitted into the hospital than their non-Hispanic Black and Hispanic counterparts, even among those presenting with chest pain [OR = 1.12, 95% CI (0.65, 1.93)]. The third model includes age, sex, history of hypertension, and insurance status in addition to the variables in the first two models. Holding everything constant, odds of admission are slightly more attenuated but still greater than one [OR = 1.06, 95% CI (0.90, 1.24)] for every 10-mmHg increase in SBP among those with chest pain. Interestingly, Whites have a 13% lower odds of hospital admission in this final model [OR = 0.87, 95% CI (0.5, 1.53)]. We did not conduct a fully adjusted model with hospital factors given the smaller sample size of this subset, as the estimates became unstable.
Results of the models predicting hospital admission. Model 0 used only SBP to predict hospital admission, Model 1 added in race and ethnicity, Model 2 added in age, sex, hypertension history, and insurance; we did not adjust for hospital factors in the final model given the smaller sample size of this subset.
The unadjusted analysis of the relationship between admission to the hospital and systolic blood pressure demonstrates an overall upgoing trend – as blood pressure increases, the proportion of patients who are admitted into the hospital also increases. There is a portion of this graph in Figure 1 that indicates a negative association, however, blood pressures at the lower extreme are generally concerning for life-threatening conditions (e.g. shock, hemorrhage), and these patients are also likely to be hospitalized from the ED.
The positive association between increasing blood pressure and hospital admission was confirmed in our first two regression models (Table 1 and Table 2). In the fully adjusted model (Table 1), however, the odds of hospital admission unexpectedly decreased. Our sensitivity analysis with chest pain indicated higher odds of admission with race, age, and sex held constant, in accordance with Model 0 and Model 1 in our primary analysis. Previous studies have demonstrated an increase in ED utilization and hospitalization due to hypertension1,8. The results of our study appear to be generally consistent with these previous studies, however, the slightly reduced odds of admission in the fully adjusted model (Table 1) may simply speak to the complexity involved in the decision to hospitalize a patient.
According to the stratified unadjusted graph (Figure 2), the same positive trend of hospital admission exists among all four race groups. Nevertheless, a consistently higher percentage of non-Hispanic Whites are admitted to the hospital compared to their non-Hispanic Black and Hispanic counterparts for the same range of SBP values. This was also confirmed in our regression models. After accounting for a variety of factors that we believed a priori could be associated with hospital admission, non-Hispanic Blacks and Hispanics consistently had lower odds of admission compared to non-Hispanic Whites. Similarly, in our analysis of patients presenting with chest pain, non-White patients still had lower odds of admission.
There is extensive literature identifying known patterns of racial disparity in cardiovascular health – namely that non-Hispanic Blacks have higher rates of hypertension and worse hypertension control9,10. Studies show that despite an overall decrease in cardiovascular mortality, African-Americans are 30% more likely to die from heart disease compared to non-Hispanic Whites9. Moreover, non-Hispanic Black individuals have higher rates of risk factors that contribute toward cardiovascular disease and are disproportionately affected by manifestations of heart disease, such as myocardial infarction (MI), stroke, and heart failure9. Health disparities are not only fueled by patient and provider behavior but health care systems as well9. While certainly a complicated relationship, our study identified a racial gap in hospital admission after accounting for a number of potential confounders, which may suggest an important area of improvement. Knowledge of the increased cardiovascular morbidity and mortality among African American and Hispanic patients should help to improve admission practices for minority patients and thus reduce the existing gap of cardiovascular outcomes between non-Hispanic Whites and non-Whites.
This study does contain a few limitations. First, we used only one year of NHAMCS data (2014), which prevented us from being able to establish temporal hospital admission trends for hypertension. Second, we recognize that patients with elevated systolic blood pressure could present to the ED for a number of reasons ranging from trauma to anxiety to headache and blurred vision. Patient presentation could significantly influence whether or not patients are admitted, thus making the association between hospital admission and increased SBP non-linear. Nevertheless, we attempted to mitigate this by conducting a sensitivity analysis with chest pain, and the results demonstrated similar patterns identified in the broader study. In addition, this sample was limited to non-Federal emergency department visits in the United States and how these findings would generalize to other locales is unknown.
In summary, elevated systolic blood pressure is a known risk factor for cardiovascular disease, and left unmanaged, can lead to a series of health consequences including heart disease, stroke, and even death. Our study highlights two important findings: 1) While patients with elevated systolic blood pressure are generally more likely to be admitted into the hospital, this relationship becomes more complex when considering patient-, visit-, and hospital-level factors. 2) Non-Hispanic Whites consistently have a higher likelihood of hospital admission for hypertension compared to non-Hispanic Black and Hispanic patients. This presents a crucial area of improvement, particularly given the worse cardiovascular outcomes in the minority patient population.
The data utilized in the above study were from a publicly accessible data set found on the Center for Disease Control and Prevention’s website for the National Center for Health Statistics https://ftp.cdc.gov/pub/Health_Statistics/NCHS/Datasets/NHAMCS/ED2014.zip Instructions for formatting the raw data for common statistical packages are available at https://www.cdc.gov/nchs/ahcd/datasets_documentation_related.htm
University of Michigan - Deep Blue: Dataset derived from 2014 National Hospital Ambulatory Care Survey - Emergency Department. https://doi.org/10.7302/9c2f-gr80
- nhamcs14.sas7bdat ( SAS datafile that contains all visits from the 2014 NHAMCS with SAS formats and labels)
- will24July2017.sas (SAS syntax file that imports data from raw NHAMCS file and performs analyses– later version)
- jessie14June2017.sas (SAS syntax file for analysis and import, preliminary version)
- ed14for.txt ( SAS formats from NHAMCS for variables)
- ed14lab.txt (SAS label file from NHAMCS for variables)
- SAS_Output_July25.html (raw SAS output from final analysis that generated data for this manuscript, including all parameter estimates and fit statistics of logistic models)
- SAS_Output_july24.htm (raw SAS output from preliminary analysis)
Data are available under the terms of the Creative Commons Zero "No rights reserved" data waiver (CC0 1.0 Public domain dedication).
| Views | Downloads | |
|---|---|---|
| F1000Research | - | - |
|
PubMed Central
Data from PMC are received and updated monthly.
|
- | - |
Provide sufficient details of any financial or non-financial competing interests to enable users to assess whether your comments might lead a reasonable person to question your impartiality. Consider the following examples, but note that this is not an exhaustive list:
Sign up for content alerts and receive a weekly or monthly email with all newly published articles
Already registered? Sign in
The email address should be the one you originally registered with F1000.
You registered with F1000 via Google, so we cannot reset your password.
To sign in, please click here.
If you still need help with your Google account password, please click here.
You registered with F1000 via Facebook, so we cannot reset your password.
To sign in, please click here.
If you still need help with your Facebook account password, please click here.
If your email address is registered with us, we will email you instructions to reset your password.
If you think you should have received this email but it has not arrived, please check your spam filters and/or contact for further assistance.
Comments on this article Comments (0)