Keywords
COVID-19, Mechanical Ventilator, Simulation
COVID-19, Mechanical Ventilator, Simulation
One of the positive COVID-19 consequences is a great social gathering of creators, scientists and engineers to assist the worldwide pandemic effort, including the design of custom-made open source ventilators1. The review of Pearce (2020) covers about 160 publications and links to websites that provide computer-assisted design (CAD) models, construction and installation instructions and bills of materials. It is probably not covering hundreds of other projects that are not published yet or could not pass the strict definitions of the open-source ventilator of the author.
Manshema is an emergency ventilation machine and was created during the Assuta COVID-19 Hackathon Sprint by the group comprising engineers, medical doctors, and scientists. The Manshema Ventilator (MV) was designed to assist in the ventilation of patients who are capable of autonomous breathing yet require assistance to maintain a sufficient positive end expiratory pressure (PEEP) and blood oxygen saturation levels.
One of the major drawbacks of the custom-made open-source ventilator designs is that these are created in a very short time and do not allow detailed analysis of their performance, quality assurance and thus regulatory approval. One of the key points is a lack of proper set of mathematical models that describe the performance of a specific ventilator due to a large variety of the parts, sensors and components used in its creation. This study is addressing this gap by creating a detailed mathematical model and a simulator of a realistic lung ventilation, carefully calibrated and tuned specifically to the MV design, parts and sensors. The simulation will provide the design team the opportunity to design the next version, to extend the ventilator capabilities and to assure its performance corresponding to the specific patient condition. Furthermore, the simulation provides a template for a large variety of open source designs, such as Ambu bag ventilators or linear actuator ventilators, and may eventually lead to a closed loop, feedback-back control at the level of commercial regulatory approved mechanical ventilators.
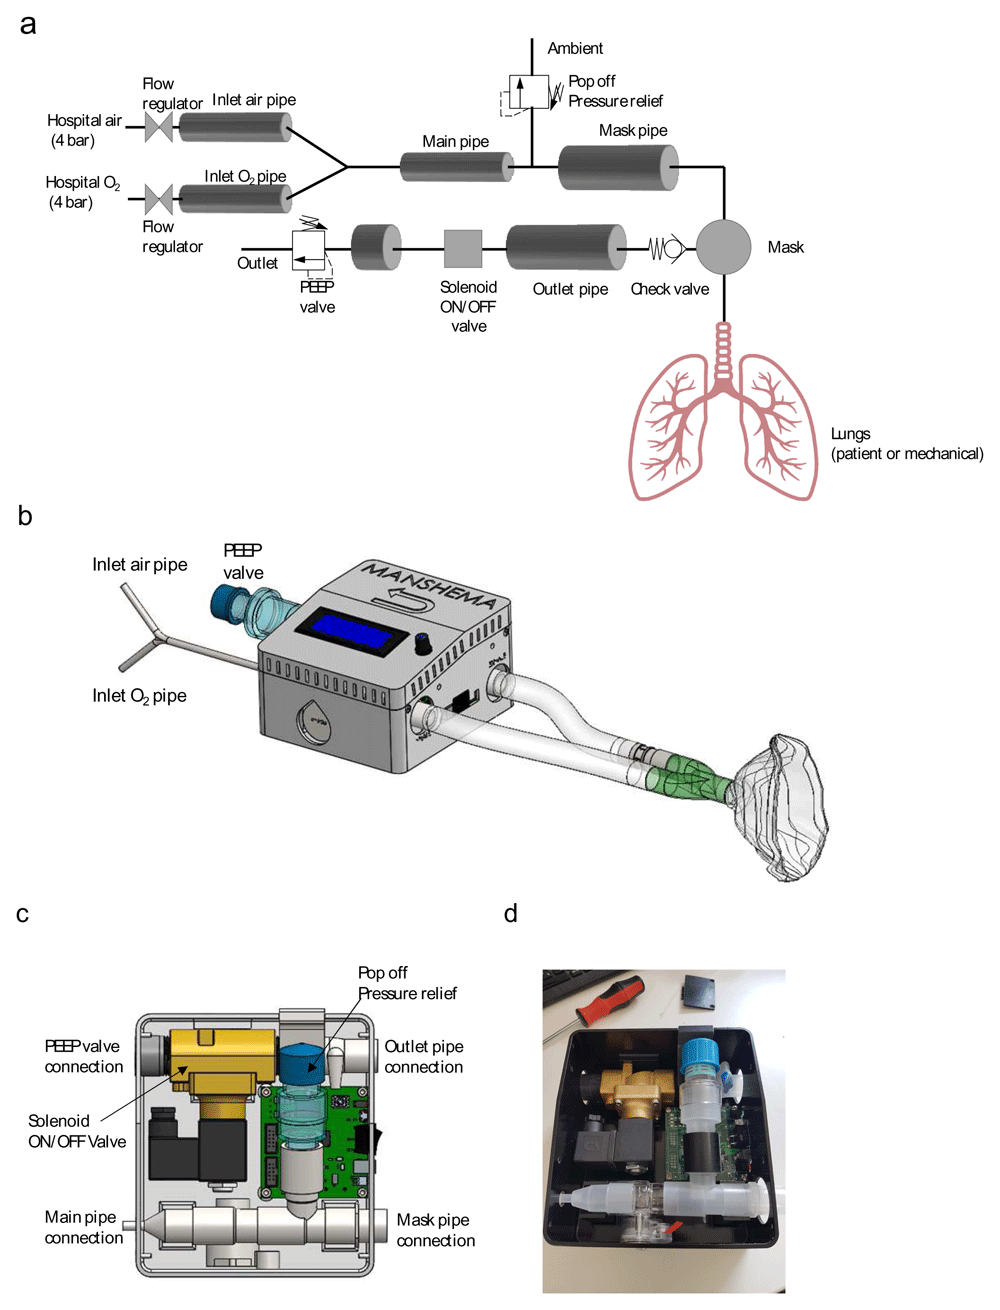
The MV consists of an input branch which mixes air and oxygen from the hospital reservoirs and feeds it into the patient mask, and an expiratory output branch which is opened or closed by the control system. Figure 1a shows a schematic illustration of the MV. The input compressed air and oxygen are supplied by the hospital central reservoirs. The flow from each of the reservoirs is controlled with a flow control valve. After the flow control valves, the gases flow through two similar pipes, mix and flow through the main pipe and mask pipe towards the breathing mask. A pressure relief valve marked Popoff is located between the Main pipe and the Mask pipe. This pressure relief is set to mechanically control the maximal pressure in the system and avoid over-pressuring the lungs. The expiratory air flows through a directional check valve which does not permit breathing the exhaled gasses. After the check valve, the outlet pipe leads to the expiratory flow control system which opens and closes the expiratory pipe flow path using an ON/OFF solenoid valve. The outlet of the control system is connected to a pressure relief valve that is set according to the required PEEP valve. Figure 1b shows a CAD drawing of the complete MV system, and Figure 1c shows a CAD drawing of the main components of the MV. Figure 1d is a photograph of the main components of the MV prototype.

(a) A schematic description of the Manshema ventilator. The pressure measurements and control system are not shown. (b) A CAD drawing of the full MV, (c) a CAD drawing of the MV main components, (d) a photograph of the main components of the MV prototype. PEEP, positive end expiratory pressure; CAD, computer-assisted design; MV, Manshema ventilator.
In order to reduce the system costs to minimum, the MV operates with a single pressure sensor and a solenoid valve which controls the gas flow out of the system. The minimum and maximum pressure in the system are controlled with a hysteresis control scheme. This control strategy is realized with a pressure sensor located near the inlet to the solenoid valve and a relay which sets the state of the solenoid valve according to the measured pressure. In its initial state, the solenoid valve is closed directing the input air to the patient allowing the pressure to build up. When the patient exhales, the pressure at the expiratory pipe increases rapidly and after it reaches the expiratory positive airway pressure (EPAP), the relay opens the solenoid valve, the exhaled air is removed, and the pressure starts to drop. Once the patient starts to inhale, air is removed from the pipes and the pressure drops. When the pressure reaches the inspiratory positive airway pressure (IPAP) the solenoid valve closes, and the breathing cycle continues.
The MV model was built with MathWorks® Simulink® Simscape™ Gas system toolbox. The outline for the model followed the MathWorks® “Medical Ventilator with Lung Model” example and was modified to describe the MV design, control system as well as an autonomously breathing patient. The model source files, along with an elaborated description of model parameters, variables, Simulink® block parameters and their values can be found under the data availability section as well as in the model OSF webpage2.
Figure 2 shows the block diagram of the model and Figure 3 shows a block diagram of the control system. The lungs are modeled as a translational mechanical converter that is coupled to a spring, a damper, and a force source. The spring and damper model the mechanical compliance and resistance of the lungs3 and force source models the muscle induced pressure4 which is a result of the patient autonomous breathing (patients that cannot breath autonomously can be modeled by replacing the variable muscle pressure term with a constant pressure). The pressure induced by the muscles contraction and relaxation, Pmus, is realized with exponential functions as described by Fresnel et al.4:
Where T1 is the time period for muscles contraction in every breathing cycle and Ttot is the breathing cycle length. τc and τr are the contraction and relaxation time constants, respectively, and Pmax is the maximum pressure that can be induced by the muscles. All the parameters in Equation (1) can be easily derived from the mouth occlusion pressure, P0.1 and the breathing frequency, fv as described in 4. A block diagram of the lungs branch is shown in Figure 4.
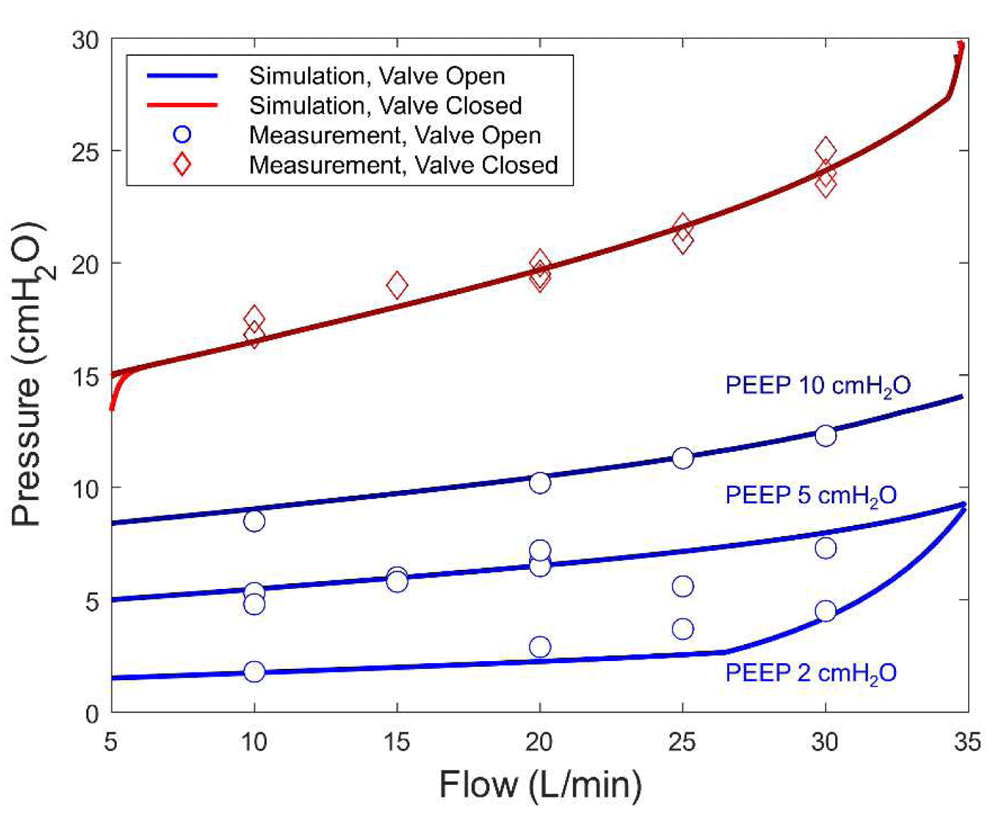
Model calibration. The model was calibrated against the MV prototype in two steps. First, the parameters of the PEEP and Popoff pressure relief valves were calibrated by comparing the model output to the measured output when the lungs port was blocked. In this set of experiments, the pressure at the inlet to the solenoid control valve was measured as a function of the total input gas flow rate when the solenoid valve was open and when it was closed. The experiment was repeated for PEEP values of 2, 5 and 10 cmH2O. For each of the pressure relief valves in the model the set pressure differential and the maximum valve open area were tuned to provide the best fit to the measured data. Figure 5 shows the modeled and measured pressure as a function of the input gas flow rate and PEEP values of 2, 5 and 10 cmH2O.

The modeled and measured pressure as a function of the input gas flow rate and PEEP values of 2, 5 and 10 cmH2O. PEEP, positive end expiratory pressure.
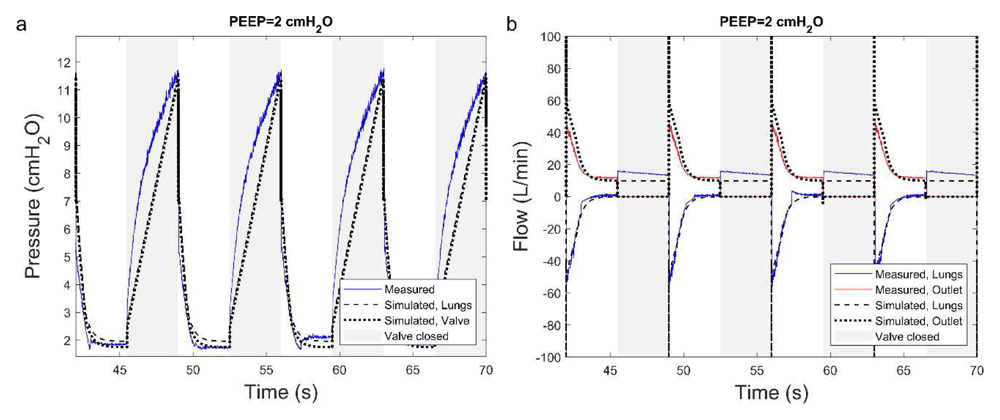
Next, the model calibration was tested by comparing model results to the output of the MV prototype when it was connected to an IMTMedical Easylung test lung. In order to minimize the effects of the popoff and PEEP valves, the total input gas flow rate was set to 10 L/min and the PEEP was set to 2 cmH2O. To probe the transient response of the MV, the solenoid valve was opened and closed in intervals of 3.5 seconds. Under these conditions, pressure drops across the different parts of the system are low, the Popoff valve remains closed throughout the experiment and the pressure in the system is determined mostly by the mechanical lung parameters. This provides optimal conditions for calibrating the mechanical lungs’ compliance and resistance in the model. Figure 6 shows the measured and modeled pressure (a) and gas flow (b). The gray regions in the figure are time periods in which the solenoid valve is closed. The fitted spring and damper constants for the lungs model are 148.5 N/m and 40 N/(m/s), respectively. When the solenoid valve is closed, air is directed into the test lung, increasing the pressure in it. Then, when the solenoid valve is reopened, the air in the test lung along with air from the reservoirs flow out of the system through the PEEP pressure relief valve. The MV model was able to capture the measured transient response of the system well. Particularly, the modeled gas flow follows the measured values closely.

The measured and modeled pressure (a) and gas flow (b) in a mechanical lung experiment. The PEEP was set to 2cmH2O and the total input gas flow was set to 10 L/min. The regions with the gray background are time periods in which the solenoid valve was closed. The fitted spring and damper constants for the lungs model are 148.5 N/m and 40 N/(m/s), respectively. PEEP, positive end expiratory pressure.
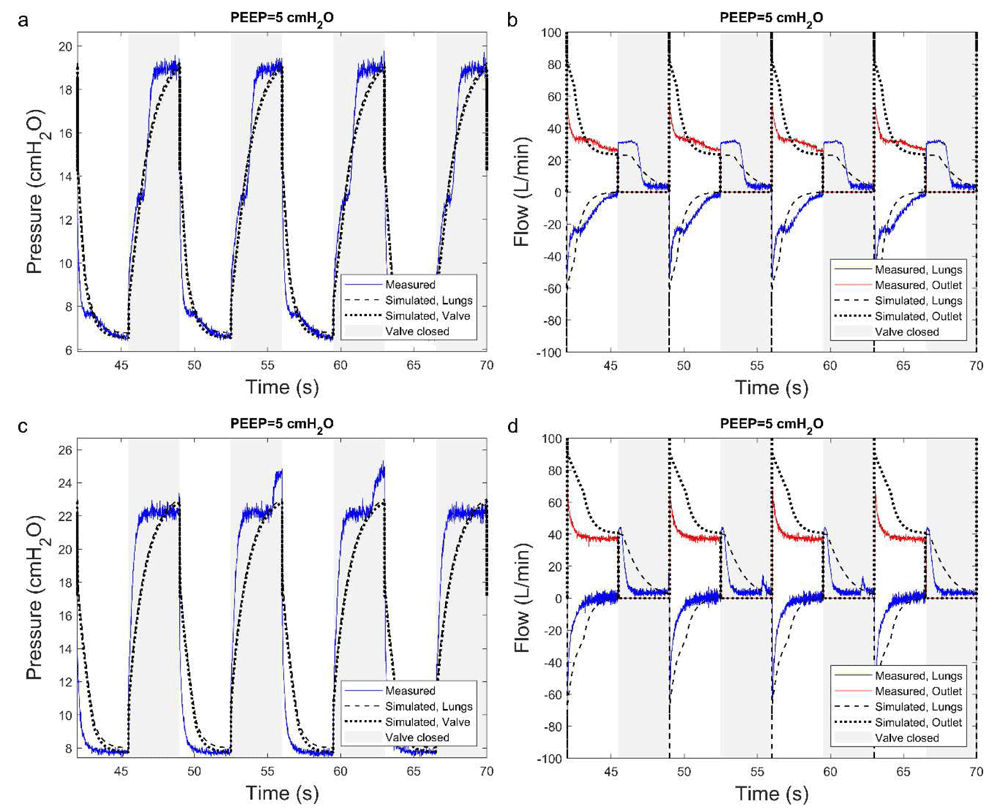
Once the lungs parameters were found, the model predictions were compared to experimental measurements at input flow rates of 20L/min and 30 L/min and a PEEP of 5 cmH2O, which better represent the operating conditions of the MV. Figure 7 shows the modeled and measured pressure and flow rates with input gas flow rates of 20 L/min (Figure 7 a and b) and 30 L/min (Figure 7 c and d). The regions with the gray background in Figure 7 are the time periods in which the solenoid valve was closed. Unlike the lung calibration experiments in which the Popoff valve remains constantly closed, at a flow rate of 20 L/min the Popoff valve opens when the pressure rises above 13 cmH2O and closes back when it drops below 8 cmH2O. This transition, which is not instantaneous, is not captured well in the simulation, resulting in a deviation between the measured and modeled responses. Nevertheless, the simulation was able to predict fairly well the minimum and maximum pressure in the system, which are most important for its safe operation. In a similar manner, there is a deviation between the measured and modeled flow in the system when the input gas flow rate. The overestimation of the calculated air flow under higher input flow rates may be a result of leakages in the system that are not considered in the model.

The measured and modeled pressure (a,c) and gas flow (b,d) in a mechanical lung experiment. The PEEP was set to 5cmH2O and the total input gas flow was set to 20 L/min (a,b) and 30 L/min (c,d). PEEP, positive end expiratory pressure.
Open source implementation. The model can be implemented using similar or equivalent components in the open source OpenModelica software utilizing Modelica.Fluid and Modelica.OpenHydraulics libraries. In Table 1, we detail equivalent or most similar components, together with component names that could be used in construction of an equivalent model.
After the model is calibrated and tested, we turn to simulate the ventilation of autonomously breathing patients. We start by simulating the ventilation of a healthy person which is embodied by a breathing rate of 15 breaths per minute5, and an occlusion pressure of 4 cmH2O4. The simulated lungs spring and damper constants are as in Figure 6. Figure 8 a, b and c show the simulated pressure, flow and tidal volume, respectively. Positive flow denotes gas flow out of the system, for example when air is inhaled into the lungs. The gas flow is negative when gas flows into the MV, for example when the patient is exhaling. The pink regions in the figure are the periods in which the patient is trying to inhale and the solenoid valve is closed, the light blue regions are the periods in which the solenoid valve is open and the patient is trying to exhale, the purple regions are periods where the patient is attempting to inhale while the solenoid valve is open and white areas are periods in which the patient is attempting to exhale while the solenoid valve is closed. The color coding for the patient breathing state and the state of the solenoid valve is summarized in Table 2. As the patient begins to inhale (purple region), the lungs expand, air flows into the lungs, and the pressure in the expiratory pipe drops. Once the pressure reaches the IPAP, the solenoid valve closes (pink region) and the input gas is inhaled by the patient, resulting in a nearly constant gas flow at a rate that is determined by the flow regulating valves at the inputs to the system. The pressure in the lungs decreases at the beginning of this stage as the lungs are still expanding and then it increases slowly as the lungs fill with air. When the patient attempts to exhale the pressure increases rapidly in the system. At first the solenoid valve is still closed and gas flows into the patient’s lungs (white region), but once the EPAP is reached, the solenoid valve opens and the air flows out of the MV through the expiratory pipe (light blue region).

The calculated pressure (a) flow (b) and tidal volume (c) time evolution in the lungs and at the control system solenoid valve. The patient breathing rate was taken to be 15 breaths per minute, the occlusion pressure is 4 cmH2O, IPAP was set to 5 cmH2O and the EPAP was set to 13 cmH2O. The color coding is as described in Table 2.
| Region Color | Patient breathing state | Solenoid valve state | ||
|---|---|---|---|---|
| Inhaling | Exhaling | Open | Close | |
| Pink | x | x | ||
| Purple | x | x | ||
| Blue | x | x | ||
| White | x | x | ||
Figure 9 shows the time evolution of the pressure, air flow and tidal volume simulating the ventilation of an acute respiratory distress syndrome (ARDS) patient. The patient breathing rate was taken to be 20 breaths per minute5, the occlusion pressure is 6.65 cmH2O6, IPAP was set to 5 cmH2O and the EPAP was set to 13 cmH2O5. The color coding is as described in Table 2. It can be easily seen that MV output ventilation of the ARDS patient is very similar to that shown in Figure 8. The slight decrease in tidal volume is a result of the higher breathing rate which is recommended for patients with ARDS5. The low variance in the MV output with respect to the patient condition is a result of the fairly constant gas flow upon inhalation. This may be an advantage since it allows simple tuning of the ventilation parameters according the guidelines for specific respiratory syndromes.

The calculated pressure (a) flow (b) and tidal volume (c) time evolution in the lungs and at the control system solenoid valve. The patient breathing rate was taken to be 20 breaths per minute, the occlusion pressure is 6.65 cmH2O, IPAP was set to 5 cmH2O and the EPAP was set to 13 cmH2O. The color coding is as described in Table 2.
Perfect synchronization between the MV and the patient is obtained if the solenoid valve opens and closes exactly when the patient attempts to inhale and exhale. Thus, the synchronization level of the MV can be optimized by attempting to minimize the white and purple regions in the output plot.
In this study we provide a solution for the majority of the custom-designed ventilators created around the world in a response to the COVID-19 crisis. The simulator can lead to the opportunity to assure quality of the designed machines versus the digital twin model, analyze human response as compared to the realistic lung model and enable future, regulatory approved designs.
Open Science Framework: A simulation of a controlled medical ventilator with a realistic lungs model. https://doi.org/10.17605/OSF.IO/XJKC82.
This project contains the following underlying data:
Peep and Popoff calibration (data underlying Figure 5):
BaseWorkspace.mat (Base parameters data, Simulink® model initial function callback)
load_ventilator_variables_PEEP_2.m (Calibration of set PEEP 2 cmH2O experiment, variables calculation script, Simulink® model initial function callback. Input of simulated respiration, input gas flow, pressure regulation (PEEP and Popoff) and control valve settings)
load_ventilator_variables_PEEP_5.m (Calibration of set PEEP 5 cmH2O experiment, variables calculation script, Simulink® model initial function callback. Input of simulated respiration, input gas flow, pressure regulation (PEEP and Popoff) and control valve settings.)
load_ventilator_variables_PEEP_10.m (Calibration of set PEEP 10 cmH2O experiment, variables calculation script, Simulink® model initial function callback. Input of simulated respiration, input gas flow, pressure regulation (PEEP and Popoff) and control valve settings)
Plot_ventilator_output_PEEP_2.m (Output results plotting script, Simulink® model stop function callback)
Plot_ventilator_output_PEEP_5.m (Output results plotting script, Simulink® model stop function callback)
Plot_ventilator_output_PEEP_10.m (Output results plotting script, Simulink® model stop function callback)
Manshema_mechanical_lung_Plugged_lungs_exp_PEEP_2.slx (Calibration of set PEEP 2 cmH2O experiment, Simulink® simulation model file. Output pressure and flow prediction, underlying Figure 5)
Manshema_mechanical_lung_Plugged_lungs_exp_PEEP_5.slx (Calibration of set PEEP 5 cmH2O experiment, Simulink® simulation model file. Output pressure and flow prediction, underlying Figure 5)
Manshema_mechanical_lung_Plugged_lungs_exp_PEEP_10.slx (Calibration of set PEEP 10 cmH2O experiment, Simulink® simulation model file. Output pressure and flow prediction, underlying Figure 5)
RC and C values calibration (underlying Figure 6)
BaseWorkspace.mat (Base parameters data, Simulink® model initial function callback)
flow-10-peep-2-lung.csv (Flow measurement data with set peep 2 cmH2O and flow set 10 lpm at Easylung lung)
flow-10-peep-2-out.csv (Flow measurement data with set peep 2 cmH2O and flow set 10 lpm at expiratory output)
load_ventilator_variables_full_exp_10Lpmin_PEEP_2.m (Calibration of RC and C values with set PEEP 2 cmH2O experiment, variables calculation script, Simulink® model initial function callback. Input of simulated respiration, input gas flow, pressure regulation and control valve settings)
plot_ventilator_output_full_exp_10Lpmin_PEEP_2.m (Output results plotting script, Simulink® model stop function callback)
Manshema_mechanical_lung_timed_10Lpmin_PEEP_2.slx (Calibration of RC and C values for lungs model, at set PEEP 2 cmH2O experiment with 10 lpm, Simulink® simulation model file, raw pressure and flow prediction underlying Figure 6)
Model - MV prototype Comparison (underlying Figure 7)
∘ Lungs comparison 20Lpm, underlying Figure 7a and 7b
▪ BaseWorkspace.mat
Base parameters data, Simulink® model initial function callback.
▪ flow-20-peep-5-lung.csv
Flow measurement data with set peep 5 cmH2O and flow set 20 lpm at Easylung lung.
▪ flow-20-peep-5-out.csv
Flow measurement data with set peep 5 cmH2O and flow set 20 lpm at expiratory output.
▪ load_ventilator_variables_full_exp_20Lpmin_PEEP_5.m
Model and experiment comparison with set PEEP 5 cmH2O experiment, variables calculation script, Simulink® model initial function callback. Input of simulated respiration, input gas flow, pressure regulation and control valve settings.
▪ plot_ventilator_output_full_exp_20Lpmin_PEEP_5.m
Output results plotting script, Simulink® model stop function callback.
▪ Manshema_mechanical_lung_timed_20Lpmin_PEEP_5.slx
Model and experiment comparison at set PEEP 5 cmH2O experiment with 20 lpm, Simulink® simulation model file, raw pressure and flow prediction underlying Figures 7a and 7b.
∘ Lungs comparison 30Lpm (underlying Figure 7c and 7d)
▪ BaseWorkspace.mat
Base parameters data, Simulink® model initial function callback.
▪ flow-30-peep-5-lung.csv
Flow measurement data with set peep 5 cmH2O and flow set 30 lpm at Easylung lung.
▪ flow-30-peep-5-out.csv
Flow measurement data with set peep 5 cmH2O and flow set 30 lpm at expiratory output.
▪ load_ventilator_variables_full_exp_30Lpmin_PEEP_5.m
Model and experiment comparison with set PEEP 5 cmH2O experiment, variables calculation script, Simulink® model initial function callback. Input of simulated respiration, input gas flow, pressure regulation and control valve settings.
▪ plot_ventilator_output_full_exp_30Lpmin_PEEP_5.m
Output results plotting script, Simulink® model stop function callback.
▪ Manshema_mechanical_lung_timed_30Lpmin_PEEP_5.slx
Model and experiment comparison at set PEEP 5 cmH2O experiment with 30 lpm, Simulink® simulation model file, raw pressure and flow prediction underlying Figures 7c and 7d.
Healthy Patient model testing (underlying Figure 2, 3, 4 and 8)
∘ BaseWorkspace.mat
Base parameters data, Simulink® model initial function callback.
∘ load_variables_Healthy.m
Healthy patient lungs and breathing model simulation, variables calculation script, Simulink® model initial function callback. Input of simulated respiration, input gas flow, pressure regulation (PEEP and Popoff) and control valve settings.
∘ plot_output_Healthy.m
Healthy patient lungs and breathing model simulation output results plotting script, Simulink® model stop function callback, underlying Figure 8.
∘ Manshema_20Lpmin_PEEP_5_simulated_lung.slx
Healthy patient lungs and breathing Simulink® simulation model file, blocks model, underlying Figures 2, 3, 4 and raw pressure, flow and volume prediction underlying Figure 8.
ARDS patient model testing (underlying Figure 9)
∘ BaseWorkspace.mat
Base parameters data, Simulink® model initial function callback.
∘ load_variables_ARDS.m
ARDS patient lungs and breathing model simulation, variables calculation script, Simulink® model initial function callback. Input of simulated respiration, input gas flow, pressure regulation (PEEP and Popoff) and control valve settings.
∘ plot_output_ARDS.m
ARDS patient lungs and breathing model simulation output results plotting script, Simulink® model stop function callback, underlying Figure 9.
∘ Manshema_20Lpmin_PEEP_5_ARDS.slx
ARDS patient lungs and breathing Simulink® simulation model file, raw pressure, flow and volume prediction underlying Figure 9.
Open Science Framework: A simulation of a controlled medical ventilator with a realistic lungs model. https://doi.org/10.17605/OSF.IO/XJKC82.
This project contains the following extended data:
- Manshema_Sim_Parameters.csv (Table of input parameters and variables calculations for healthy and ARDS patients’ simulations)
- Manshema_Blocks_Properties.csv (Extended table of Simulink® blocks properties input parameters for all simulations)
Data are available under the terms of the Creative Commons Zero "No rights reserved" data waiver (CC0 1.0 Public domain dedication).
The authors wish to thank to all the people involved in the discussions and contributors to the brainstorming group originated at the Faculty of Engineering, Tel Aviv University: Nati Ben Hamo, Prof. Yoram Reich, Baruch Meierovich, Demitry Aronovsky, Yigal Edrey, and Danny Berko and all the members of the Manshema team: Mordechai Halfon, Dr. Elad Grozovsky, Roi Darnell, Ivry Shapira and Omri Mizrahi.
| Views | Downloads | |
|---|---|---|
| F1000Research | - | - |
|
PubMed Central
Data from PMC are received and updated monthly.
|
- | - |
Is the work clearly and accurately presented and does it cite the current literature?
Partly
Is the study design appropriate and is the work technically sound?
Partly
Are sufficient details of methods and analysis provided to allow replication by others?
No
If applicable, is the statistical analysis and its interpretation appropriate?
Not applicable
Are all the source data underlying the results available to ensure full reproducibility?
Yes
Are the conclusions drawn adequately supported by the results?
No
Competing Interests: No competing interests were disclosed.
Reviewer Expertise: Modeling of pulmonary physiology. Decision support for mechanical ventilation management.
At the request of the author(s), this article is no longer under peer review.
Alongside their report, reviewers assign a status to the article:
| Invited Reviewers | |
|---|---|
| 1 | |
|
Version 1 05 Nov 20 |
read |
Provide sufficient details of any financial or non-financial competing interests to enable users to assess whether your comments might lead a reasonable person to question your impartiality. Consider the following examples, but note that this is not an exhaustive list:
Sign up for content alerts and receive a weekly or monthly email with all newly published articles
Already registered? Sign in
The email address should be the one you originally registered with F1000.
You registered with F1000 via Google, so we cannot reset your password.
To sign in, please click here.
If you still need help with your Google account password, please click here.
You registered with F1000 via Facebook, so we cannot reset your password.
To sign in, please click here.
If you still need help with your Facebook account password, please click here.
If your email address is registered with us, we will email you instructions to reset your password.
If you think you should have received this email but it has not arrived, please check your spam filters and/or contact for further assistance.
Comments on this article Comments (0)